

Overview
How the ocean, its salinity and its warmth shape the monsoon
Two ocean swings that decide India's rain.
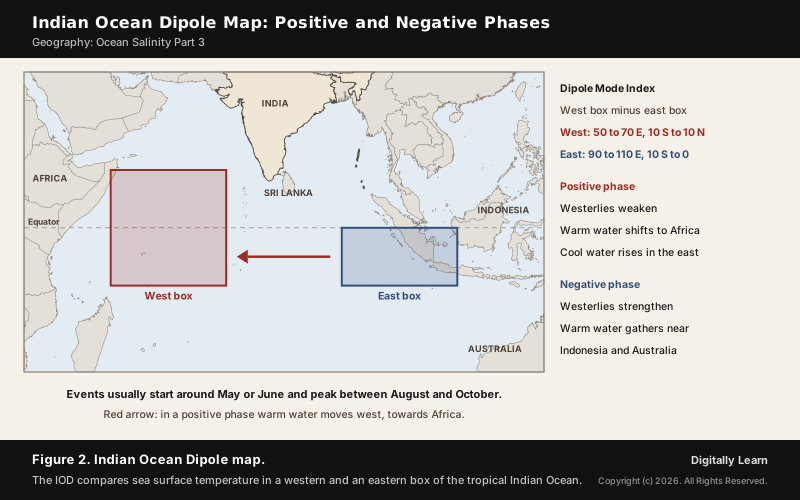
The Indian Ocean Dipole (IOD) is an irregular swing in sea surface temperatures in which the western Indian Ocean becomes alternately warmer (positive phase) and colder (negative phase) than the eastern part. With El Nino and La Nina in the Pacific, it is one of the ocean signals that decide how much rain the Indian monsoon brings, while ocean salinity records where water evaporates and where rain falls.
How the Ocean Shapes Climate: Heat, Sea Surface Temperature and Salinity
Sea Surface Temperature and the Ocean as a Heat Store
The ocean shapes climate because it holds far more heat than the air. Seawater has a much larger specific heat than air, so the top 2.5 m of the ocean holds as much heat as the entire atmosphere above it. The heat stored in the ocean's mixed layer is a source of the heat that drives global swings such as El Nino.
- A global sponge: The ocean absorbs about 90 per cent of the excess heat generated by climate change.
- Rising SST: Global mean sea surface temperature very likely rose by 0.88 °C between 1850 to 1900 and 2011 to 2020, with 0.60 °C of that between 1980 and 2020.
- Why SST matters: Sea surface temperatures modify air masses close to the shore, and warm SSTs can develop and strengthen cyclones.
- Signals for India: The two ocean swings that most affect the Indian monsoon are both patterns of SST: El Nino in the Pacific and the Indian Ocean Dipole.
Salinity as the Ocean's Rain Gauge: Evaporation and Precipitation
Salt does not evaporate, so the salinity of the surface records the water cycle. Where evaporation is strong the sea grows saltier; where precipitation or river water is added it grows fresher. That is why changes in rainfall and evaporation show up clearly in surface salinity.
- Evaporation and precipitation: The salinity of the surface layer depends mainly on these two.
- Rivers and ice: In coastal regions fresh water from rivers, and in polar regions the freezing and thawing of ice, change surface salinity.
- Wind and currents: Wind moves water from one area to another, and currents carry salinity with them.
- Global range: The average sea surface salinity is about 35 PSS, or 3.5 per cent salt, and it varies from 32 to 37 PSS.
Salinity is now measured from space. NASA's Aquarius instrument, on the Argentine SAC-D spacecraft, mapped sea surface salinity with radiometers that sense tiny changes in the ocean's microwave emission; the first salinity maps from space came from the European SMOS satellite, launched in November 2009. How salinity is distributed across the oceans is covered in Ocean Salinity Part 1.
Indian Ocean Dipole: Meaning, Phases and Effect on the Monsoon
What Is the Indian Ocean Dipole (IOD)
The Indian Ocean Dipole is a sustained change in the difference between the sea surface temperatures of the tropical western and eastern Indian Ocean. It has three phases, neutral, positive and negative, and it was first identified in 1999 by Indian climate researchers at the Indian Institute of Science.
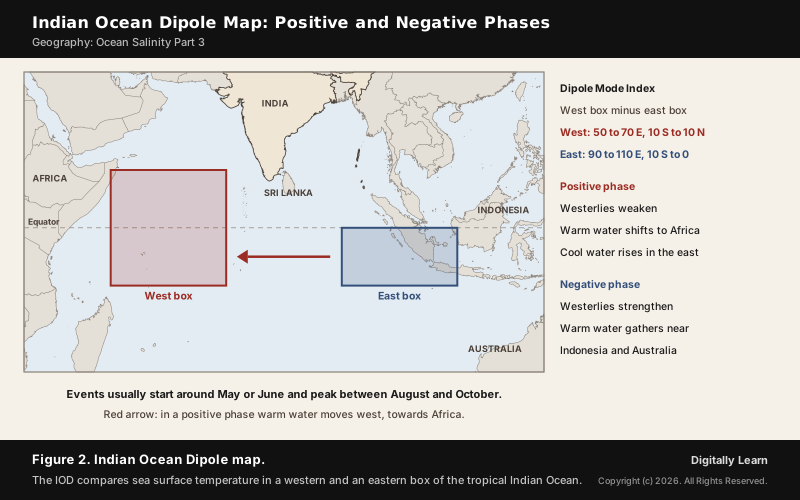
- Measuring it: The IOD is measured by the Dipole Mode Index (DMI): the difference in SST anomalies between a western box (50 to 70 degrees east, 10 degrees south to 10 degrees north) and an eastern box (90 to 110 degrees east, 10 degrees south to the equator).
- Timing: Events usually start around May or June, peak between August and October and then decay quickly when the monsoon arrives in the southern hemisphere at the end of spring.
- Frequency: On average about four positive and four negative events occur in 30 years, each lasting around six months; but there were 12 positive IODs between 1980 and 2009.
- Monitoring in India: The India Meteorological Department issues a bulletin on El Nino and the IOD, tracking the Dipole Mode Index and forecasting both with its Monsoon Mission coupled model.
Positive IOD and Negative IOD: Winds, Rainfall and Impacts
The two phases are driven by the winds along the equator. In a neutral phase, Pacific water flowing between the islands of Indonesia keeps the sea north-west of Australia warm, and westerly winds blow along the equator. A change in those winds tips the ocean one way or the other.
| Feature | Positive IOD | Negative IOD |
|---|---|---|
| Equatorial westerlies | Weaken | Strengthen |
| Warmer water | West, towards Africa | East, near Australia |
| Cooler water | East, where cold water rises | West |
| Rainfall | More in the western Indian Ocean | More in the eastern Indian Ocean |
| Drier areas | Indonesia and Australia | The western Indian Ocean |
- East Africa: A positive IOD brings more rain in the short rains of October to December; in the strong positive IOD of late 2019, East Africa received 300 per cent of its normal rainfall.
- Australia: Every major drought in southern Australia since 1889 has coincided with positive or neutral IOD phases, while a negative IOD brings more winter and spring rain to parts of southern Australia.
- Rare combinations: A strong negative IOD in October 2010, together with a strong La Nina, caused the 2010 to 2011 Queensland floods.
How the IOD Offsets El Nino and Lifts Monsoon Rain
The IOD matters to India because it can strengthen or weaken the monsoon. With a positive IOD, winds over the Indian Ocean blow from east to west, the Arabian Sea side of the ocean grows warmer and the area around Indonesia colder and drier; in negative years the reverse happens. A positive IOD often negates the effect of El Nino.
- Evidence: Positive IODs brought increased monsoon rain in 1983, 1994 and 1997.
- The 1997 case: The strong El Nino of 1997 did not cause drought in India; the IOD, discovered two years later, helped explain why.
- Two poles: The eastern pole, around Indonesia, and the western pole, off the African coast, affect monsoon rain both separately and together.
More on the IOD and the other drivers of the monsoon is in Climate Part 2 and Indian Monsoon Part 1.
El Nino, La Nina and the Walker Circulation
Walker Circulation and the Southern Oscillation
The Walker circulation is an east-west loop of air over the equatorial Pacific. Air rises over the warm western Pacific near Indonesia, where pressure is low, flows east aloft, sinks over the cooler eastern Pacific, where pressure is high, and returns west near the surface as the trade winds.
- Gilbert Walker: He became director-general of observatories in India in 1904 and studied the monsoon, whose failure had brought severe famine in 1899. He described a great seesaw of air pressure between the Indian and Pacific Oceans and coined the term Southern Oscillation in 1924.
- Southern Oscillation Index: It is measured by the difference in pressure between Tahiti in French Polynesia and Port Darwin in northern Australia. El Nino episodes have a negative index, with lower pressure over Tahiti and higher pressure at Darwin.
- The name: The meteorologist Jacob Bjerknes first used the term Walker Circulation in 1969.
- Strength: The Walker circulation is weaker during El Nino and stronger during La Nina.
El Nino and La Nina: What Happens in the Pacific
El Nino is the appearance of warm water off the coast of Peru. Warm water from the central Pacific drifts towards the South American coast and replaces the cool Peruvian current. It appears once every three to seven years and raises the temperature of the water on the Peruvian coast by 10 °C.
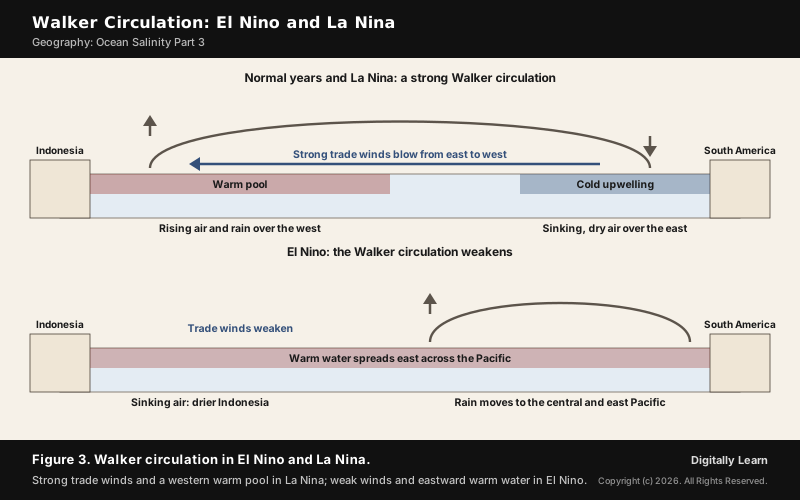
| Feature | El Nino | La Nina |
|---|---|---|
| Trade winds | Weaker than usual | Stronger than usual |
| Central and eastern Pacific | Warmer than average | Cooler than average |
| Indonesia | Below-average rain | More rain |
| Walker circulation | Weaker | Stronger |
| Indian monsoon | Weak, with drought | Strong |
- Name: El Nino means Child Christ, because the current appears around Christmas, a summer month in Peru.
- Fish: The warm water cuts the plankton, which reduces the number of fish in the sea.
- World effects: In strong ENSO years the arid west coast of South America gets heavy rain, Australia and sometimes India face drought, and China sees floods.
La Nina is the opposite condition. The tropical Pacific trade winds become very strong and an abnormal accumulation of cold water occurs in the central and eastern Pacific. The mechanism in full is in ENSO Part 1.
El Nino Modoki: Central Pacific El Nino
Not every El Nino warms the same part of the Pacific. The first pattern to be recognised warms the eastern Pacific. In the 1990s and 2000s a different pattern was noticed, with the warmth arising near the dateline in the central Pacific; it is called Central Pacific ENSO or ENSO Modoki, from a Japanese word meaning similar, but different.
- Hurricanes: El Nino Modoki is associated with more hurricanes, more often making landfall, in the Atlantic.
- Bay of Bengal: La Nina Modoki increases the frequency of cyclonic storms over the Bay of Bengal, while decreasing severe storms in the Indian Ocean overall.
- First recorded: The first El Nino recorded as starting in the central Pacific and moving east was in 1986.
El Nino, La Nina and the Indian Monsoon
ENSO has a pronounced influence on the south-west monsoon. In El Nino years the monsoon tends to be weak and brings drought; La Nina years bring particularly strong monsoons. Walker himself noticed that monsoon rain was often very poor in years of high pressure over Darwin and low pressure over Tahiti.
- Forecasting: El Nino is used in India to forecast long-range monsoon rainfall, and the India Meteorological Department assesses ENSO together with the IOD.
- Delayed onset: In the El Nino of 1990 to 1991 the onset of the south-west monsoon was delayed over most of the country by five to twelve days.
- A weaker link: In recent decades the ENSO effect on the monsoon has seemed to weaken, partly because the IOD can offset it.
The IOD and ENSO also act on each other. A positive IOD can produce El Nino-like warming in the far eastern Pacific, and the interaction between the two is thought to be key to the strongest super El Ninos. The Equatorial Indian Ocean Oscillation (EQUINOO), the atmospheric part of the IOD, helps explain failed forecasts such as the acute drought of 2002. How El Nino hits Indian farms and the economy is covered in ENSO Part 3.
Ocean Salinity, the Barrier Layer and Monsoon Forecasting
Bay of Bengal and Arabian Sea: Fresh Against Salty
The two seas beside India have opposite salinities. The Bay of Bengal is less salty because of the river water brought in by the Ganga; the Arabian Sea is saltier because of high evaporation and a low inflow of fresh water. The average salinity of the Indian Ocean is 35 parts per thousand.
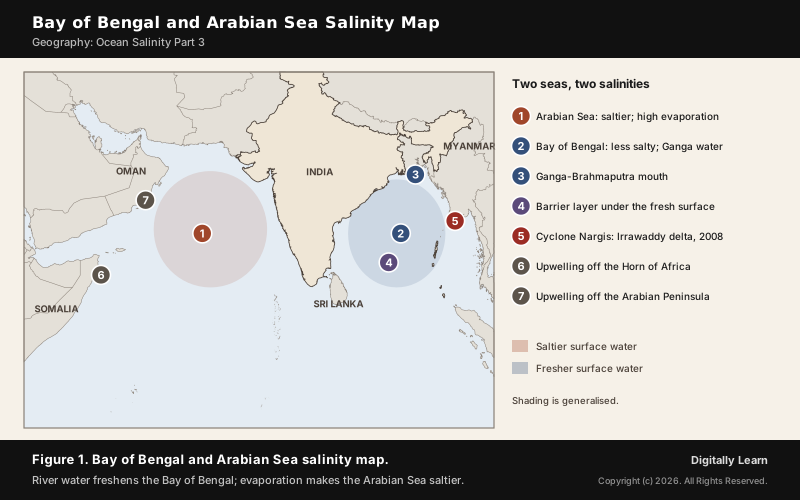
Fresh water on top of salty water sets up a barrier layer: a layer that separates the well-mixed surface layer from the thermocline. It forms where a fresh lens sits on top of the water column, as with the monsoon river runoff of the northern Indian Ocean, and in equatorial regions it can be as thick as 50 m. The salinity of the Indian seas in detail is in Ocean Salinity Part 5.
Barrier Layer and Cyclone Intensification in the Bay of Bengal
Salinity layering helps cyclones grow. Tropical cyclones need warm sea surface temperatures, commonly 26 to 27 °C or more. A passing cyclone normally cools the upper ocean by stirring up cold water from below, which can weaken it. Where a barrier layer holds that cold water down, the storm keeps its fuel.
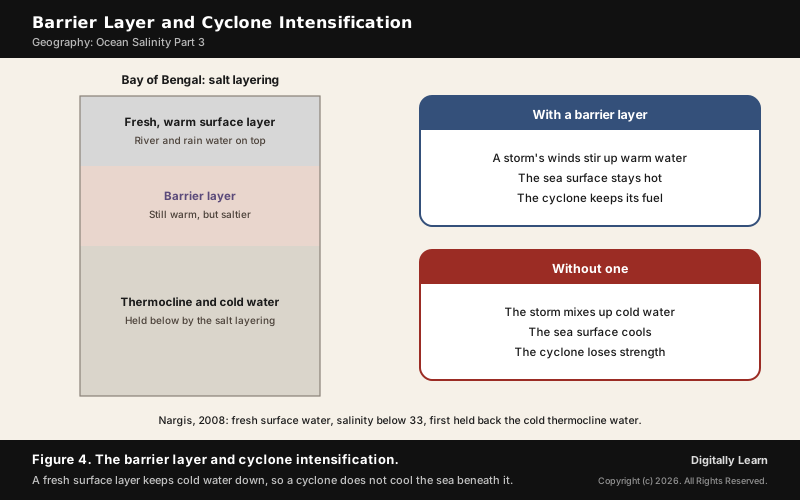
- Nargis, April 2008: Sea surface temperatures in the Bay of Bengal were 29 to 30 °C, and at first the mixing up of colder thermocline water was held back by low wind speeds and fresh surface salinities below 33.
- Landfall: Nargis struck Myanmar on 2 May 2008 with winds of about 210 km per hour and a storm surge of 3 to 4 m in the Irrawaddy delta; about 130,000 people were left dead or missing.
- Heat potential: Forecasters track the heat stored above the 26 °C isotherm, not only the surface temperature; high ocean heat content lets storms reach higher intensity.
- Rapid intensification: It needs water near or above 30 °C, deep enough that waves do not bring cooler water to the surface.
- Limits: A cyclone still weakens when it moves over cooler water, meets dry air or runs into vertical wind shear.
Cyclone formation in full is in Cyclones Part 1, and the effect of warming seas in Cyclones Part 12.
Ocean Mean Temperature and Monsoon Forecasting
Sea surface temperature describes only a thin skin of the ocean, while the heat that feeds monsoons and cyclones comes from the upper ocean. Ocean Mean Temperature (OMT) measures that deeper heat: it is the average temperature of the water from the surface down to the depth of the 26 °C isotherm.
- Where and when: OMT in the south-western Indian Ocean during January to March is a better qualitative predictor of the Indian summer monsoon than sea surface temperature.
- Hit rate: It predicted above- or below-average monsoon rain correctly 80 per cent of the time, against 60 per cent for SST, and did better than the January to March values of the El Nino, IOD and Modoki indices (52, 48 and 56 per cent).
- Depth: In that region the average depth of the 26 °C isotherm in January to March is 59 m.
- Why it works: OMT carries the ocean’s stored heat, which SST can hide when the surface warms or cools quickly.
Ocean Salinity, Climate Change and the Monsoon
Amplifying Water Cycle: Salty Seas Saltier, Fresh Seas Fresher
Warming is speeding up the water cycle, and salinity shows it. Long-term records show the global salinity pattern amplifying: high-salinity regions, dominated by evaporation, have become more saline, and low-salinity regions, dominated by rain, less saline. The IPCC finds it extremely likely that human influence contributed to this pattern of change in near-surface ocean salinity.
- More intense cycle: Continued warming is projected to intensify the global water cycle, including its variability, global monsoon rain and the severity of wet and dry events.
- Monsoon rain: Monsoon precipitation is projected to increase in the mid to long term, particularly over South and South East Asia.
- ENSO swings: Rainfall variability linked to El Nino is very likely to be amplified in the second half of the 21st century under intermediate and high emissions.
Warming Indian Ocean, Human Influence and a Changing Monsoon
The Indian Ocean is the warmest ocean in the world and it is warming fast. Records from 1901 to 2012 show the Indo-Pacific warm pool warming by about 1.2 °C; the ocean warmed at 1.2 °C per century between 1950 and 2020, and models project 1.7 to 3.8 °C per century from 2020 to 2100. Human-induced greenhouse warming and changes in El Nino and the IOD drive this warming, and the warmer Indian Ocean has weakened the Asian monsoon.
- Aerosols against greenhouse gases: Over South Asia in the 20th century, warming from greenhouse gases tended to increase monsoon rain, but cooling from human-caused aerosols reduced it.
- Cities: Urbanisation increases mean and heavy rainfall over and downwind of cities.
- Land surface: Changes in land use and irrigation alter how much sunlight the land reflects, a cooling influence alongside aerosols.
- The Atlantic link: If the Atlantic overturning circulation ever collapsed, the IPCC expects weaker African and Asian monsoons; Ocean Salinity Part 2 explains that circulation.
Previous Year UPSC-CSE Questions
Previous Year UPSC-CSE Questions By the end you will be able to draft model answers for the following UPSC questions. Each question carries a collapsible framework showing how to approach it in the exam.
- UPSC Prelims 2017 Prelims-GSWith reference to ‘Indian Ocean Dipole (IOD)’, sometimes mentioned in the news while forecasting Indian monsoon, which of the following statements is/are correct?
- IOD phenomenon is characterised by a difference in sea surface temperature between tropical Western Indian Ocean and tropical Eastern Pacific Ocean.
- An IOD phenomenon can influence an El Niño’s impact on the monsoon.
Select the correct answer using the code given below:
How to approach this Prelims question
Approach: Check where the two poles of the IOD lie, then recall the IOD-El Nino link.
Trap to watch: Statement 1 moves the eastern pole to the Pacific; both poles are in the Indian Ocean.
Key facts to recall:
- DMI: west box 50 to 70 E, east box 90 to 110 E
- Positive IODs lifted monsoon rain in 1997
Answer signal: 2 only, option (b).
- UPSC Prelims 2011 Prelims-GSLa Nina is suspected to have caused recent floods in Australia. How is La Nina different from El Nino ?
- La Nina is characterised by unusually cold ocean temperature in equatorial Indian Ocean whereas El Nino is characterised by unusually warm ocean temperature in the equatorial Pacific Ocean.
- El Nino has adverse effect on south-west monsoon of India, but La Nina has no effect on monsoon climate.
Which of the statements given above is/are correct ?
How to approach this Prelims question
Approach: Test the ocean named in statement 1 and the monsoon claim in statement 2.
Trap to watch: La Nina is a cold Pacific phase, not an Indian Ocean one, and it does affect the monsoon.
Key facts to recall:
- La Nina: cold water in the central and eastern Pacific
- La Nina years: strong monsoons
Answer signal: Neither 1 nor 2, option (d).
- UPSC Prelims 2010 Prelims-GSA new type of El Nino called El Nino Modoki appeared in the news. In this context, consider the following statements:
- Normal El Nino forms in the Central Pacific ocean whereas El Nino Modoki forms in Eastern Pacific ocean.
- Normal El Nino results in diminished hurricanes in the Atlantic ocean but El Nino Modoki results in a greater number of hurricanes with greater frequency.
Which of the statements given above is/are correct?
How to approach this Prelims question
Approach: Remember which El Nino is central and which is eastern.
Trap to watch: Statement 1 swaps the two locations.
Key facts to recall:
- Normal El Nino: eastern Pacific
- Modoki: central Pacific, near the dateline
Answer signal: 2 only, option (b).
- UPSC Prelims 2002 Prelims-GSFor short-term climate prediction, which one of the following events, detected in the last decade, is associated with occasional weak monsoon rains in the Indian sub-continent?
How to approach this Prelims question
Approach: Pick the event linked to weak monsoon rain and used in short-term prediction.
Trap to watch: La Nina is linked to strong, not weak, monsoons.
Key facts to recall:
- El Nino years: weak monsoon, drought
- IMD assesses ENSO with the IOD
Answer signal: El Nino and Southern Oscillations, option (c).
- UPSC Prelims 2020 Prelims-GSWith reference to Ocean Mean Temperature (OMT), which of the following statements is/are correct ?
- OMT is measured up to a depth of 26°C isotherm which is 129 meters in the south-western Indian Ocean during January-March.
- OMT collected during January-March can be used in assessing whether the amount of rainfall in monsoon will be less or more than a certain long-term mean.
Select the correct answer using the code given below :
How to approach this Prelims question
Approach: Check the depth figure in statement 1 and the forecasting use in statement 2.
Trap to watch: The 26 °C isotherm lies at about 59 m in that region in January to March, not 129 m.
Key facts to recall:
- OMT hit rate 80 per cent against 60 per cent for SST
- Measured in January to March
Answer signal: 2 only, option (b).
- UPSC Mains 2015 GS-IHow far do you agree that the behaviour of the Indian monsoon has been changing due to humanizing landscape? Discuss.
How to structure the answer in the exam
Introduction: The monsoon brings most of India's rain; its behaviour now reflects both human changes to land, air and sea and natural ocean swings.
Body (sub-themes to develop):
- Aerosols: they cooled the region and cut monsoon rain, offsetting greenhouse warming in the 20th century.
- Cities: urbanisation increases mean and heavy rain over and downwind of cities.
- Land use and irrigation: they change how much sunlight the land reflects.
- Warming Indian Ocean: fast warming and stronger El Ninos have weakened the Asian monsoon.
- Natural drivers: El Nino, La Nina and the IOD still set good and bad years.
Conclusion: Conclude that a humanised landscape is changing the monsoon, but through and alongside the ocean; forecasting and adaptation must track both.
- UPSC Mains 2024 GS-IWhat is sea surface temperature rise? How does it affect the formation of tropical cyclones?
How to structure the answer in the exam
Introduction: Sea surface temperature is the temperature of the water near the ocean surface; global mean SST very likely rose by 0.88 °C between 1850 to 1900 and 2011 to 2020.
Body (sub-themes to develop):
- Threshold: cyclones need surface water of about 26 to 27 °C or more.
- Intensity: higher SST and ocean heat content give faster and rapid intensification.
- Barrier layer: fresh surface water stops a storm cooling its own fuel, as with Nargis in 2008.
- Limits: wind shear and dry air can still stop a storm.
Conclusion: Conclude that warmer seas make strong cyclones more likely, so early warning and coastal preparedness matter more.
Sources
- NCERT: Fundamentals of Physical Geography (Class XI), Atmospheric Circulation and Water (Oceans)
- NCERT: India Physical Environment (Class XI), Climate
- India Meteorological Department: ENSO and IOD bulletin, February 2026
- Australian Bureau of Meteorology: Indian Ocean Dipole
- NOAA Climate.gov: El Nino and La Nina frequently asked questions
- NOAA GFDL: Ocean-atmosphere interactions during Cyclone Nargis (Eos, 2009)
- NOAA AOML: South-western Indian Ocean heat content and monsoon rainfall (Scientific Reports, 2018)
- IPCC AR6 Working Group I: Summary for Policymakers
- Wikipedia: Indian Ocean Dipole
- Wikipedia: El Nino-Southern Oscillation
- Wikipedia: Walker circulation
- Wikipedia: Monsoon of South Asia
- Wikipedia: Barrier layer (oceanography)
- Wikipedia: Tropical cyclone
- Wikipedia: Sea surface temperature
- Wikipedia: Effects of climate change on oceans
- UPSC: Civil Services Examination question papers
Editorial Disclaimer
This article draws on the NCERT geography textbooks, the India Meteorological Department, the Australian Bureau of Meteorology, NOAA, the IPCC and the other sources listed on this page. Climate research on the Indian Ocean is active, and some figures differ between sources.