
Overview
El Nino, La Nina and the Walker Circulation
How coupled Pacific ocean-atmosphere feedback drives the planet's largest interannual climate signal.
Previous Year UPSC-CSE Questions By the end you will be able to draft model answers for the following UPSC questions. Each question carries a collapsible framework showing how to approach it in the exam.
- UPSC Prelims 2015 General StudiesIn the South Atlantic and South-Eastern Pacific regions in tropical latitudes, cyclone does not originate. What is the reason?
How to approach this Prelims question
Approach: Rule out by elimination. Option 1 (low SSTs) is partially true but not the primary reason. Option 3 (Coriolis weak) is true near the equator but not specific to South Atlantic / SE Pacific. Option 4 (no land) does not apply to all regions. Option 2 is the canonical NOAA explanation: the ITCZ rarely migrates south of the equator into these regions, so the low-pressure trough needed to trigger tropical cyclogenesis is absent.
Trap to watch: Option 1 sounds plausible but is a secondary factor; the ITCZ-absence explanation is primary.
Key facts to recall:
- Tropical cyclogenesis requires SST above 26.5 deg C plus an ITCZ-anchored low-pressure trough
- South Atlantic and SE Pacific lie south of the equator where the ITCZ rarely migrates
- Coriolis force minimum at the equator limits tropical cyclone formation within 5 deg latitude
Answer signal: ITCZ seldom occurs; option B.
- UPSC Prelims 2024 General StudiesWhich of the following is/are correct inference/inferences from isothermal maps in the month of January?
- The isotherms deviate to the north over the ocean and to the south over the continent.
- The presence of cold ocean currents, Gulf Stream and North Atlantic Drift make the North Atlantic Ocean colder and the isotherms bend towards the north.
Select the answer using the code given below:
How to approach this Prelims question
Approach: Statement 1 is the canonical thermal-inertia framing: oceans retain heat in January (Northern Hemisphere winter), continents lose heat fast, so isotherms bow north over oceans and south over continents. Statement 2 misidentifies the Gulf Stream and North Atlantic Drift as cold currents; they are warm currents that keep the North Atlantic warmer than its latitude would otherwise indicate.
Trap to watch: Statement 2 mixes up warm-current identity. Gulf Stream is the canonical warm current of the Atlantic.
Key facts to recall:
- Oceans retain heat better than land due to higher specific heat capacity
- In January Northern Hemisphere winter, isotherms bow north over oceans and south over continents
- Gulf Stream and North Atlantic Drift are warm currents originating in the Gulf of Mexico
Answer signal: Only statement 1 correct; option 1 only.
- UPSC Prelims 2012 General StudiesConsider the following factors:
- Rotation of the Earth
- Air pressure and wind
- Density of ocean water
- Revolution of the Earth
Which of the above factors influence the ocean currents?
How to approach this Prelims question
Approach: Earth's rotation drives Coriolis force, which deflects ocean currents. Air pressure and wind transfer momentum to surface ocean (Ekman transport). Density differences in ocean water drive thermohaline circulation including deep-ocean conveyor belt. Revolution of the Earth around the sun affects seasonal solar input but not ocean current formation directly.
Trap to watch: Revolution is sometimes confused with rotation; only rotation contributes via Coriolis.
Key facts to recall:
- Coriolis force from Earth's rotation deflects ocean currents
- Wind stress (air pressure plus wind) drives surface ocean currents
- Density differences from salinity plus temperature drive thermohaline circulation
Answer signal: Factors 1, 2, and 3 influence ocean currents; option B.
The El Nino-Southern Oscillation (ENSO) is a coupled ocean-atmosphere phenomenon over the tropical Pacific that drives global climate variability on a 2-7 year timescale. ENSO has two oceanic phases, the warm El Nino (anomalously warm equatorial Pacific sea-surface temperatures) and the cold La Nina (anomalously cool), and one atmospheric component, the Southern Oscillation, which is the see-saw of surface air pressure between Tahiti in the eastern Pacific and Darwin in the western Pacific. The mechanism rests on the Walker Circulation, the equatorial overturning cell that ascends over the warm western Pacific and descends over the cool eastern Pacific. The Bjerknes feedback couples ocean and atmosphere; Kelvin and Rossby waves propagate the SST anomaly across the basin. Niño 3.4 SST anomaly ±0.5°C is the conventional ENSO threshold used by NOAA Climate Prediction Center.
Background: From Peruvian Fisher Folklore to Coupled Climate Science
The El Nino-Southern Oscillation is the single most important inter-annual climate signal globally. It shapes monsoon performance, agricultural output, drought-flood balance, and global temperature in roughly two years out of every five. The coupled-system mechanism is a prerequisite for UPSC GS-I (physical geography) and GS-III (agriculture, disaster management, climate change) questions across multiple cycles.
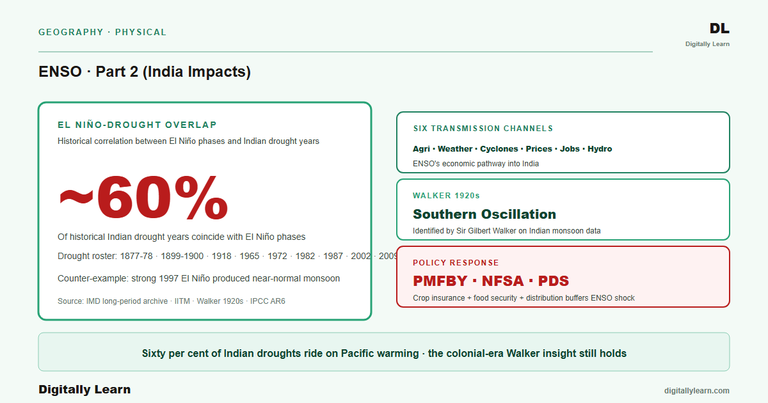
What is the significance of the coupled ocean-atmosphere framing? The phenomenon began as two independent observations. Peruvian fisher communities named the warm coastal current appearing around Christmas El Nino, the Christ Child. Sir Gilbert Walker at the India Meteorological Department in the early twentieth century identified an atmospheric counterpart in pressure fluctuations across the tropical Pacific and named it the Southern Oscillation. The two strands remained separate until 1969, when Jacob Bjerknes published the first coupled ocean-atmosphere theory linking ocean warming to weakened trade winds and atmospheric circulation shifts. The Bjerknes synthesis is the foundation of modern ENSO science.
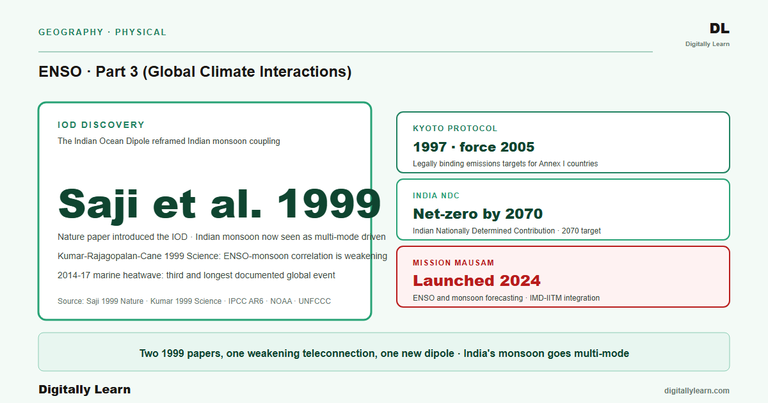
Modern ENSO monitoring rests on the TAO and TRITON buoy array in the equatorial Pacific and on satellite altimeters. Coupled forecast models at NOAA Climate Prediction Center, IRI Columbia, and India's Ministry of Earth Sciences issue routine ENSO outlooks that feed national agricultural and disaster-management policy. ENSO sits alongside the Indian Ocean Dipole and the Madden-Julian Oscillation as the principal climate-modulating modes affecting the Indian subcontinent.
Introduction to ENSO: Definition, Coupled Ocean-Atmosphere Phenomenon, Components, and Historical Origins
Defining the cycle and its three phases
What ENSO means and how phases are defined
ENSO is the periodic see-saw of sea-surface temperatures, trade-wind strength, and atmospheric pressure across the equatorial Pacific Ocean. The system oscillates between a warm phase (El Niño), a cold phase (La Niña), and a neutral state. By international convention, phases are defined by sustained sea-surface temperature anomalies in the central equatorial Pacific. The threshold is plus or minus 0.5 degrees Celsius across five overlapping three-month seasons.
Why ENSO is a coupled phenomenon, not just an ocean event
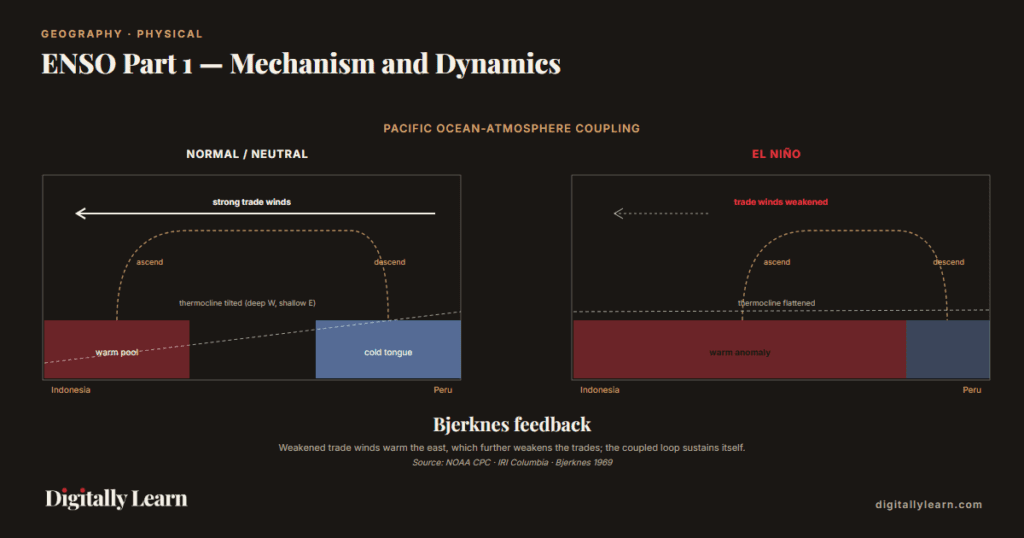
ENSO is not an ocean event with atmospheric consequences, nor an atmospheric event with oceanic consequences. It is a coupled phenomenon: a feedback loop in which weakened trade winds allow warm water to spread eastward. The warmer eastern Pacific further weakens the trade winds, and the loop sustains itself until ocean-wave dynamics force a reversal. Jacob Bjerknes named this self-reinforcing mechanism in 1969.
The three components: El Nino, La Nina, and the Southern Oscillation
- El Niño: The warm-phase oceanic component, marked by warmer-than-average sea-surface temperatures across the central and eastern equatorial Pacific.
- La Niña: The cold-phase oceanic component, marked by cooler-than-average sea-surface temperatures across the same region.
- Southern Oscillation: The atmospheric component, a pressure see-saw between Tahiti (south-central Pacific) and Darwin (northern Australia).
Historical Background of ENSO Studies
How Peruvian fishers named El Nino and La Nina
Peruvian fisher communities along the Pacific coast had observed a warm southward current for generations. It appeared around Christmas, disrupting the cold Humboldt Current and the anchoveta fishery dependent on it. The name El Nino, Spanish for the Christ Child, referenced this Christmas timing. La Nina, the girl child, was coined much later as the inverse counterpart for the symmetric cold-phase pattern.
Why ENSO dominates global interannual climate variability
ENSO is the dominant source of inter-annual climate variability on Earth outside the seasonal cycle itself. It influences rainfall, temperature, and extreme-weather patterns on every inhabited continent. The Indian monsoon, the El Niño-Southern Oscillation, and the Indian Ocean Dipole together explain the bulk of year-to-year variation in India's agricultural and water-resource outcomes.
How teleconnections carry ENSO signals worldwide
ENSO links the tropical Pacific to the global atmosphere through teleconnections, the pressure and temperature anomalies that propagate poleward and across ocean basins. Through these pathways ENSO shifts the position and strength of jet streams. It also displaces major precipitation bands and alters the frequency of droughts and floods in regions far from the Pacific itself.
Oceanic and Atmospheric Basis of ENSO: Pacific Circulation, Trade Winds, Walker Circulation, Southern Oscillation, Thermocline
Pacific Ocean-Atmosphere Interaction
How surface currents move warm water westward
The coupled Pacific system is the foundation of ENSO. The equatorial Pacific is the largest connected ocean surface on Earth, so small thermal anomalies along it propagate atmospherically through teleconnections that shape weather from East Africa to South America. The mechanism that produces El Nino and La Nina operates entirely within this coupled system, which is why any answer begins with Pacific circulation, trade winds, and Walker-cell geometry.
The equatorial Pacific is dominated by westward-flowing surface currents driven by the easterly trade winds. The South Equatorial Current carries warm water from off South America toward the west, where it piles up against the maritime continent of Indonesia, the Philippines, and northern Australia. A subsurface counter-current, the Equatorial Undercurrent, flows eastward at depths of about 100 to 200 metres.
What the neutral Pacific looks like
Under neutral or near-normal conditions, the eastern equatorial Pacific is several degrees cooler than the western Pacific. The trade winds blow steadily westward. The thermocline, the boundary between warm surface water and cold deep water, tilts shallow in the east and deep in the west. The Walker Circulation cell carries air upward over the warm western Pacific and downward over the cooler eastern Pacific.
How the Walker cell links west and east Pacific
How easterly trade winds set the SST gradient
The tropical easterly trade winds are the primary surface engine of the Pacific coupled system. They blow westward across the equator, dragging warm surface water into the western Pacific warm pool around Indonesia and lifting cool subsurface water along the South American coast. The strength of the trades sets the depth of the equatorial thermocline and the magnitude of the east-west SST gradient that defines the normal state of ENSO.
Sea Surface Temperature (SST) Distribution
Why the western Pacific stays warmer than the east
Under normal conditions the western Pacific, around Indonesia and the Philippines, is the warmest expanse of ocean on Earth, with sea-surface temperatures that routinely sit above 29 degrees Celsius. The eastern Pacific, off the Peru coast, is several degrees cooler because of equatorial upwelling and the cold Humboldt Current.
This zonal SST gradient drives the Walker Circulation and is itself sustained by it. Warm air rises in the west while the trade winds drag warm water westward at the surface, and cold-water exposure in the east cools the lower atmosphere. The gradient collapses during El Nino and intensifies during La Nina.
| Feature | Normal/Neutral | El Niño (warm phase) | La Niña (cold phase) |
|---|---|---|---|
| Trade winds (easterly) | Steady, moderate | Weakened or reversed | Strengthened |
| Eastern Pacific SST | Cool (cold tongue) | Warm anomaly above +0.5 C | Cold anomaly below -0.5 C |
| Western Pacific SST | Very warm (~29+ C) | Warm pool weakened/shifted east | Warm pool intensified |
| Thermocline (eastern Pacific) | Shallow (~50 m) | Deepens (~150 m) | Shallows further |
| Upwelling (Peru coast) | Active | Suppressed | Intensified |
| Walker Circulation | Vigorous | Weakened or reversed | Strengthened |
| Indonesian rainfall | Heavy | Reduced (drought risk) | Enhanced (flood risk) |
| Peruvian coastal rainfall | Minimal | Heavy (flood risk) | Minimal |
How the tilted thermocline gates cold water
The thermocline marks the steep vertical temperature gradient that separates the warm surface mixed layer from the cold deep ocean. Across the equatorial Pacific it tilts, sitting shallow (about 50 metres) in the east and deep (about 150 metres) in the west. The asymmetry exists because the trade winds pile warm water westward.
During El Nino, the wind weakening lets the thermocline flatten or even reverse its tilt. The eastern Pacific is then cut off from the cold subsurface water that normally upwells to the surface, so the cold tongue fades and surface temperatures climb.
Why upwelling off Peru feeds the anchoveta fishery
The cold Humboldt Current flows northward along the Peru coast and turns westward at the equator. Coastal winds drive surface water offshore, and cold nutrient-rich subsurface water rises to replace it. This upwelling sustains one of the world's most productive marine ecosystems and the Peruvian anchoveta fishery. El Nino suppresses upwelling because warm surface water blocks the rise, causing fishery collapse and coastal flooding, the disruption first noted by Peruvian fishers.
El Niño: Warm-Phase Mechanism, Trade-Wind Collapse, Eastern Pacific Warming, and Canonical vs Modoki Types
Concept and Mechanism
What defines an El Nino event
El Nino is the warm phase of ENSO. It is a sustained warming of sea-surface temperatures across the central and eastern equatorial Pacific, paired with weakened or reversed easterly trade winds. The NOAA operational definition requires Nino 3.4 SST anomalies to exceed +0.5 degrees Celsius for five overlapping three-month seasons. The same threshold is used internationally.
How an El Nino builds over several months
An El Nino typically develops over several months, often beginning in boreal spring and peaking in northern-hemisphere winter (November to January). The development sequence is a coupled cascade in which each step reinforces the next. The cascade continues until the warm anomaly extends across the central and eastern Pacific and the Walker Circulation has weakened or reversed.
- Weakening of trade winds: Easterly trade winds slacken across the central Pacific.
- Eastward shift of warm water: The warm pool that normally accumulates over the maritime continent begins to spread eastward.
- Suppression of upwelling: Reduced wind-driven offshore flow allows surface warming along the Peru coast.
- Deepening of eastern thermocline: Warm water displaces the cold subsurface layer downward.
- Collapse of Walker Circulation: The ascending branch shifts from the western Pacific to the central Pacific, decoupling convection from its normal Indonesia anchor.
- Atmospheric teleconnections: Upper-level anomalies propagate poleward and across basins, reshaping rainfall and temperature globally.
Why eastern Pacific upwelling shuts down
How a westerly wind burst weakens the trades
An El Niño event begins when the tropical easterly trade winds weaken, often triggered by a westerly wind burst in the western Pacific. The relaxation allows the warm pool to slosh eastward across the basin. NOAA Climate Prediction Center observes the wind anomaly through the Tropical Atmosphere Ocean buoy array, the earliest measurable signal that ocean-atmosphere coupling is shifting.
How a Kelvin wave pushes warm water east
Once the trades weaken, the downwelling Kelvin wave propagates the warm water eastward along the equator at roughly 2.5 metres per second, reaching the South American coast in two to three months. The eastward shift suppresses upwelling of cold subsurface water and warms the eastern Pacific surface, completing the first ocean-side feedback of the Bjerknes loop.
Why the Walker cell collapses during El Nino
With the warm pool shifted east, the ascending branch of the Walker Circulation moves from the western Pacific to the central Pacific. Convection over Indonesia collapses while convection over the central and eastern Pacific intensifies. The atmospheric pressure gradient reverses, the trade winds weaken further, and the system locks into a self-reinforcing El Niño state.
How the Nino 3.4 signature confirms a mature event
The mature El Niño signature is the Niño 3.4 SST anomaly in the central equatorial Pacific. Anomalies above +0.5 degrees Celsius for five consecutive overlapping seasons trigger an official NOAA El Niño declaration. Strong events such as 1997/98 and 2015/16 exceeded +2.0 degrees; extreme events such as 1982/83 approached +2.5 degrees Celsius.
How Rossby wave trains carry El Nino worldwide
The displaced central-Pacific convection radiates Rossby wave trains through the upper troposphere, modulating weather across the globe. South American rainfall increases, Australian and Indonesian rainfall decreases, North American winter weather warms in the north and wets in the south, and Indian monsoon strength weakens through the Walker-circulation teleconnection over the Indian Ocean.
Characteristics of El Niño
Where the warm anomaly concentrates
El Niño is the warm phase of the cycle: anomalously warm sea-surface temperatures across the central and eastern equatorial Pacific. The warmth is concentrated in a band roughly five degrees north to five degrees south of the equator, extending from the dateline to the South American coast.
How strong an event must be to count
Strong El Nino events produce Nino 3.4 SST anomalies above +1.5 C; very strong events (1997/98 and 2015/16) exceeded +2.0 C; extreme events (1982/83) approached +2.5 C. Even moderate El Ninos with anomalies between +0.5 and +1.0 C produce detectable global rainfall and temperature signatures.
Where El Nino reshapes weather worldwide
- Northern North America: Warmer-than-average winters.
- Southern United States: Wetter-than-average winters.
- North Atlantic: Reduced hurricane activity (enhanced vertical wind shear).
- Southern Africa: Drier conditions and elevated drought risk.
- West and East Africa: Weakened African monsoon and reduced summer rainfall.
How strong and moderate events differ
| Tier | Niño 3.4 anomaly | Representative events | Teleconnection signature |
|---|---|---|---|
| Extreme | Above +2.0 C | 1982/83 (~+2.5 C), 1997/98 (~+2.3 C), 2015/16 (~+2.6 C) | Sharp global rainfall and temperature departures; severe Indonesia drought; substantial Indian monsoon shortfall; widespread Pacific coral bleaching |
| Strong | +1.5 to +2.0 C | 1972/73, 1987/88, 1991/92 | Clear global signature; Indian monsoon usually below normal; Atlantic hurricane suppression detectable |
| Moderate | +1.0 to +1.5 C | 2002/03, 2009/10, 2018/19 | Detectable teleconnections; impacts vary spatially; Indian monsoon impact variable |
| Weak | +0.5 to +1.0 C | 2004/05, 2006/07, 2014/15 | Weaker teleconnections; some seasons show near-neutral global response |
How El Nino redistributes global rainfall
El Niño redistributes global rainfall patterns through the displaced Walker Circulation. The Indonesia-Australia-Philippines monsoon weakens, the eastern Pacific receives anomalous rainfall, the African Sahel sees drought-leaning anomalies, and the Indian south-west monsoon performs below normal on the all-India average. The rainfall shift is measurable in IMD and NOAA gridded data within months of the SST anomaly.
How often and how long El Nino lasts
Classical El Niño events recur every two to seven years, with no fixed periodicity. Individual events typically last nine to twelve months, peak in northern-hemisphere winter, and decay through the following spring. Recent decades show a tendency toward central-Pacific (Modoki) flavours and occasional multi-year persistence, which IPCC AR6 attributes to ongoing climate-change modulation.
La Niña: Cold-Phase Mechanism, Strengthened Trade Winds, Walker Circulation Intensification, and Multi-Year Events
Concept and Mechanism
What defines a La Nina event
La Niña is the cold phase of ENSO: sustained cooling of sea-surface temperatures across the central and eastern equatorial Pacific paired with strengthened easterly trade winds. The operational definition mirrors El Niño: Niño 3.4 SST anomalies below -0.5 C for five overlapping three-month seasons.
How stronger trades sharpen the SST gradient
La Niña begins (or strengthens) with an intensification of the easterly trade winds across the equatorial Pacific. The strengthened winds drag warm surface water more vigorously westward, sharpen the zonal SST gradient, and reinforce the Walker Circulation.
Why the eastern Pacific cools further
- Step 1: Trade winds intensify: Easterly anomaly strengthens across the equatorial Pacific.
- Step 2: Westward warm-water transport: Surface flow piles warm water more vigorously against Indonesia.
- Step 3: Upwelling intensifies: Ekman transport offshore from Peru rises; deeper cold water reaches the surface.
- Step 4: Eastern Pacific cools: Cold tongue sharpens and extends westward, sometimes past the dateline.
- Step 5: Thermocline shoals: The eastern thermocline rises closer to the surface, locking in the cold-water access.
- Step 6: Walker Circulation strengthens: Sharpened SST gradient drives more vigorous ascending branch over the warm pool; descending branch over the cold tongue strengthens.
How upwelling builds the equatorial cold tongue
La Niña is initiated by a strengthening of the trade winds, often following the collapse of a preceding El Niño. Stronger easterlies enhance equatorial upwelling along the South American coast, bringing cold subsurface water to the surface in the eastern Pacific. The resulting cold tongue of the equatorial Pacific is the defining oceanic signature of La Niña.
How the steeper gradient supercharges the Walker cell
With cold water in the east and warm water in the west, the east-west SST gradient steepens. The Walker Circulation intensifies, with stronger ascent over Indonesia and stronger descent over the eastern Pacific. The intensified atmospheric circulation reinforces the trade winds, locking the system into a self-sustaining La Niña state through the Bjerknes feedback in its opposite phase.
Why convection intensifies over the western Pacific
Strengthened ascent over the western Pacific produces enhanced convection and rainfall over Indonesia, the Philippines, and northern Australia. The Indian monsoon strengthens through the favourable Walker teleconnection. La Niña years such as 2010-11 and 2020-22 produced above-normal Indian monsoon rainfall and concurrent Australian flooding driven by the intensified convective regime.
Characteristics of La Niña
How far the cold tongue extends
La Nina is the cold phase of ENSO: anomalously cool surface waters across the central and eastern equatorial Pacific. The cold-tongue signature extends further westward than during neutral conditions, sometimes reaching the dateline.
Why the zonal SST contrast is exaggerated
The defining oceanographic signature is an exaggerated zonal SST gradient: very warm in the west (warm pool intensified), very cold in the east (cold tongue intensified). The gradient drives a strengthened Walker Circulation and tighter coupling of ocean and atmosphere.
Where La Nina reshapes weather worldwide
- Indian subcontinent and Southeast Asia: Enhanced monsoon rainfall, above-normal seasonal totals.
- Eastern Australia: Heavy rainfall and flooding (the 2010-11 Queensland floods are the canonical example).
- Southern United States and parts of South America: Drought and below-normal winter rainfall.
- Northern United States and Canada: Cooler-than-average winters.
- North Atlantic basin: Increased hurricane activity (reduced vertical wind shear).
Why some La Nina events last several years
| Episode | Duration | Peak Niño 3.4 anomaly | Notable impacts |
|---|---|---|---|
| 1973-1976 (triple-dip) | About 3 years | Around -2.0 C (peak) | First multi-year La Niña of the satellite era; cumulative impacts on Pacific Rim climates |
| 1998-2001 (triple-dip) | About 3 years | Around -1.7 C (peak) | Three consecutive enhanced Indian monsoon seasons; Australian wet years |
| 2010-2012 (double-dip) | About 2 years | Around -1.6 C (peak) | 2010-11 Queensland floods; record Australian wet season |
| 2020-2022 (triple-dip) | About 3 years | Around -1.2 C (peak) | First triple-dip of the 21st century; sustained Australian flooding; enhanced South-Asian monsoon |
How often La Nina recurs and why it lingers
La Niña recurs less frequently than El Niño but tends toward multi-year persistence. The 2020-22 triple-dip La Niña was the first three-year event since 1973-76 and produced sustained Indian-monsoon enhancement plus extended Australian flooding. IPCC AR6 documents the persistence shift and attributes it to evolving tropical-Pacific mean-state changes under warming.
ENSO Cycle and Dynamics: Life Cycle Phases, Bjerknes Feedback, Kelvin and Rossby Waves, Monitoring Indices
ENSO Neutral Conditions
ENSO neutral conditions are the intermediate state in which neither El Nino nor La Nina is active. Nino 3.4 SST anomalies stay within plus or minus 0.5 C of the climatological mean and the Southern Oscillation Index hovers near zero. Neutral states can persist for many months between events.
Oscillatory Nature of ENSO
ENSO is not strictly periodic but it is recurrent. Warm, cold, and neutral phases alternate over time scales of two to seven years, and the amplitude and duration vary substantially from event to event. The oscillation arises from two opposing tendencies: the Bjerknes feedback is positive and amplifies departures from equilibrium, while slower ocean-wave dynamics are negative and eventually reverse the imbalance.
Prelims MCQ practice
Each question below tests one specific concept on the topic. Click to reveal the answer and a full option-wise explanation.
Q1. Consider the following statements about the El Nino-Southern Oscillation (ENSO):
- ENSO is a coupled ocean-atmosphere phenomenon centred on the tropical Pacific.
- El Nino refers to anomalous warming of central and eastern tropical Pacific sea-surface temperatures.
- ENSO operates independently of any atmospheric pressure pattern.
Which of the statements given above are correct?
- 1 and 2 only
- 2 and 3 only
- 1 and 3 only
- 1, 2 and 3
Show answer and explanation
Answer: 1 and 2 only
Explanation.
Correct: a (1 and 2 only). Statement 1 is correct: ENSO is a coupled ocean-atmosphere phenomenon over the tropical Pacific. Statement 2 is correct: El Nino is anomalous warming of central/eastern tropical Pacific SSTs (Nino 3.4 region typically used as index). Statement 3 is wrong: ENSO is COUPLED with the Southern Oscillation atmospheric pressure see-saw between Tahiti and Darwin; the two are inseparable (the 'Southern Oscillation' is the atmospheric half).
Q2. Consider the following statements about the Bjerknes feedback mechanism:
- Bjerknes feedback is the positive coupled ocean-atmosphere feedback that sustains ENSO anomalies.
- In a warm-phase Bjerknes loop, a warm SST anomaly weakens the trade winds, which further warms the eastern Pacific, sustaining the anomaly.
- Bjerknes feedback is exclusively a negative feedback that damps any SST anomaly within days.
Which of the statements given above are correct?
- 1 and 2 only
- 2 and 3 only
- 1 and 3 only
- 1, 2 and 3
Show answer and explanation
Answer: 1 and 2 only
Explanation.
Correct: a (1 and 2 only). Statement 1 is correct: Bjerknes feedback is the POSITIVE coupled feedback sustaining ENSO anomalies. Statement 2 is correct: warm SST weakens trades, which warms eastern Pacific further, sustaining anomaly. Statement 3 is wrong: Bjerknes is POSITIVE not negative; negative feedbacks (delayed-oscillator, recharge-oscillator) eventually terminate ENSO events, but Bjerknes itself amplifies.
Q3. Consider the following statements about the Southern Oscillation Index (SOI):
- SOI is the standardised pressure difference between Tahiti and Darwin.
- Negative SOI corresponds to El Nino conditions and positive SOI to La Nina conditions.
Which of the statements given above is/are correct?
- 1 only
- 2 only
- Both 1 and 2
- Neither 1 nor 2
Show answer and explanation
Answer: Both 1 and 2
Explanation.
Correct: c (Both 1 and 2). Statement 1 is correct: SOI is the standardised pressure difference between Tahiti and Darwin. Statement 2 is correct: negative SOI corresponds to El Nino (high pressure over Darwin, low over Tahiti, the reverse of normal), positive SOI to La Nina (intensified normal pattern).
Q4. Consider the following statements about La Nina:
- La Nina is the cold phase of ENSO featuring stronger-than-normal trade winds and cooler-than-normal central-eastern Pacific SSTs.
- La Nina is generally associated with stronger Indian Southwest Monsoon rainfall, the opposite of El Nino's typical impact.
Which of the statements given above is/are correct?
- 1 only
- 2 only
- Both 1 and 2
- Neither 1 nor 2
Show answer and explanation
Answer: Both 1 and 2
Explanation.
Correct: c (Both 1 and 2). Statement 1 is correct: La Nina is ENSO cold phase with stronger trades and cooler central-eastern Pacific SSTs. Statement 2 is correct: La Nina is generally associated with stronger Indian Southwest Monsoon (the opposite of El Nino's typical deficit-monsoon teleconnection); the ENSO-monsoon linkage is one of the most-studied teleconnections globally.
Q5. Consider the following statements about the Walker Circulation:
- Walker Circulation is the east-west atmospheric circulation cell over the equatorial Pacific.
- Walker Circulation has rising air over the warm western Pacific and sinking air over the cool eastern Pacific in the normal (neutral or La Nina) phase.
- Walker Circulation collapses or reverses during strong El Nino events.
Which of the statements given above are correct?
- 1 and 2 only
- 2 and 3 only
- 1 and 3 only
- 1, 2 and 3
Show answer and explanation
Answer: 1, 2 and 3
Explanation.
Correct: d (1, 2 and 3). All three statements are correct. Walker Circulation is the equatorial Pacific east-west cell with rising air over the western warm pool and sinking over the cool eastern Pacific in neutral phase. Strong El Nino events weaken or reverse the Walker Circulation as the warm pool shifts eastward.
Q6. Consider the following statements about ENSO monitoring indices:
- The Nino 3.4 region (covering 5°N to 5°S, 170°W to 120°W) is the standard region for ENSO state monitoring.
- Oceanic Nino Index (ONI) is the 3-month running mean of SST anomalies in the Nino 3.4 region.
- An El Nino event is typically declared when ONI exceeds plus 0.5 degrees Celsius for five consecutive overlapping 3-month seasons.
Which of the statements given above are correct?
- 1 and 2 only
- 2 and 3 only
- 1 and 3 only
- 1, 2 and 3
Show answer and explanation
Answer: 1, 2 and 3
Explanation.
Correct: d (1, 2 and 3). All three statements are correct. Nino 3.4 (5N-5S, 170W-120W) is the standard ENSO monitoring region. ONI is the 3-month running mean of SST anomalies in this region. El Nino is declared when ONI exceeds +0.5 degrees C for at least 5 consecutive overlapping 3-month seasons per NOAA definition.
Sources and Further Reading
- NCERT Class 11 India: Physical Environment, Chapter 4 – Climate
- NOAA Climate Prediction Center, El Niño/Southern Oscillation (ENSO) diagnostic discussion
- India Meteorological Department, Long Range Forecast and ENSO advisories
- Bureau of Meteorology Australia, ENSO Wrap-Up and SOI archive
- International Research Institute for Climate and Society (IRI), Columbia University, ENSO forecasts
- Wikipedia, El Niño-Southern Oscillation overview article
- Ministry of Earth Sciences, Government of India, Monsoon Mission and Mission Mausam
- IPCC AR6 Working Group I, Chapter 8 (Water Cycle Changes) and Chapter 11 (Weather and Climate Extreme Events)
- TAO/TRITON moored buoy array (NOAA Pacific Marine Environmental Laboratory)
Editorial Disclaimer
This article is an educational resource for UPSC-CSE preparation. ENSO indices and event classifications are operational and subject to revision by the issuing agencies. Readers should consult NOAA, IMD, and IPCC for the latest advisories.