

Overview
Salinity of ocean water, or sea water salinity, is the total amount of salt dissolved in it, measured as the grams of salt in 1,000 grams (1 kg) of seawater and written in parts per thousand (‰ or ppt). The average salinity of the oceans is about 35‰: every kilogram of seawater holds about 35 grams of dissolved salts, so about 3.5 per cent of its weight is salt. Ocean salinity is set mainly by evaporation and precipitation, river inflow and the freezing and melting of ice, and it varies both across the oceans and with depth.
Salinity of Ocean Water: Meaning, Average and Units
What Is Salinity of Ocean Water?
All natural water, whether rain water or ocean water, contains dissolved mineral salts. Salinity is the term for the salt content in sea water, the total of all its dissolved salts. It is calculated as the amount of salt, in grams, dissolved in 1,000 grams of seawater, and expressed in parts per thousand. The symbol ‰ works like per cent, but out of a thousand instead of a hundred, so the average salinity of ocean water, about 35‰, equals about 3.5 per cent.
Salinity is more than a chemistry fact because it works together with temperature. With temperature and pressure it governs the density of seawater, and density decides which water sinks and how the ocean moves. That is why salinity, temperature and density are described as interrelated: a change in one changes the others.
- Open ocean range: The salinity of the normal open ocean lies between 33‰ and 37‰.
- Brackish limit: 24.7‰ is taken as the upper limit that separates brackish water from sea water.
- Freezing point: Salt lowers the freezing point, so seawater of typical salinity freezes at about −2 °C, not at 0 °C.
- Density: The average density of surface seawater is 1.025 kg per litre, heavier than fresh water, because the dissolved salts add more mass than volume.
- Isohaline: A line on a map joining places of equal salinity, just as an isotherm joins places of equal temperature.
| Kind of water | Salinity | Example |
|---|---|---|
| Rain | About 0.02‰ or less | Rainwater |
| Rivers and lakes | Below 0.01‰ to a few ‰ | Most fresh water |
| Brackish | 0.5 to 29‰ | Estuaries, the Baltic Sea |
| Marine (euhaline) | 30 to 35‰ | The open ocean |
| Metahaline | 36 to 40‰ | The Mediterranean Sea |
| Salt lakes | More than 200‰ | The Dead Sea |
How Ocean Salinity Is Measured: ppt, PSU and Absolute Salinity
Because salinity is hard to measure directly, oceanographers have used three methods of measuring salinity in turn. Each gives almost the same number for ordinary seawater, which is why textbooks can quote 35 for all of them.
- Chlorinity by titration (before the 1980s): Seawater was titrated with silver nitrate to find its chlorinity, the concentration of halide ions, mainly chlorine and bromine. Chlorinity multiplied by a factor gave the total salinity in parts per thousand.
- Practical Salinity Scale 1978 (PSS-78): Salinity was worked out from the electrical conductivity of seawater. Practical salinity has no units; the suffix PSU, practical salinity unit, is often added but is formally incorrect and strongly discouraged.
- TEOS-10 (2010): The Thermodynamic Equation of Seawater 2010 introduced absolute salinity, a mass fraction in grams per kilogram, found by combining conductivity with information on regional differences in seawater composition, or by measuring density directly.
One sample shows how close the three are. Seawater with a chlorinity of 19.37 ppt has a salinity of 35.00 ppt by the old method, a practical salinity of about 35.0 and an absolute salinity of about 35.2 g/kg.
Satellites now measure the salinity of the sea surface from space. The first salinity maps from space came from the European Space Agency's SMOS satellite, launched in November 2009. NASA's Aquarius sensor, carried on Argentina's SAC-D satellite from 10 June 2011, made NASA's first space-based measurements of ocean surface salinity. It measured salinity with radiometers that detect the ocean's microwave emissions, until a power failure ended the mission on 7 June 2015. Before satellites, salinity came only from ships and buoys, which could not cover the whole ocean consistently.
Composition of Sea Water: The Salts That Make the Sea Salty
Major Salts in Sea Water and Their Proportions
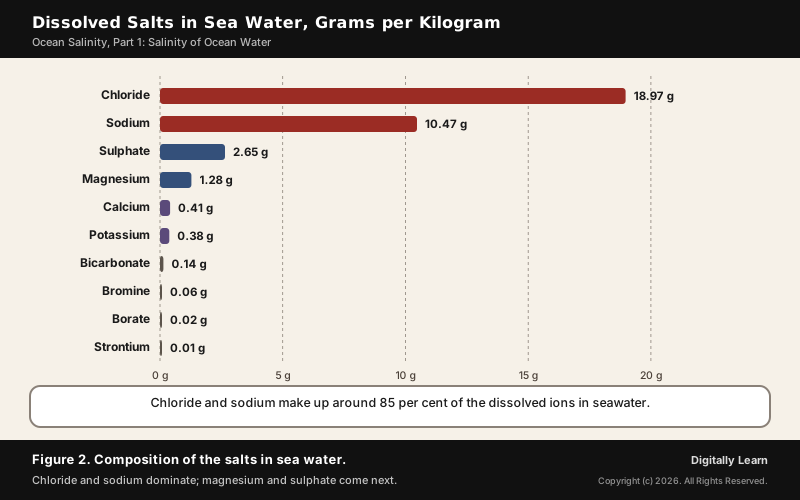
Seawater contains more dissolved ions than any kind of fresh water, but only a handful of them matter in quantity. A table of the dissolved salts, in grams per kilogram of seawater, is led by two ions that together make common salt:
- Chloride and sodium: 18.97 g and 10.47 g. Together they make up around 85 per cent of all the dissolved ions in the ocean.
- Sulphate and magnesium: 2.65 g and 1.28 g, together about another 10 per cent.
- Calcium and potassium: 0.41 g and 0.38 g.
- Trace constituents: Bicarbonate 0.14 g, bromine 0.06 g, borate 0.02 g and strontium 0.01 g.
The total amount of salt changes from sea to sea, but the proportions of the ions to one another stay nearly constant. William Dittmar of Glasgow University established the composition of seawater from the samples of the Challenger expedition of 1872 to 1876, the voyage that laid the foundation of oceanography. The constant proportions are what allowed chlorinity alone to stand for total salinity.
River water is not simply weak seawater. Bicarbonate makes up 48 per cent of the solutes in river water but only 0.14 per cent in seawater. The difference comes from how long each ion stays in the ocean: sodium and chloride have very long residence times, while calcium, which organisms use to build carbonate shells, drops out of the water much more quickly.
Previous Year UPSC-CSE Questions
Previous Year UPSC-CSE Questions By the end you will be able to draft model answers for the following UPSC questions. Each question carries a collapsible framework showing how to approach it in the exam.
- UPSC Mains 2017 GS-IAccount for variations in oceanic salinity and discuss its multi-dimensional effects.
How to structure the answer in the exam
Introduction: Define salinity (grams of salt per 1,000 g of seawater, average about 35 parts per thousand) and note that the open ocean ranges from 33 to 37.
Body (sub-themes to develop):
- Variations by factor: evaporation versus precipitation, river inflow, freezing and melting of ice, wind and currents, enclosed seas; examples Red Sea, Baltic, Bay of Bengal, North Sea.
- Spatial pattern: low at the equator and poles, highest in the subtropics; Atlantic maximum 37 between 20 and 30 N; vertical halocline.
- Physical effects: density, sinking water and thermohaline circulation, brine rejection, freezing point.
- Climate and life: heat exchange, salty regions getting saltier, euryhaline organisms, estuaries.
- Economic effects: sea salt, metal-rich brines, salinity-gradient energy.
Conclusion: Conclude that salinity, with temperature, sets the density that drives the deep ocean circulation, so its changing pattern matters for climate.
- UPSC Prelims 2024 Prelims-GSConsider the following statements:
- The Red Sea receives very little precipitation in any form.
- No water enters the Red Sea from rivers.
Which of the statements given above is/are correct?
How to approach this Prelims question
Approach: Link each statement to the Red Sea's high salinity: a dry climate and no river inflow.
Trap to watch: Statement 2 sounds absolute, but no significant river drains into the Red Sea.
Key facts to recall:
- Evaporation about 2,050 mm a year with scarce rainfall
- No significant rivers or streams drain into the Red Sea
Answer signal: Both statements are correct, option (c).
- UPSC Prelims 2012 Prelims-GSConsider the following factors :
- Rotation of the Earth
- Air pressure and wind
- Density of ocean water
- Revolution of the Earth
Which of the above factors influence the ocean currents?
How to approach this Prelims question
Approach: Keep the forces that act on moving water: rotation, wind and pressure, and density.
Trap to watch: The Earth's revolution causes the seasons, not ocean currents.
Key facts to recall:
- Saltier and colder water is denser and sinks
- Density differences move deep water
Answer signal: Rotation, air pressure and wind, and density: option (b).
Sources of Ocean Salinity: Where Sea Salt Comes From
Main Source of Salinity of the Sea: Weathering of Rocks on Land
The main source of the salinity of the sea is the weathering of rocks on land: rainwater dissolves minerals from rocks, and rivers carry the dissolved ions to the ocean. Rocks on land are the major source of the salts dissolved in seawater. The process runs in four steps:
- Rain breaks down rock: Rainwater is slightly acidic. The rain physically erodes the rock and the acids chemically break it down, carrying salts and minerals away dissolved as ions.
- Rivers carry the ions: Streams and rivers carry the dissolved ions to the ocean.
- Some ions are used: Many dissolved ions are taken up by organisms in the ocean and removed from the water.
- The rest build up: Ions that are not removed stay in the water, so their concentration rises over time.
The idea is old. In 1715 Edmond Halley proposed that rivers washed salt and other minerals out of the ground and into the sea, where the salts concentrated as more arrived over time. He noted that lakes with no outlet to the ocean, such as the Dead Sea and the Caspian Sea, are salty, and he called the process continental weathering. The Great Salt Lake shows the same thing today: with no outlet except evaporation, its minerals accumulate and make it far saltier than seawater.
Seafloor Vents, Volcanoes and the Salt Balance of the Ocean
The second source lies under the sea. Ocean water seeps into cracks in the seafloor and is heated by magma. The hot water loses oxygen, magnesium and sulphates, picks up metals such as iron, zinc and copper from the surrounding rock, and returns to the ocean through hydrothermal vents. Underwater volcanic eruptions release minerals directly, and salt domes, vast deposits of salt under land and seafloor, add to the ocean's saltiness.
The two main ions of sea salt have different origins. Halley's river theory is only partly correct: sodium was leached out of the ocean floor when the ocean formed, while chloride came from the outgassing of Earth's interior, as hydrochloric acid and other gases released through volcanoes and hydrothermal vents.
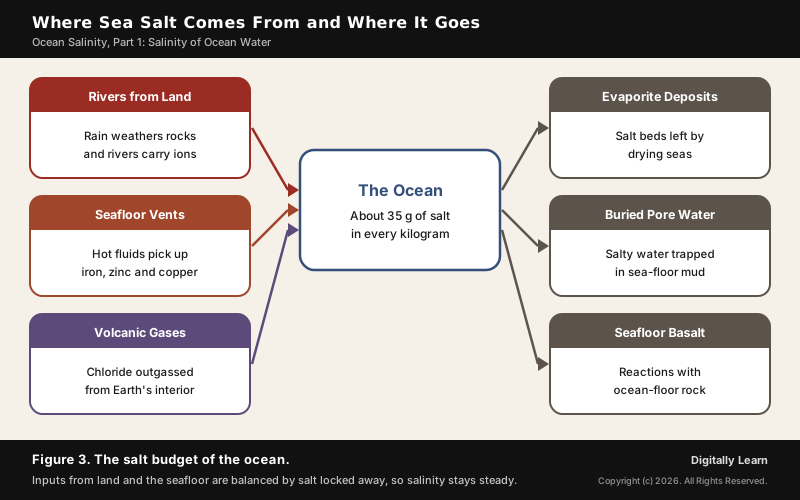
Salt keeps arriving, yet the sea is not getting saltier. Ocean salinity has been stable for billions of years, most likely because the ocean removes as much salt as it receives. The main sinks are evaporite deposits left where seas dry out, salty pore water buried in seafloor sediments, and chemical reactions with the basalt of the ocean floor, in which some dissolved salts react with the rock and are removed from seawater.
Factors Affecting Salinity of Ocean Water
Evaporation and Precipitation: The Main Control on Surface Salinity
Four factors affect ocean salinity, and the first is the most important: the salinity of the surface layer depends mainly on evaporation and precipitation. Evaporation removes water but leaves the salt, so it raises salinity; rain adds fresh water and lowers it.
- Where evaporation wins: Salinity is higher where evaporation exceeds precipitation, as it sometimes does in tropical regions. The Mediterranean Sea loses more water to evaporation than it gains from rain and has an average salinity of about 38‰.
- Where rain wins: Salinity is lower where precipitation exceeds evaporation, as in polar and some temperate regions. The equatorial belt receives over 200 cm of rain a year, which keeps its surface water fresher than the subtropics.
- Hot, dry extremes: In hot and dry regions where evaporation is high, salinity sometimes reaches 70‰. The Red Sea loses about 2,050 mm of water a year to evaporation.
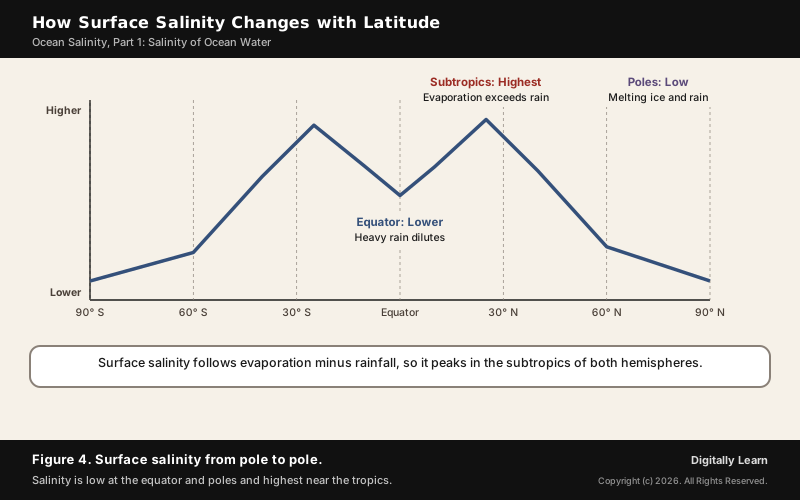
The result is a clear pattern with latitude. Salinity is generally low at the equator and at the poles and high at mid-latitudes, peaking in the subtropics, where evaporation exceeds rainfall.
River Inflow and the Freezing and Melting of Sea Ice
The second factor works mostly near coasts and at high latitudes. Surface salinity is greatly influenced in coastal regions by fresh water from rivers, and in polar regions by the freezing and thawing of ice.
- Baltic Sea: The world’s largest brackish sea. About two hundred rivers flow into it, and river runoff adds roughly one-fortieth of its volume each year, so its open surface water holds only 0.3 to 0.9 per cent salt.
- Black Sea: Enormous inflow of river water keeps its salinity low; its surface water leaves through the Bosporus with a salinity of about 17.
- Bay of Bengal: The Ganga’s inflow of river water gives it a lower salinity than the Arabian Sea.
Ice works in both directions. When seawater freezes, the salt does not fit into the crystal structure of the ice and is pushed out, a process called brine rejection. The water beneath the forming ice becomes saltier and denser, while the ice itself holds little salt: its salinity runs from 0 at the surface to about 4 at its base. When ice melts, it releases this fresh water and lowers the salinity of the surface. In estuaries and the Arctic, where river flow and ice both change through the year, salinity swings from 0 to 35‰ with the seasons.
Wind, Ocean Currents and the Shape of Enclosed Seas
The last two factors move salt from place to place. Wind transfers surface water to other areas, and ocean currents carry saltier or fresher water with them. The North Sea, in spite of its high latitude, records higher salinity because the North Atlantic Drift brings in more saline water. In the northern Pacific the opposite happens: salinity falls from 35‰ to 31‰ on the western side because of meltwater flowing in from the Arctic.
The shape of a sea decides how much of this mixing can happen. An enclosed sea in a hot, dry region keeps its salt. The Red Sea has no significant rivers draining into it and joins the Gulf of Aden, an arm of the Indian Ocean, only through a narrow southern opening, so it stays among the saltiest bodies of seawater in the world.
| Factor | Effect on salinity | Example |
|---|---|---|
| Evaporation | Raises it | Red Sea, Mediterranean Sea |
| Precipitation | Lowers it | Equatorial belt |
| River inflow | Lowers it | Baltic Sea, Bay of Bengal |
| Freezing of sea ice | Raises the water below | Polar seas in winter |
| Melting of ice | Lowers it | Western North Pacific |
| Ocean currents | Carry salt with them | North Sea, via the North Atlantic Drift |
| Enclosed shape | Keeps salt in a hot, dry sea | Red Sea |
Distribution of Ocean Salinity: Horizontal and Vertical
Horizontal Distribution of Salinity Across the Oceans
The horizontal distribution of salinity is its spread across the surface of the oceans. For the normal open ocean it ranges between 33‰ and 37‰, and each ocean has its own pattern:
- Atlantic Ocean: Average salinity is around 36‰. The highest salinity is recorded between 15° and 20° latitude, and the maximum of 37‰ lies between 20° N and 30° N and 20° W to 60° W. Salinity decreases gradually towards the north.
- Pacific Ocean: Its variation comes mainly from its shape and larger area. Salinity falls from 35‰ to 31‰ in the west of the northern hemisphere because of Arctic meltwater, and to 33‰ beyond 15° to 20° south.
- Indian Ocean: Salinity in the Indian Ocean averages 35‰. The Bay of Bengal is less saline because of the Ganga’s inflow, while the Arabian Sea is more saline because of high evaporation and little fresh water.
The climate trend adds to these differences. Observations of sea surface salinity between 1950 and 2019 show that regions of high salinity and evaporation have become more saline, while regions of low salinity and more rain have become fresher. It is very likely that the Pacific and Southern Oceans have freshened while the Atlantic has become more saline.
Salinity of Seas and Salt Lakes: Red Sea, Dead Sea, Baltic and Black Sea
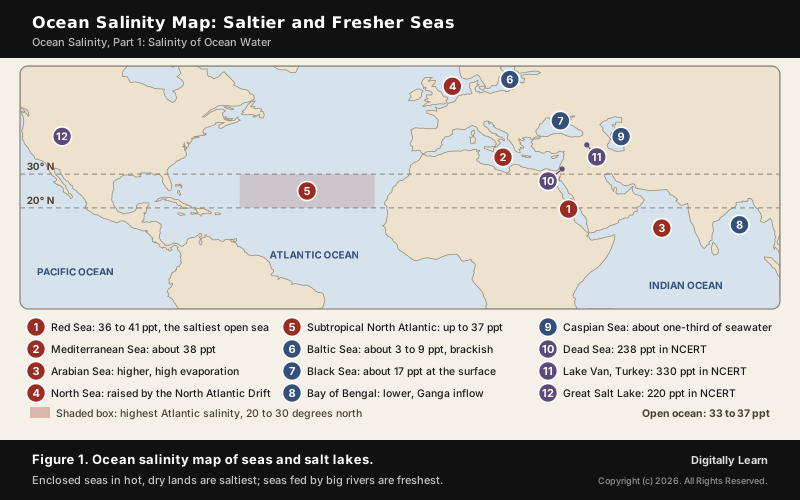
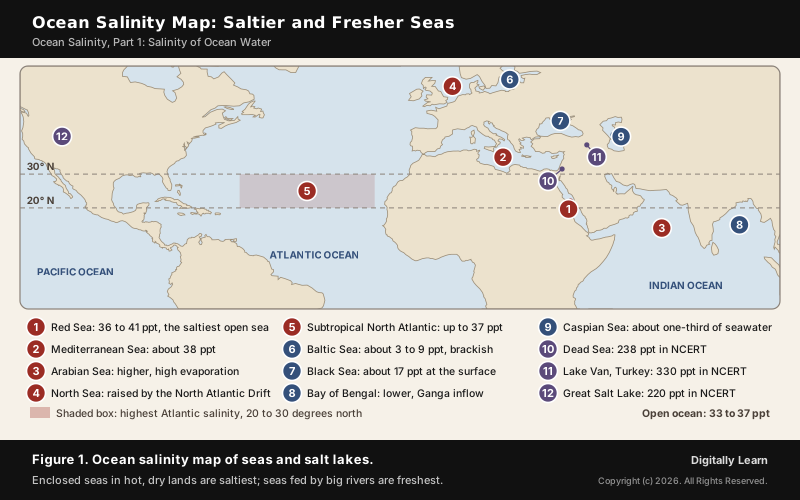
Enclosed seas and lakes show the extremes, because each is dominated by one factor. The Red Sea is the saltiest open sea: its salinity ranges from about 36‰ in the south to 41‰ in the north near the Gulf of Suez, with an average of 40‰; NCERT's figure of 41‰ is the northern maximum. Salt lakes with no outlet go much further, as the ocean salinity map in Figure 1 shows.
| Water body | Salinity and the main reason |
|---|---|
| Red Sea | 36 to 41‰, average 40‰: high evaporation, no rivers, a narrow link to the ocean |
| Mediterranean | About 38‰: evaporation exceeds rain, and it grows saltier towards the east |
| Black Sea | About 17 at the surface: enormous river inflow |
| Baltic Sea | 0.3 to 0.9 per cent: about 200 rivers and a shallow basin |
| Caspian Sea | About one-third of seawater: a lake of brackish water |
| Lake Van, Turkey | 330‰ (NCERT): a saline soda lake |
| Dead Sea | 238‰ (NCERT), 342 g/kg in 2011: no outlet, water leaves only by evaporation |
| Great Salt Lake | 220‰ (NCERT): no outlet besides evaporation |
The Dead Sea shows how salinity responds when fresh water is cut off. It has been shrinking since the 1960s, after water from the Jordan River was diverted, and by 2021 its surface had shrunk by about 33 per cent. At 342 g/kg in 2011 it was 9.6 times as salty as the ocean, with a density of 1.24 kg per litre, which is why people float in it.
Vertical Distribution of Salinity and the Halocline
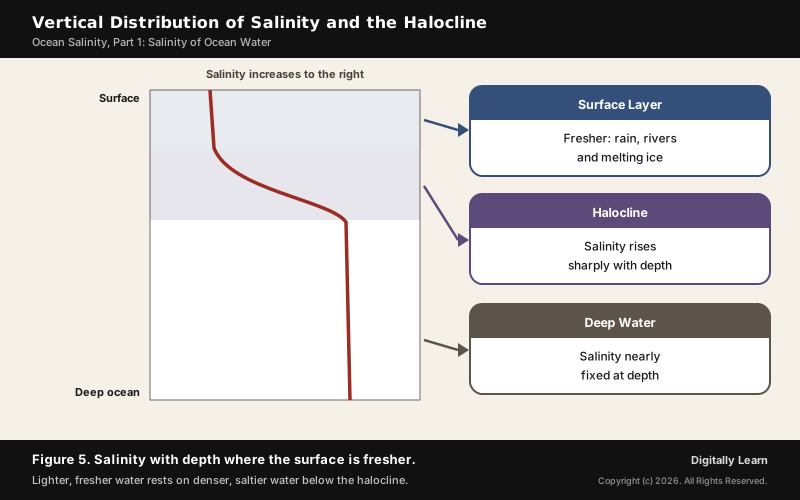
The vertical distribution of salinity describes how it changes with depth, and the key point is that the change depends on the location of the sea. At the surface, salinity rises when water is lost to ice or evaporation and falls when fresh water arrives from rivers or rain. At depth it is very much fixed, because there is no way for water to be lost or salt to be added.
Where the surface is freshened, lower-salinity water rests above higher-salinity, denser water. Salinity then generally increases with depth, and a distinct zone where it increases sharply is called the halocline. Because saltier water is denser, it sinks below fresher water, and the ocean becomes layered by salinity, a process called stratification.
- Mid-latitudes: Evaporation exceeds precipitation, so surface waters can be saltier than deep waters, the reverse of the usual pattern.
- Arctic Ocean: A distinct low-salinity surface layer limits deep mixing and keeps warm, saline Atlantic water away from the cold surface layer, which allows sea ice to grow.
- Baltic Sea: Salty inflowing water mixes only slowly with the fresh upper layer, so most of the salt water stays below 40 to 70 m.
- Black Sea: Below a sharp density boundary at about 100 to 200 m, the deep water’s salinity rises to 22.3, well above the surface.
Effects of Ocean Salinity: Density, Currents, Climate and Marine Life
How Salinity Drives Density, Ocean Currents and Sea Ice
The most important effect of salinity is on density. Water with high salinity is denser than water with low salinity, just as cold water is denser than warm water, and denser water tends to sink while lighter water rises. Surface seawater ranges in density from about 1,020 to 1,029 kg per cubic metre depending on its temperature and salinity. Differences in water density therefore affect the vertical movement of ocean currents. In short, salinity, together with temperature, determines how dense and buoyant seawater is.
- Salty water sinks: Atlantic water entering the Mediterranean warms and grows saltier as it flows east; by the Levantine Sea it is dense enough to sink and form the Levantine Intermediate Water.
- Rivers under the sea: Denser, more saline Mediterranean water flows into the Black Sea beneath the fresher water flowing out, forming a current along the seabed through the Bosporus, the first undersea river discovered.
- Sea ice and deep water: Salt rejected by forming sea ice creates saltier, denser brine that sinks and influences ocean circulation.
- Freezing point: Salt lowers the freezing point; seawater freezes at about −2 °C, and Lake Van, despite winters below 0 °C, rarely freezes because of its high salinity.
These density differences drive the deep, slow circulation of the whole ocean, the thermohaline circulation and stratification of the ocean, in which cold, salty water sinks at high latitudes and spreads through the ocean basins.
Salinity and Climate Change, Marine Organisms, Sea Salt and Energy
Salinity also reaches the climate and living world. With temperature and pressure it governs the density and heat capacity of seawater, which matter for ocean currents and for the exchange of heat between the ocean and the atmosphere. How salinity connects with the monsoon and El Niño is explained in ocean salinity, monsoons and ENSO.
- Climate change: Salty regions are getting saltier and fresh regions fresher, and projections for the 21st century expect the pattern to continue. The Mediterranean is expected to grow saltier and more layered by the end of the century as rainfall declines.
- Dissolved gases: The solubility of oxygen and other gases in seawater depends on its temperature and salinity.
- Marine life: An organism that tolerates a wide range of salinity is called euryhaline. Salmon and eels, which move between rivers and the sea, pause in estuaries to adjust to the change. In the Dead Sea, extreme salinity leaves an environment where plants and animals cannot flourish, which gave the lake its name.
- Salt and minerals: Sea salt is produced by evaporating seawater, almost entirely in the Mediterranean and other warm, dry climates. The hot, salty brines on the floor of the Red Sea, with their metal-rich muds, are being studied as a source of mineable metals.
- Energy: Differences in salinity, like waves, tides and temperature differences, carry energy that can be harnessed to generate electricity.
Sources
- NCERT: Fundamentals of Physical Geography (Class XI), Water (Oceans) and Movements of Ocean Water
- NOAA National Ocean Service: Why is the ocean salty?
- USGS Water Science School: Why is the ocean salty?
- NASA Science: Aquarius mission
- Wikipedia: Salinity
- Wikipedia: Seawater
- Wikipedia: Ocean
- Wikipedia: Halocline
- Wikipedia: Brine rejection
- Wikipedia: Sea ice
- Wikipedia: Brackish water
- Wikipedia: Challenger expedition
- Wikipedia: Hydrothermal vent
- Wikipedia: Aquarius (SAC-D instrument)
- Wikipedia: Red Sea
- Wikipedia: Mediterranean Sea
- Wikipedia: Black Sea
- Wikipedia: Baltic Sea
- Wikipedia: Dead Sea
- Wikipedia: Lake Van
- Wikipedia: Great Salt Lake
- Wikipedia: Sea salt
- UPSC: Civil Services Examination question papers
Editorial Disclaimer
This article draws on the NCERT Class XI geography textbook, NOAA, USGS, NASA and the other sources listed on this page. Salinity values for seas and lakes change with season, place and year, so check the latest figures before quoting them in an answer.