

Overview
The El Nino-Southern Oscillation (ENSO) is a year-to-year swing of the tropical Pacific, driven by the Walker circulation and the Bjerknes feedback, between a warm phase, El Nino (El Niño in Spanish), a cold phase, La Nina, and a neutral state. Its effects travel far beyond the Pacific through teleconnections, links by which a change in one part of the climate system alters weather thousands of kilometres away. ENSO also comes in more than one form. The classic event warms the eastern Pacific, while El Nino Modoki warms the central Pacific and leaves a different mark on the world. The size of any event's impact further depends on the Indian Ocean Dipole, the Madden-Julian Oscillation and other modes of variability, and on a climate that is warming underneath all of them.
El Nino Modoki and the Two Flavours of El Nino
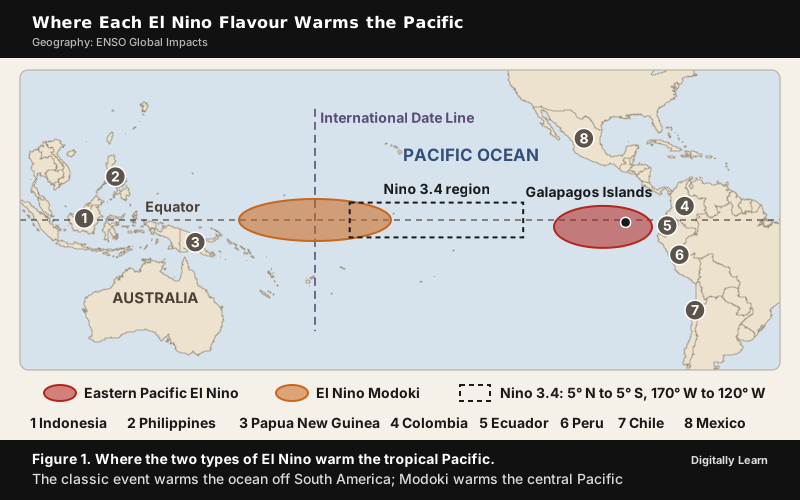
Eastern Pacific and Central Pacific El Nino Compared
The first ENSO pattern to be recognised is now called Eastern Pacific (EP) ENSO, because its temperature anomaly sits in the eastern Pacific, off South America. In the 1990s and 2000s scientists observed events in which the eastern Pacific warmed little while an anomaly arose in the central Pacific, near the International Date Line. This second type is called Central Pacific (CP) ENSO, "dateline" ENSO or ENSO Modoki, from a Japanese word meaning "similar, but different". The first recorded El Nino that began in the central Pacific and then moved east was in 1986.
The two flavours affect the world in different ways. El Nino years usually bring less active Atlantic hurricane seasons, while the Central Pacific type is linked with more frequent hurricane landfalls in the Atlantic. Central Pacific El Nino events occurred in 1986‑87, 1991‑92, 1994‑95, 2002‑03, 2004‑05 and 2009‑10.
| Feature | Eastern Pacific (classic) El Nino | Central Pacific El Nino (El Nino Modoki) |
|---|---|---|
| Where the warm anomaly lies | Eastern Pacific, off Peru and Ecuador | Central Pacific, near the Date Line |
| Other names | EP ENSO, classic El Nino | CP ENSO, Modoki |
| Atlantic hurricanes | Usually a less active season | More frequent hurricane landfalls |
La Nina Modoki, Coastal El Nino and the Debate over Flavours
The cold phase has a central Pacific variant as well. In La Nina Modoki the central Pacific cools while the eastern and western Pacific stay average or warm. It raises rainfall over north-western Australia and the northern Murray-Darling basin, whereas a conventional La Nina raises it over the east of the country. La Nina Modoki also increases the frequency of cyclonic storms over the Bay of Bengal, although it lowers the number of severe storms over the Indian Ocean as a whole. Years with La Nina Modoki events include 1998‑99, 2000‑01, 2008‑09, 2010‑11 and 2016‑17.
A third, narrower flavour hugs the South American coast. Peru calls it ENSO Costero (coastal ENSO). Its warm water lies mainly off Peru and Ecuador, and Peru declares one when the sea in the Nino 1+2 region, the far-eastern Pacific off Peru and Ecuador, stays at least 0.4 °C above normal for three months. Its warm phase brings heavy rain to the coast of Ecuador and northern Peru; its cold phase brings drought to the Peruvian coast.
Not all scientists accept that these flavours are separate types. Some treat ENSO as a continuum, with hybrid events between the two ends, and the comprehensive satellite record of the Pacific goes back only to 1979, so more research is needed before the flavours and their causes are settled.
ENSO Interactions with the Indian Ocean Dipole, MJO and Other Modes
Indian Ocean Dipole: Positive and Negative Phases with El Nino
The Indian Ocean Dipole (IOD) is an irregular oscillation in which the western Indian Ocean becomes alternately warmer (the positive phase) and colder (the negative phase) than the eastern part. Researchers at the Indian Institute of Science first identified it in 1999. In a positive phase the west is warm and wet, while the cooler east brings drought to Indonesia and Australia; a negative phase reverses the pattern. The IOD also affects the strength of the monsoon over the Indian subcontinent.
The two oceans interact in both directions. In 1997‑98 a significant positive IOD developed together with one of the most powerful El Ninos in recorded history, and in 2026 a positive IOD again grew alongside a strong El Nino. The reverse pairing is rare. The positive IOD of 2007 evolved together with a La Nina, which had happened only once before in the historical record, in 1967. Modelling work also suggests that winds driven by a positive IOD can produce El Nino-like warming in the far-eastern Pacific, and that the IOD‑ENSO interaction helps generate the most intense El Ninos.
The pairing matters most where both oceans reach. A positive IOD raises the October to December "short rains" of East Africa. During the strong positive IOD at the end of 2019, rainfall over East Africa ran 300 per cent above normal and flooded Djibouti, Ethiopia, Kenya, Uganda, Tanzania, Somalia and South Sudan. In Australia, a positive IOD on top of El Nino raises the risk of a severe bushfire season in the south-east, and a strong negative IOD with a strong La Nina caused the 2010‑11 Queensland floods.
Madden-Julian Oscillation and the Onset of El Nino
The Madden-Julian Oscillation (MJO) is the largest element of the 30- to 90-day (intraseasonal) variability of the tropical atmosphere, discovered in 1971 by Roland Madden and Paul Julian. Unlike ENSO, which is a standing pattern, the MJO travels. A large region of enhanced rainfall, followed by a region of suppressed rainfall, moves east over the Indian and Pacific Oceans at about 4 to 8 metres per second, and each cycle lasts about 30 to 60 days.
The MJO and ENSO act on each other. Strong MJO activity is often seen in the Pacific six to 12 months before an El Nino begins, and strong MJO events over the western Pacific across several months can speed the growth of an El Nino or La Nina, though they usually do not start one on their own. The surface westerly winds of an active MJO are also stronger while the Pacific moves towards El Nino. In the other direction, MJO activity is typically greater during La Nina and is virtually absent at the peak of some El Nino events.
The MJO also affects the Indian and West African summer monsoons and modulates tropical cyclone activity within a season. Its rising-air phase favours cyclone formation, and the favoured region shifts east from the western Pacific to the eastern Pacific and then to the Atlantic as the MJO advances.
Pacific Decadal Oscillation, Atlantic Nino and the Southern Annular Mode
ENSO is one of the three main modes of internal variability that climate science tracks; the other two are the Pacific and Atlantic decadal modes, known as the Pacific Decadal Oscillation and the Atlantic Multidecadal Oscillation. These and other slower or more distant modes can strengthen, weaken or alter what an ENSO event does to a region.
- Pacific Decadal Oscillation (PDO): A recurring pattern of warm or cool surface water in the Pacific north of 20° N, named by Steven R. Hare in 1997 while he studied salmon production. Its polarity reversed around 1925, 1947 and 1977. Part of the PDO is ENSO's own signal carried north, and the switch of the PDO to its warm phase in 2014, which loosely resembled a long El Nino, helped push global surface temperatures to a record that year.
- Atlantic Nino: The Atlantic Ocean's own equatorial warming and cooling, often called the little brother of El Nino. Its amplitude is about half that of El Nino, and it peaks in the northern summer, while El Nino peaks in winter. A warm Atlantic Nino holds the Intertropical Convergence Zone (ITCZ) south, cutting rainfall in the Sahel and raising it along the Gulf of Guinea.
- Atlantic Multidecadal Oscillation (AMO): A swing of North Atlantic sea temperature over several decades, with a quasi-period of about 70 years in the instrumental record. In climate models a warm AMO strengthens summer rainfall over India and the Sahel and North Atlantic tropical cyclone activity.
- Southern Annular Mode (SAM): A belt of strong westerly winds around Antarctica that moves towards the pole (positive phase) or towards the equator (negative phase). Its events last about 10 days to two weeks. A negative SAM is more frequent during El Nino and dries eastern Australia, while a positive SAM usually occurs more often with La Nina.
| Mode | Ocean | Time scale | Link with ENSO |
|---|---|---|---|
| Indian Ocean Dipole | Tropical Indian Ocean | Events of about six months | Positive IOD grew with El Nino in 1997‑98 and 2026; with La Nina only in 1967 and 2007 |
| Madden-Julian Oscillation | Indian and Pacific Oceans (atmosphere) | 30 to 60 days | Can speed the growth of El Nino or La Nina |
| Pacific Decadal Oscillation | North Pacific, north of 20° N | Several years to decades | Partly carries ENSO's signal north |
| Atlantic Nino | Equatorial Atlantic | Year to year, peaks in northern summer | No clear same-season link; can alter El Nino's effects |
| Atlantic Multidecadal Oscillation | North Atlantic | About 70 years | Warm phase strengthens Sahel rain and Atlantic cyclones, adding to or offsetting ENSO's effect there |
| Southern Annular Mode | Southern Ocean around Antarctica | Events of about 10 days to two weeks | Negative phase more frequent in El Nino years |
ENSO Teleconnections: How the Pacific Signal Travels
The Atmospheric Bridge and Seasonal Timing
ENSO reaches distant regions through an atmospheric bridge. During El Nino, deep convection over the unusually warm Pacific pumps heat into the troposphere, and this tropical forcing sets off Rossby waves, the planetary-scale waves of the upper atmosphere, which travel poleward and eastward before bending back towards the tropics. The resulting pattern of highs and lows becomes established within two to six weeks; in the northern winter of an El Nino the Aleutian Low over the North Pacific deepens. Over the North Pacific the pattern changes surface temperature, wind, humidity and cloud, and through them the heat exchange with the ocean below.
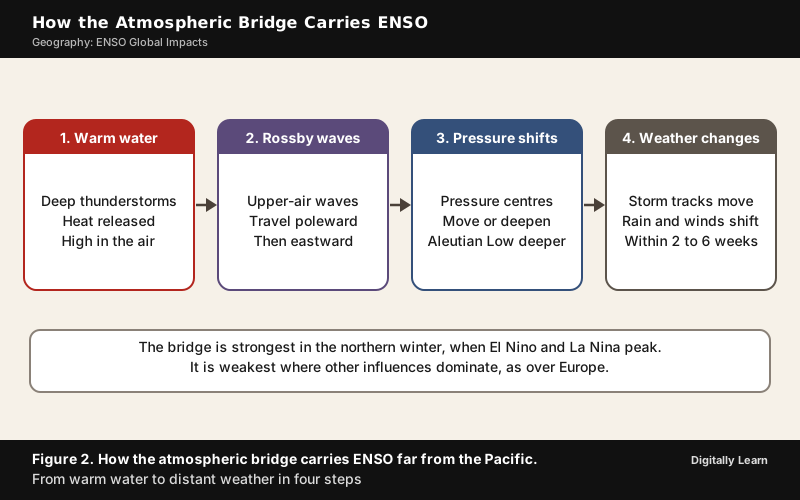
Timing matters as much as distance. Observations since 1950 show that ENSO's impacts depend on the time of year, and that even expected impacts are not certain to occur. Both El Nino and La Nina generally begin to develop between March and June and peak between November and February, so many teleconnections are strongest in the northern winter. The bridge is weakest where other influences dominate: El Nino's effect on Europe is complex and disputed, because several other factors can overwhelm the signal.
Global Impacts of El Nino and La Nina by Region
South America, the Peru Coast and the Peruvian Anchoveta
The effects of El Nino in South America are direct and strong. The coasts of northern Peru and Ecuador turn warm and very wet, with major flooding whenever the event is strong. The warm current can raise the sea temperature off Peru by 10 °C, and it reduces the upwelling of cold, nutrient-rich water that sustains the large fish populations of the Humboldt Current. Southern Brazil and northern Argentina are wetter than normal in spring and early summer, while parts of the Amazon basin, Colombia and Central America turn hotter and drier. La Nina brings drought to the coasts of Peru and Chile and a wetter northern Brazil from December to February.
The upwelling feeds the Peruvian anchoveta (Engraulis ringens), one of the most commercially important fish in the world, much of it processed into fishmeal and fish oil. Its catch peaked at 13.1 million tonnes in 1971. Overfishing and the 1972 El Nino then cut the stock sharply. Warm water drifted over the cold current, nutrient-rich water no longer rose, and the plankton the fish feed on declined. Another strong El Nino in the early 1980s brought a second collapse. Annual harvests between 2010 and 2021 still swung between 3.14 and 8.32 million tonnes, and by 2023 declining catches had fallen below those of Alaska pollock and skipjack tuna.
The Galapagos Islands show the same chain in a small space. When the trade winds weaken, warmer, nutrient-poor water surrounds the islands and the food web suffers from the bottom up, from plankton to sharks, penguins and seals.
Australia, Indonesia and Southeast Asia
Across most of Australia, El Nino and La Nina affect year-to-year climate more than any other factor. During El Nino, rainfall over Australia may be reduced, and the onset of the monsoon over tropical Australia is delayed by two to six weeks. La Nina brings above-average rain and damaging floods to the eastern seaboard, because stronger trade winds carry more moisture from the Pacific. Between 1900 and 2023 Australia recorded 28 El Nino and 19 La Nina events.
Indonesia and its neighbours lose rain in El Nino years, and the worst consequence came in 1997. Farmers and plantation operators in Kalimantan and Sumatra had long used fire to clear land, and the 1997‑98 El Nino made the dry season drier than normal, so the fires spread into peat swamps and burned out of control. The resulting haze, the most severe in the region's history, spread over Malaysia, Singapore, Brunei, Thailand and the Philippines, and its total cost was estimated at US$9 billion. The fires stopped only when the delayed monsoon rain arrived. La Nina can bring the opposite: In March 2008 it caused heavy rains over the Philippines, Indonesia and Malaysia.
Africa: East African Short Rains and Southern African Drought
Africa shows how one El Nino can bring floods and drought to neighbouring regions. El Nino is linked with heavier rain over East Africa, often a wetter, sometimes severe "short rains" season between October and December, and with weaker June to September rain over Sudan, South Sudan, parts of Ethiopia and western Kenya. During the 2023‑24 El Nino, floods in East Africa killed at least 479 people between September and mid-December 2023.
Southern Africa usually dries. In its summer-rainfall areas El Nino has caused severe drought in strong events, while the winter-rainfall areas tend to get more rain than normal. The 2023‑24 El Nino cut maize production by up to 70 per cent in parts of Zimbabwe, Zambia and Malawi, and drought affected more than 61 million people in southern Africa. La Nina reverses the pattern, with wetter southern Africa and drier equatorial East Africa from December to February.
North America, East Asia, the Pacific Islands and Antarctica
El Nino's main effects on North America fall between October and March. Most of Canada has a milder winter, and the southern United States, from Texas to Florida along the Gulf Coast, is wetter, because the polar jet stream runs stronger and farther south; the Ohio Valley, the Pacific Northwest and Hawaii tend to be drier. La Nina brings mostly the opposite, including a wetter Pacific Northwest.
Elsewhere around the Pacific the signals are just as clear. During La Nina, tropical cyclones form farther west and threaten China more often. Fiji and Samoa usually turn dry during El Nino, while New Zealand's east coast faces more westerly winds and a higher risk of drier summers. Near Antarctica, El Nino raises pressure over the Amundsen and Bellingshausen Seas and reduces their sea ice, while the Weddell Sea turns colder with more ice.
| Region | El Nino years | La Nina years |
|---|---|---|
| Coast of Peru and Ecuador | Warm sea, heavy rain and flooding; upwelling fails | Drought on the Peruvian and Chilean coast |
| Indonesia | Below-average rain, drought, fire risk | Heavy rain, as in March 2008 |
| Eastern Australia | Reduced rain, drought, higher bushfire risk | Above-average rain, damaging floods |
| East Africa | Wetter October to December short rains, flooding | Drier from December to February |
| Southern Africa (summer-rainfall areas) | Drought | Wetter (December to February) |
| Pacific Northwest of the United States | Drier winter | Wetter winter |
| Atlantic hurricane belt | Fewer hurricanes | More hurricanes |
ENSO, Tropical Cyclones and Hurricane Seasons
Atlantic Hurricanes and Pacific Typhoons under El Nino and La Nina
ENSO moves tropical cyclones between ocean basins. During El Nino, stronger upper-level westerly winds over the Atlantic raise the vertical wind shear, the change of wind with height that inhibits the formation and strengthening of storms, and the air there is often drier and more stable; El Nino years therefore usually have less active Atlantic hurricane seasons.
The same events favour cyclone activity in the Pacific. In the western Pacific, El Nino shifts the area where cyclones form eastward without greatly changing their number, so Micronesia is hit more often and China less. In the South Pacific, cyclones move away from the Australian region, so they are about 50 per cent less likely to cross the Queensland coast, while Tonga, Tuvalu, Niue and the Cook Islands face a higher risk.
La Nina works the other way and favours the Atlantic. The 2020 Atlantic season, in a La Nina year, was the most active on record. Strong El Ninos show the Pacific side of the swap. The 1997‑98 event brought 16 tropical cyclones to the South Pacific against an average of about eight, and the 2014‑16 event gave the Central Pacific basin its most active season on record, with 16 tropical cyclones in 2015.
The rule is a tendency, not a law. The Atlantic was so warm in 2023 that the 2023‑24 El Nino did not suppress its hurricanes much, and the 2023 season tied with 1933 as the fourth most active on record, the highest number of storms for any El Nino year. ENSO reaches the southern Indian Ocean too. For the 2026‑27 South-West Indian Ocean season, the WMO's regional centre at La Reunion gave a 70 per cent chance of below-normal activity, with six to 10 named storms against an average of 10, because the strong El Nino makes the winds less favourable for cyclones.
ENSO and Global Temperature Records
El Nino Spikes in Global Temperature: 1998, 2016 and 2024
El Nino adds a short-lived surge of heat to a planet that is already warming. El Nino events cause spikes of about one year in the global average surface temperature, and La Nina events cause brief cooling, so the balance between the two can tilt global temperature trends over a decade. The extra heat shows most clearly in the year after an El Nino develops.
The record years follow this pattern. The very strong El Nino year of 1998 became the warmest year recorded until then. The record set in 2016, during the 2014‑16 El Nino, held until the 2023‑24 El Nino. The year 2023 was by far the warmest recorded to that point. The WMO then put 2024 at 1.55 °C above the 1850‑1900 average (with a margin of uncertainty of ±0.13 °C), the warmest year on record and probably the first calendar year more than 1.5 °C above that baseline. The WMO attributes 2024's record to the combination of the powerful 2023‑24 El Nino and human-induced climate change from greenhouse gases.
Every record now sits on a rising base. From January to September 2026 the global average temperature was about 1.47 °C above the pre-industrial average, the past 12 years have been the warmest on record, and October 2026 was the warmest October on record for global sea surface temperature. For that reason the WMO Secretary-General warned that the world should prepare for another likely record-breaking year in 2027.
Ecological and Human Impacts: Coral Bleaching, Food and Disease
Coral Bleaching and the Four Global Bleaching Events
Reef-building corals live in partnership with zooxanthellae, single-celled algae inside their tissues that give the coral its colour and supply it with food through photosynthesis. Coral bleaching is the loss of these algae and their pigments, which turns the coral white. Several stresses can cause it, but the leading cause is ocean heat. When the water stays too warm for too long, the algae leave and the coral begins to starve. A bleached coral is still alive, but it is weak, open to disease and at risk of death. Ocean acidification, caused by the sea taking up carbon dioxide from the air, adds a second stress to coral health.
ENSO turns the slow rise in ocean temperature into sudden marine heatwaves. Since 1998, global coral bleaching events have coincided with every strong El Nino, and the heat stress has grown more widespread and severe with each one. The first global event came in 1998, during the 1997‑98 El Nino, when 21 per cent of reefs experienced bleaching-level heat stress; the Indian Ocean was hit hardest, with up to 90 per cent of coral cover lost in the Maldives, Sri Lanka, Kenya, Tanzania and Seychelles. The second followed in 2010.
The third ran for three years, from 2014 to 2017, alongside the 2014‑16 El Nino, and exposed 68.2 per cent of the world's reef area to bleaching-level heat; on the Great Barrier Reef, bleaching in 2016 killed 29 to 50 per cent of the coral.
The fourth global event, confirmed by the US National Oceanic and Atmospheric Administration (NOAA) on 15 April 2024, was the largest. From 1 January 2023 to 30 September 2025, bleaching-level heat stress reached about 84.4 per cent of the world's coral reef area, in all three reef-bearing oceans, and mass bleaching was recorded in at least 83 countries and territories. The event probably ended in mid-2025, but the ocean heat of the 2026 El Nino raised the risk of a return to widespread bleaching.

Food Prices, Economies and Disease Outbreaks
ENSO travels through markets as well as through the air. Because it shifts rain over several farming regions at once, El Nino can cut the supply of rain-fed crops, lower farm output, raise food prices and even trigger unrest in poor countries that depend on imported food. The 2014‑16 El Nino caused food shortages affecting over 60 million people.
The economic effects of El Nino differ by country. Within a year, an El Nino shock is associated with a change in the growth of real gross domestic product (GDP) of −1.01 per cent in Indonesia and −0.72 per cent in South Africa, but of +0.5 per cent in the United States, +1.57 per cent in Mexico and +1.81 per cent in Thailand. The fishing economies of the eastern Pacific are hit through the failure of the upwelling that feeds the anchoveta.
Disease follows the rain. El Nino cycles raise the risk of some mosquito-borne diseases, such as malaria, dengue and Rift Valley fever; after the extreme rain of the 1997‑98 El Nino, Rift Valley fever broke out severely in north-eastern Kenya and southern Somalia, and cycles of malaria in India, Venezuela, Brazil and Colombia have been linked to El Nino. La Nina carries its own risk, since outbreaks of Murray Valley encephalitis in south-eastern Australia follow the heavy rain and floods of La Nina years.
Recent ENSO Events: Triple-Dip La Nina to the 2026 El Nino
Triple-Dip La Nina of 2020‑23
A triple-dip La Nina is a La Nina that continues for three consecutive years, whereas a typical El Nino or La Nina event lasts nine to 12 months. The 2020‑23 event was the first of the 21st century, and of the 13 La Nina events between 1951 and 2023, only three lasted for three years. Its cold anomaly was modest in size, reaching a lowest value of −1.3 °C in October to December 2020 on NOAA's Oceanic Nino Index (ONI), a three-month average of the Nino 3.4 temperature anomaly, but its length raised the risk of extreme weather across the world.
The event left a trail of extremes. The North Atlantic had its most active hurricane season on record in 2020 and its third most active in 2021. Australia, especially New South Wales, had one of its wettest Marches on record in 2021. The Horn of Africa suffered its worst drought in four decades, leaving nearly 32 million people short of food, while floods across Nigeria killed at least 600 people.
The 2023‑24 El Nino and the 2026 El Nino
The Pacific swung from the long La Nina into a strong El Nino in 2023. NOAA confirmed El Nino conditions on 8 June 2023, and the WMO declared the onset on 4 July 2023; the event was in full retreat by March 2024 and dissipated during April 2024, after which the Pacific returned to neutral conditions. La Nina developed again in late 2025 and lasted until early 2026. Rapidly rising sea temperatures in the equatorial Pacific in May 2026 then signalled the return of El Nino.
The 2026 event strengthened rapidly. The Nino 3.4 index averaged +1.5 °C above normal over May to July 2026 and reached +2.0 °C in July, and on 3 September 2026 the WMO gave a likelihood of nearly 100 per cent that El Nino would last through February 2027, the first time one of its updates had been so unequivocal.
By early October 2026 the Nino 3.4 anomaly had reached +2.1 °C, the anomaly in the Nino 3 region of the eastern Pacific +3.0 °C and in Nino 1+2 +3.9 °C, with surface anomalies above +4.0 °C in parts of the eastern Pacific. On 8 October 2026 NOAA's Climate Prediction Center gave an 83 per cent chance that October to December 2026 would exceed +2.5 °C on the relative index that NOAA adopted in February 2026, beyond any El Nino since 1950. A positive IOD developed alongside it.
ENSO and Climate Change: IPCC AR6 Findings
What the IPCC Sixth Assessment Report Concludes
The Working Group I report of the IPCC's Sixth Assessment Report (AR6), published in 2021, gives a two-part answer: It finds no model consensus on how warming will change the size of ENSO's sea-temperature swings, but it expects ENSO's rainfall effects to grow. Its projections are tied to emission scenarios called Shared Socioeconomic Pathways (SSPs); SSP2-4.5, SSP3-7.0 and SSP5-8.5 are the intermediate and high emission scenarios it uses for ENSO rainfall.
| Subject | Finding (confidence or likelihood in AR6) |
|---|---|
| ENSO's place | Remains the dominant mode of year-to-year variability in a warmer world (virtually certain) |
| Human influence | Has not affected the principal tropical modes and their teleconnections beyond internal variability (high confidence) |
| Sea temperature | No model consensus on a systematic change in ENSO's amplitude over the 21st century (medium confidence) |
| Rainfall | ENSO rainfall variability enhanced significantly by the latter half of the century under SSP2-4.5, SSP3-7.0 and SSP5-8.5 (very likely) |
| Teleconnections | Changes in their strength and reach cause significant regional rainfall changes (very likely) |
| Since 1950 | ENSO amplitude and the frequency of strong events higher than in any earlier period since 1850, and possibly since 1400 (medium confidence) |
| Decadal modes | Pacific and Atlantic modes show no significant change in variance in the observed record (high confidence) |
For the regions that ENSO already wets or dries, the growth in ENSO rainfall variability means wider swings between flood years and drought years, whatever happens to the size of ENSO's sea-temperature swings.
Open Questions: Extreme El Nino, Modoki and Measuring ENSO in a Warmer Ocean
Whether warming is making El Nino stronger or more frequent is still debated. Several studies published since about 2019 find that climate change is making extreme El Nino events more frequent, and a large set of model experiments shows an increase of about 10 per cent in eastern Pacific ENSO amplitude between the periods 1901 to 1960 and 1961 to 2020.
The WMO, however, states that there is no evidence that climate change increases the frequency or intensity of El Nino events, while noting that a warmer ocean and atmosphere supply more energy and moisture for the heatwaves and heavy rain that El Nino brings. Some scientists also suggest that the Central Pacific type, recognised only recently, may be linked to global warming, but more research is needed.
Warming has already changed how ENSO is measured. The Oceanic Nino Index measures the Nino 3.4 region against a 30-year base period, so it cannot tell an ENSO warming from the general warming of the tropical oceans. In February 2026, after unusual increases in tropical sea temperatures, NOAA moved to the Relative Oceanic Nino Index (RONI), which compares the Nino 3.4 region with the global tropics and so shows whether a warming event is driven by ENSO or mostly by global ocean warming.
ENSO Forecasting: NOAA, WMO, the Bureau of Meteorology and IMD
How ENSO Is Declared and Forecast
National agencies watch the same ocean but declare events by their own rules. In the United States, NOAA's Climate Prediction Center monitors the Nino 3.4 region, a box from 120° W to 170° W and five degrees of latitude either side of the equator, and states the status of its ENSO Alert System (an El Nino Advisory in October 2026) in a diagnostic discussion that combines models from North America and abroad. Australia's Bureau of Meteorology also weighs the trade winds and the Southern Oscillation Index before declaring an event, and the Japan Meteorological Agency uses the Nino 3 region and a six-month test.
The WMO brings these views together. Its El Nino/La Nina Update, issued about every three months with the International Research Institute for Climate and Society (IRI), draws on forecasts from centres around the world, and a monthly Global Seasonal Climate Update adds the other drivers, such as the IOD. Regional Climate Outlook Forums turn these into regional outlooks for governments. Modern seasonal models can predict such patterns one to six months ahead, which lets governments plan for agriculture and health, activate emergency measures and pre-position humanitarian supplies before floods or drought arrive.
India builds these outlooks into its own forecasts. The state of ENSO is one of the inputs to India's long-range forecast of monsoon rainfall, and the India Meteorological Department (IMD) assesses ENSO alongside the IOD in its operational forecasting. In September 2024 the Union Cabinet approved Mission Mausam, with an outlay of ₹2,000 crore over two years, to improve India's weather and climate observation, modelling and forecasting; it is implemented mainly by the IMD, the Indian Institute of Tropical Meteorology and the National Centre for Medium-Range Weather Forecasting, with the Indian National Centre for Ocean Information Services among the supporting institutions.
Previous Year UPSC‑CSE Questions
Each Prelims question is explained option by option, and each Mains question comes with an answer outline.
- UPSC Prelims 2010A new type of El Nino called El Nino Modoki appeared in the news. In this context, consider the following statements:
- Normal El Nino forms in the Central Pacific ocean whereas El Nino Modoki forms in Eastern Pacific ocean.
- Normal El Nino results in diminished hurricanes in the Atlantic ocean but El Nino Modoki results in a greater number of hurricanes with greater frequency.
Which of the statements given above is/are correct?
How to approach this Prelims question
Approach: Test each statement for where the warming lies and what it does to Atlantic hurricanes.
- Statement 1 swaps the two locations: The normal El Nino warms the eastern Pacific, off Peru and Ecuador, and El Nino Modoki warms the central Pacific, near the Date Line, so statement 1 is wrong.
- Statement 2 matches what is known: El Nino years usually bring less active Atlantic hurricane seasons, while El Nino Modoki is linked with more frequent hurricane landfalls in the Atlantic, so statement 2 is correct.
Trap to watch: Because El Nino was first noticed off Peru, a new type is easily assumed to belong there too, but Modoki is the central Pacific event.
Why each option is right or wrong:
- (a) 1 only: Wrong. Statement 1 reverses the locations, since the normal El Nino warms the eastern Pacific and El Nino Modoki the central Pacific.
- (b) 2 only: Correct. Normal El Nino years bring fewer Atlantic hurricanes, while El Nino Modoki brings more frequent landfalls.
- (c) Both 1 and 2: Wrong. Statement 1 is false, so both cannot be correct.
- (d) Neither 1 nor 2: Wrong. Statement 2 is correct.
Answer: (b) 2 only. The normal El Nino warms the eastern Pacific and El Nino Modoki the central Pacific, and only Modoki is linked with more Atlantic hurricane landfalls.
- UPSC Mains 2019 GS‑IAssess the impact of global warming on the coral life system with examples.
Answer outline
The outline sets out what the question asks, the main arguments, relevant examples and the direction of the conclusion; it is not a full model answer.
Introduction: Reef-building corals depend on zooxanthellae, algae in their tissues; when the sea stays too warm for too long the algae leave, the coral bleaches and begins to starve.
Body (sub-themes to develop):
- Mechanism: Marine heatwaves are the leading cause of bleaching, and ocean acidification from the uptake of carbon dioxide adds a second stress; bleached corals are weak, open to disease and at risk of death.
- Role of El Nino: Since 1998 global bleaching events have coincided with every strong El Nino, and each has been more widespread.
- Global examples: 21 per cent of reefs under bleaching-level heat in 1998, 68.2 per cent of reef area in 2014 to 2017, and about 84.4 per cent from 2023 to 2025 in at least 83 countries and territories.
- Regional examples: Up to 90 per cent of coral cover lost in parts of the Indian Ocean in 1998, including the Maldives and Sri Lanka; 29 to 50 per cent of the Great Barrier Reef's coral killed in 2016.
- Human impact and outlook: Reefs feed and protect coastal communities and support tourism; on the Great Barrier Reef bleaching is projected three times a decade at 1.5 °C and every other year at 2 °C.
Conclusion: Global warming has turned coral bleaching from a rare event into a frequent one, so the survival of reefs depends on holding warming close to 1.5 °C.
Sources
- NCERT: Fundamentals of Physical Geography, Class 11, Chapter 9, Atmospheric Circulation and Weather Systems
- NCERT: India Physical Environment, Class 11, Chapter 4, Climate
- IPCC: AR6 Working Group I, Summary for Policymakers
- IPCC: AR6 Working Group I, Technical Summary
- WMO: El Nino/La Nina Phenomena
- WMO: El Nino set to become very strong, raising risks of extreme weather into 2027
- WMO: El Nino favours quieter South-West Indian Ocean cyclone season
- WMO: 2024 confirmed as warmest year on record at about 1.55 °C above pre-industrial level
- WMO: State of the Climate Update 2026, Secretary-General's statement at COP31
- NOAA Climate Prediction Center: ENSO Diagnostic Discussion
- NOAA NESDIS: World's fourth mass coral bleaching event likely ended in 2025
- NOAA Coral Reef Watch: Current global bleaching status update
- Bureau of Meteorology (Australia): Climate Driver Update
- PIB: Cabinet approves Mission Mausam with an outlay of ₹2,000 crore over two years
- Wikipedia: El Niño-Southern Oscillation
- Wikipedia: Indian Ocean Dipole
- Wikipedia: Madden-Julian oscillation
- Wikipedia: Pacific decadal oscillation
- Wikipedia: Atlantic Niño
- Wikipedia: Atlantic multidecadal oscillation
- Wikipedia: Antarctic oscillation
- Wikipedia: Peruvian anchoveta
- Wikipedia: 1997 Southeast Asian haze
- Wikipedia: 1997‑1998 El Niño event
- Wikipedia: 2014‑2016 El Niño event
- Wikipedia: 2020‑2023 La Niña event
- Wikipedia: 2023‑2024 El Niño event
- Wikipedia: Coral bleaching
- UPSC: Civil Services Examination question papers
Editorial Disclaimer
Facts are drawn from the current NCERT textbooks and from the IPCC, WMO, NOAA, the Bureau of Meteorology and the other sources cited.
See more of our UPSC articles in Google Search
Add to Preferred Sources