Exploring the Atlantic Ocean: Bottom Relief and Geography


Exploring the Bottom-Relief Features of the Atlantic Ocean

Exploring the Bottom-Relief Features of the Atlantic Ocean

Introduction

As a teacher, I am excited to explore the bottom-relief features of the Atlantic Ocean with my students. The Atlantic Ocean is full of fascinating geography and morphology, including the Mid-Atlantic Ridge, ocean deeps, marginal seas, ocean basins, abyssal plains, seamounts, trenches, and rift valleys. Let’s dive deeper into these features and uncover the significance of understanding the bottom relief of the Atlantic Ocean.

Bottom Relief Features of the Atlantic Ocean

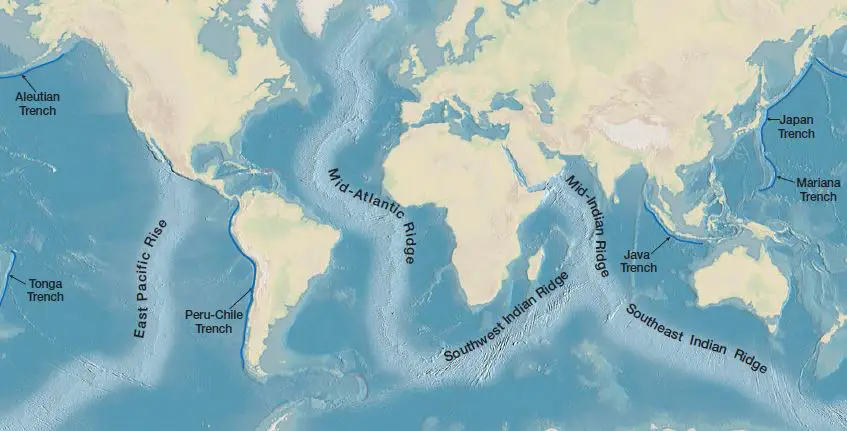
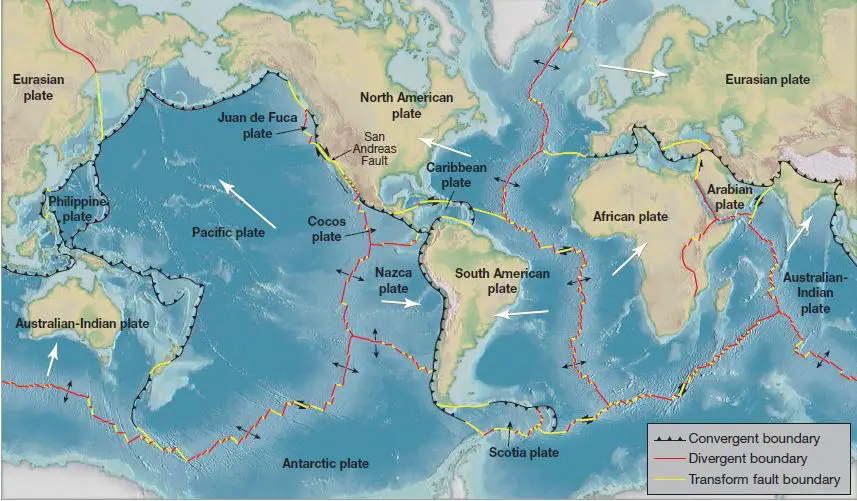
  • Mid-Atlantic Ridge: A massive underwater mountain range running down the center of the Atlantic Ocean, marking a divergent plate boundary.
  • Ocean Deeps: Various deep ocean trenches exist, such as Nares Deep, Puerto Rico Deep, and Tizard Deep.
  • Marginal Seas: Significant marginal seas include the Mediterranean Sea, Caribbean Sea, and Gulf of Mexico.
  • Ocean Basins: The Atlantic Ocean is divided into East and West Atlantic Basins by the Mid-Atlantic Ridge.
  • Abyssal Plains: Flat, sediment-covered regions of the deep ocean floor lying at depths of 3,000 to 6,000 meters.
  • Seamounts: Mountains or volcanoes rising from the seafloor but not reaching the ocean surface.
  • Trenches: Deep, narrow depressions in the seafloor, such as the Puerto Rico Trench and Romanche Trench.
  • Rift Valleys: Geological features associated with tectonic plate movements.

Significance of the Mid-Atlantic Ridge

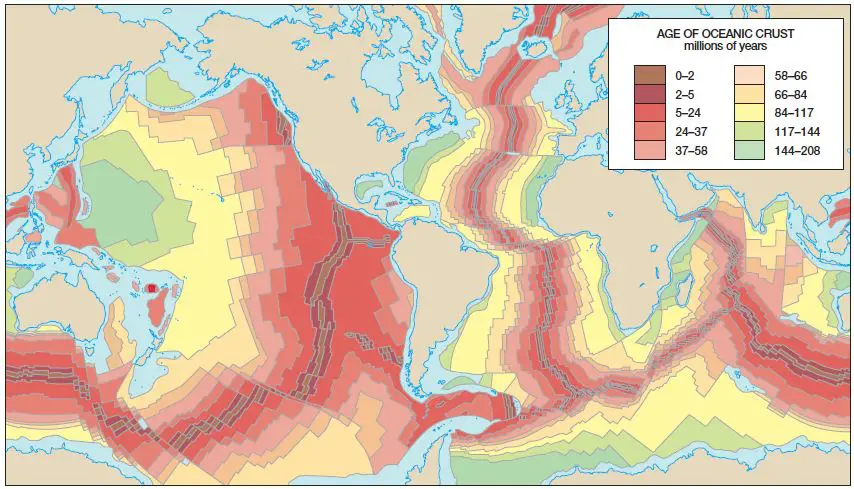
The Mid-Atlantic Ridge plays a crucial role in recording the direction of the Earth’s magnetic field through seafloor spreading. The ridge is important for studying the Earth’s geological history, marine life, and ocean circulation patterns. It also influences the distribution of ocean depths, seamounts, and trenches in the Atlantic Ocean.

Impact on the Earth’s Magnetic Field

The Mid-Atlantic Ridge affects the Earth’s magnetic field by forming basaltic lava that becomes magnetized in the direction of the field at the time of eruption. This lava records magnetic polarity stripes, providing insights into the Earth’s magnetic field reversals over time.

Geography of the Atlantic Ocean

The Atlantic Ocean is the second-largest ocean in the world, covering approximately 20% of the Earth’s surface. It separates Europe and Africa from the Americas and is home to various features such as the Mid-Atlantic Ridge and Puerto Rico Trench. The ocean’s irregular coasts are indented by numerous bays, gulfs, and seas, making it a diverse and vibrant ecosystem.

Fun Fact

The Atlantic Ocean is known for its hurricanes, which mostly form between June and November each year. These powerful storms play a significant role in shaping the ocean’s weather patterns and marine life.

Conclusion

Exploring the bottom-relief features of the Atlantic Ocean is not only educational but also exciting. Understanding the geography and morphology of the ocean helps us appreciate the Earth’s natural beauty and complexity. As we continue to study the Atlantic Ocean’s bottom relief, we uncover the mysteries of our planet’s history and evolution.


Mutiple Choice Questions

1. What is the Mid-Atlantic Ridge?
a) A deep ocean trench in the Atlantic Ocean
b) A mountain range separating the North American plate from the Eurasian plate
c) A volcanic island in the middle of the Atlantic Ocean
d) A large seamount in the Atlantic Ocean

Answer: b) A mountain range separating the North American plate from the Eurasian plate

Explanation: The Mid-Atlantic Ridge is a submarine mountain range that runs along the floor of the Atlantic Ocean, separating the North American plate from the Eurasian plate.

2. Which of the following is NOT a bottom relief feature of the Atlantic Ocean?
a) Ocean Deeps
b) Marginal Seas
c) Abyssal Plains
d) Coral Reefs

Answer: d) Coral Reefs

Explanation: Coral reefs are not a bottom relief feature of the Atlantic Ocean. The other options listed are actual bottom relief features of the Atlantic Ocean.

3. How do basaltic lava formations at the Mid-Atlantic Ridge help in recording the Earth’s magnetic field?
a) By trapping magnetic minerals within the lava
b) By releasing magnetic energy into the water
c) By reflecting sound waves back to the source
d) By creating earthquakes along the ocean floor

Answer: a) By trapping magnetic minerals within the lava

Explanation: Basaltic lava formations at the Mid-Atlantic Ridge become magnetized in the direction of the Earth’s magnetic field at the time of eruption, which helps in recording the Earth’s magnetic field reversals over time.

4. How does the Mid-Atlantic Ridge influence the distribution of ocean depths in the Atlantic Ocean?
a) By causing earthquakes along the seafloor
b) By creating a central rift valley that separates the ocean into two major basins
c) By forming large seamounts along the ridge
d) By causing volcanic eruptions on neighboring islands

Answer: b) By creating a central rift valley that separates the ocean into two major basins

Explanation: The Mid-Atlantic Ridge influences the distribution of ocean depths by creating a central rift valley that separates the Atlantic Ocean into two major basins, the East and West Atlantic Basins.

5. What is the significance of the Mid-Atlantic Ridge in studying the Earth’s magnetic field changes?
a) It helps in predicting volcanic eruptions
b) It provides a record of the Earth’s magnetic field reversals over time
c) It helps in mapping the distribution of coral reefs
d) It influences the formation of ocean trenches

Answer: b) It provides a record of the Earth’s magnetic field reversals over time

Explanation: The Mid-Atlantic Ridge provides a valuable record of the Earth’s magnetic field reversals over time, which allows scientists to study and understand changes in the Earth’s magnetic field.

Brief Summary | UPSC – IAS

The article explains the bottom-relief features of the Atlantic Ocean, including the Mid-Atlantic Ridge, ocean trenches, marginal seas, ocean basins, abyssal plains, seamounts, trenches, and rift valleys. These features play a key role in understanding the ocean’s geological history, marine life, and circulation patterns. The Mid-Atlantic Ridge is significant in recording the Earth’s magnetic field reversals over time. The Atlantic Ocean is the second-largest in the world, divided into North and South Atlantic basins by the Equator. It is known for its irregular coasts, diverse marine life, and significant features such as the Mid-Atlantic Ridge and the Puerto Rico Trench.

Significant Contributions of Roman Geographers to Geography

As a teacher, it is essential to provide a comprehensive understanding of Roman geographers’ contributions to the field of geography during the Roman Empire. Despite the prevalent perception that the Romans did not make significant contributions to geography, the work of several prominent individuals, including Marcus Terentius Varro, Strabo, and Ptolemy, marks an important milestone in the development of geographical thought and practice.

One of the key features of Roman geographers’ work was their focus on historical and regional geography, mapping, surveying, and the description of natural features and human settlements. Let’s discuss each of these contributions in detail.

Significance of Roman Geographers’ Work:

The contributions of Roman geographers had a significant impact on the development of geographical knowledge and understanding during the ancient era. Strabo, for example, provided an encyclopedic assessment of the known world in his 17-volume work, “Geographia,” encompassing cultural diversity, government forms, and local traditions. His emphasis on political geography and advocacy for a strong central government in political units contributed to the understanding of state structures and governance systems during that era.

Features of Roman Geographers’ Work:

The work of Roman geographers involved a combination of historical, mathematical, and literary approaches to geographical study. Strabo and Ptolemy, in particular, used historical traditions and mathematical measurements to describe various parts of the world accurately. Ptolemy’s use of a projection that displayed latitude and longitude graticules in map-making enhanced the clarity and accuracy of maps during that time.

Objectives of Roman Geographers’ Work:

The primary objective of Roman geographers was to create a comprehensive understanding of the world known to them at that time. They aimed to document and describe natural features, human settlements, and various cultural traditions, which contributed to the broader understanding of geography and diverse societies across the Roman Empire.

Effects of Roman Geographers’ Work:

The work of Roman geographers had long-lasting effects on the development of geographical thought and practice. Their contributions in map-making and geographical descriptions continued to influence navigators, traders, and scholars for centuries. Ptolemy’s eight-volume “Guide to Geography,” complete with commentaries, tables, and maps, became an essential reference for scholars and navigators.

Pros and Cons of Roman Geographers’ Work:

While the contributions of Roman geographers have had a lasting impact on geographical knowledge, there were limitations to their work as well. For example, Ptolemy made mistakes in his longitude calculations and estimations of the Earth’s extent, leading to inaccuracies in his geographical descriptions. However, these limitations also provided opportunities for future scholars to understand and rectify such errors, contributing to the advancement of geographical knowledge.

Fun Fact: Despite the prevalent belief that the Romans did not make significant contributions to geography, the work of Roman geographers such as Strabo and Ptolemy paved the way for advancements in map-making, geographical descriptions, and mathematical measurements that continue to influence geographical understanding to this day.

In summary, the contributions of Roman geographers were significant in the development of geographical thought and practice. Through their historical, mathematical, and literary approaches to geographical study, they created a comprehensive understanding of the known world during the Roman Empire, leaving a lasting impact on navigators, traders, and scholars for centuries to come.

Mutiple Choice Questions

1. Who was Marcus Terentius Varro and what was his contribution to geography?
a) A Greek scholar who produced a treatise on geography
b) A Roman geographer who proposed a theory about the stages of human culture
c) A Roman emperor who wrote extensively on historical and regional geography
d) An Egyptian mathematician who studied the Earth’s circumference

Answer: b) A Roman geographer who proposed a theory about the stages of human culture. Varro produced a succinct treatise on geography and proposed a theory about the stages of human culture.

2. What defines Strabo’s contribution to geography?
a) He believed that the Earth was a stationary sphere at the Centre of the cosmos
b) He developed a 17-volume work called Geographia that provided an encyclopedic assessment of the known world
c) He was the first person to calculate the Earth’s circumference
d) He was the first person to describe the historical tradition in geography introduced by Greek thinkers

Answer: b) He developed a 17-volume work called Geographia that provided an encyclopedic assessment of the known world. Strabo authored Geographia, a 17-volume work that provided an encyclopedic assessment of the known world, encompassing cultural diversity, government forms, and local traditions.

3. What did Ptolemy contribute to geography?
a) He believed in the literary-historical approach to geographical studies
b) He developed a new mathematical technique for mapping the Earth
c) He attempted to objectively organize and analyze ancient Greek geographical and astronomical notions
d) He was the first person to prove that the Earth was a stationary sphere

Answer: c) He attempted to objectively organize and analyze ancient Greek geographical and astronomical notions. Ptolemy’s work marked a key milestone in the mathematical heritage of ancient geography and he attempted to objectively organize and analyze ancient Greek geographical and astronomical notions.

4. What is the significant advancement in mapping during the Roman era, particularly with Ptolemy’s contributions?
a) Maps were enhanced with greater clarity and accuracy
b) Maps were developed for sea navigation only
c) Maps were used to depict the political boundaries of the Roman Empire
d) Maps were first used to show natural features and human settlements

Answer: a) Maps were enhanced with greater clarity and accuracy. Later, throughout the Roman era, and particularly with Ptolemy’s contributions, maps were enhanced with greater clarity and accuracy, marking a remarkable advancement in the history of geographical comprehension.

Brief Summary | UPSC – IAS

Greek geographical traditions were adopted by ancient Roman geographers, and significant contributions were made in the areas of historical and regional geography, mapping, surveying, and the description of natural features and human settlements. Scholars like Strabo and Ptolemy made important contributions to the field, with Strabo focusing on historical geography and the political aspects of the Roman Empire, and Ptolemy making key advancements in mathematics and map-making. However, there was a divide in geographical studies between those who preferred a mathematical approach and those who focused on a literary-historical approach, resulting in a dualism in geographical thinking.

“Climatic Regions of India: Exploring Diversity and Influencing Factors”

Exploring the Climatic Regions of India

India is a diverse country, full of various physical and cultural aspects. One of the most interesting topics to study in India is its climatic regions. The climatic regions of India have been extensively studied by scholars and experts using the Köppen system, which takes into account the monthly values of temperature and precipitation.

India Hosts Six Major Climatic Subtypes

India can be divided into six major climatic subtypes, each with its own unique characteristics and features. Let’s take a closer look at these climatic regions:

Tropical Climatic Regions of India

The tropical climatic regions of India include the tropical wet (Af), tropical wet and dry (Aw), and tropical monsoon (Am) climates. These regions have a mean monthly temperature throughout the year of over 18°C. Most of peninsular India, the Andaman and Nicobar Islands, and parts of northeastern India fall under this category. These regions experience high temperatures and abundant rainfall.

Dry Climatic Regions of India

The dry climatic regions of India include the arid (BWh) and semi-arid (BSh) climates. These regions have very low precipitation compared to the temperature, resulting in dry conditions. The Thar Desert in the west and parts of Gujarat, Rajasthan, Punjab, Haryana, and Karnataka fall under this category. These regions experience hot and dry weather, with very little rainfall.

Warm Temperature Climatic Regions of India

The warm temperature climatic regions of India include the subtropical humid (Cwa) and Mediterranean (Csa) climates. In these regions, the mean temperature of the coldest month is between 18°C and minus 3°C. Most of the northern plains, central India, and eastern India fall under this category. These regions have moderate temperatures and experience distinct seasons.

Cold Temperate Climatic Regions of India

The cold temperate climatic regions of India include the humid continental (Dfb) and subarctic (Dfc) climates. In these regions, the mean temperature of the warmest month is over 10°C, and the mean temperature of the coldest month is under minus 3°C. The Himalayan regions of Jammu and Kashmir, Himachal Pradesh, Uttarakhand, Sikkim, Arunachal Pradesh, and parts of Ladakh fall under this category. These regions experience cold weather and heavy snowfall.

Ice Climatic Regions of India

The ice climatic regions of India include the tundra (ET) and ice cap (EF) climates. In these regions, the mean temperature of the warmest month is under 10°C. The higher altitudes of the Himalayas and some parts of Ladakh fall under this category. These regions are characterized by extremely cold temperatures and permanent ice cover.

The Significance of Climatic Regions in India

The climatic regions of India play a crucial role in shaping the natural vegetation, wildlife, agriculture, culture, and economy of the country. Each region has its own unique features and challenges that require adaptation and innovation from its inhabitants.

Key Features of Indian Climatic Regions

– Tropical regions are characterized by high temperatures and abundant rainfall.
– Dry regions experience hot and dry weather, with little rainfall.
– Warm temperate regions have moderate temperatures and distinct seasons.
– Cold temperate regions have cold weather and heavy snowfall.
– Ice regions have extremely cold temperatures and permanent ice cover.

Objectives of Studying Climatic Regions of India

Studying the climatic regions of India helps us understand:

1. The impact of climate on agriculture: Different crops thrive in different climatic regions, and understanding these regions helps farmers make informed decisions regarding crop selection and farming techniques.
2. Biodiversity: Each climatic region supports a unique range of flora and fauna, and studying these regions helps in conserving and protecting the rich biodiversity of India.
3. Disaster Management: Different climatic regions experience different weather hazards, and understanding these regions helps in developing effective disaster management strategies.
4. Tourism: The diverse climatic regions offer a variety of experiences for tourists, from beach destinations to hill stations, attracting visitors from all over the world.

Effects of Climatic Regions in India

The climatic regions of India have both positive and negative effects on the country:

– Pros:
1. Agriculture and Livelihood: Favorable climatic regions support agriculture, providing livelihood opportunities for millions of farmers.
2. Tourism: The diverse climatic regions attract domestic and international tourists, contributing to the economy.
3. Biodiversity Conservation: Different climatic regions support a rich variety of flora and fauna, contributing to the conservation of biodiversity.
4. Cultural Diversity: The climatic regions influence the culture and traditions of the people living in different parts of India, adding to its cultural diversity.

– Cons:
1. Climate Change Vulnerability: Climate change is affecting different climatic regions of India differently, making some regions more vulnerable to extreme weather events like droughts, floods, and heatwaves.
2. Agricultural Challenges: Changing climatic patterns pose challenges for farmers, making it difficult to predict and plan agricultural activities effectively.
3. Water Scarcity: Some climatic regions, particularly the arid and semi-arid regions, face water scarcity issues, affecting agriculture, livelihoods, and overall development.

Fun Fact

Did you know that India is home to a wide range of climates and landscapes within its borders? From the deserts in the west to the snowy Himalayas in the north, India offers a remarkable diversity of climates, making it a fascinating country to study and explore.

In conclusion, studying the climatic regions of India provides valuable insights into the country’s natural and cultural diversity. Understanding these regions helps in various aspects, including agriculture, tourism, disaster management, and conservation. While there are both positive and negative effects of these regions, they contribute to the unique and vibrant fabric of India.

Mutiple Choice Questions

1. Which system is used to classify the climatic regions of India?
a) Fibonacci system
b) Kelvin system
c) Köppen system
d) Newton system

Explanation: The Köppen system is used to classify the climatic regions of India based on monthly values of temperature and precipitation.

2. How many major climatic subtypes does India host?
a) three
b) four
c) five
d) six

Explanation: India hosts six major climatic subtypes.

3. Which climatic regions are characterized by a mean monthly temperature over 18°C throughout the year?
a) dry climatic regions
b) cold temperate climatic regions
c) ice climatic regions
d) tropical climatic regions

Explanation: Tropical climatic regions are characterized by a mean monthly temperature over 18°C throughout the year.

4. Which region of India falls under the category of tropical climatic regions?
a) the Thar Desert
b) central India
c) Ladakh
d) northeastern India

Explanation: Peninsular India, the Andaman and Nicobar Islands, and parts of northeastern India fall under the category of tropical climatic regions.

5. Which climatic regions have very low precipitation compared to the temperature?
a) tropical climatic regions
b) warm temperature climatic regions
c) dry climatic regions
d) cold temperate climatic regions

Explanation: Dry climatic regions have very low precipitation compared to the temperature.

6. Which climatic regions include the Thar Desert in the west and parts of Gujarat, Rajasthan, Punjab, Haryana, and Karnataka?
a) tropical climatic regions
b) warm temperature climatic regions
c) dry climatic regions
d) cold temperate climatic regions

Explanation: The Thar Desert in the west and parts of Gujarat, Rajasthan, Punjab, Haryana, and Karnataka fall under the category of dry climatic regions.

7. In which climatic regions does the mean temperature of the warmest month exceed 10°C and the mean temperature of the coldest month is below -3°C?
a) dry climatic regions
b) cold temperate climatic regions
c) ice climatic regions
d) warm temperature climatic regions

Explanation: Cold temperate climatic regions have a mean temperature of the warmest month over 10°C and a mean temperature of the coldest month under -3°C.

8. Which regions of India fall under the category of cold temperate climatic regions?
a) Ladakh and parts of Ladakh
b) northeastern India
c) central India
d) the Thar Desert

Explanation: The Himalayan regions of Jammu and Kashmir, Himachal Pradesh, Uttarakhand, Sikkim, Arunachal Pradesh, and parts of Ladakh fall under the category of cold temperate climatic regions.

9. Which climatic regions are characterized by a mean temperature of the warmest month below 10°C?
a) dry climatic regions
b) ice climatic regions
c) warm temperature climatic regions
d) tropical climatic regions

Explanation: Ice climatic regions are characterized by a mean temperature of the warmest month below 10°C.

10. How do the Himalayas influence the climatic regions of India?
a) by attracting moisture-laden winds from the southwest
b) by moderating the temperature and humidity of the coastal regions
c) by acting as a barrier to cold winds from Central Asia
d) by bringing rainfall to most parts of India during summer

Explanation: The Himalayas act as a barrier to the cold winds from Central Asia, keeping most of India warm or mildly chilly in winter.

11. What is the impact of climatic regions on the natural vegetation, wildlife, agriculture, culture, and economy of India?
a) no impact
b) minimal impact
c) significant impact
d) temporary impact

Explanation: The climatic regions of India have a significant impact on the natural vegetation, wildlife, agriculture, culture, and economy of the country.

12. Which system is used to classify the climatic regions of the world?
a) Fibonacci system
b) Kelvin system
c) Köppen system
d) Newton system

Explanation: The Köppen system is also used to classify climatic regions of the world.

Brief Summary | UPSC – IAS

This article explains the six major climatic regions of India based on the Köppen system. The tropical regions include the wet, wet and dry, and monsoon climates. Dry regions consist of arid and semi-arid climates, while warm temperate regions include subtropical humid and Mediterranean climates. Cool temperate regions comprise humid continental and subarctic climates, and ice climates are found in high altitudes. Factors such as the Himalayas, Thar Desert, Indian Ocean, and monsoon winds influence the country’s climatic regions. These regions have a significant impact on vegetation, wildlife, agriculture, culture, and economy, requiring adaptation and innovation from inhabitants.

“Drought Prone Regions in India: Impact & Types | 119 Post Views”

drought prone region of india

Understanding Drought-Prone Regions in India

As a teacher, it is essential to educate students about various geographical phenomena that affect our planet. One such phenomenon is drought, which has a significant impact on India. In this article, we will explore the significance, features, objectives, effects, and fun facts about drought-prone regions in India.

Significance of Drought-Prone Regions in India

Understanding drought-prone regions in India is crucial because they have a profound impact on the country. In India, approximately 16% of the total area and 12% of the population are affected by recurring droughts. Droughts can lead to water scarcity, affecting agriculture, livestock, industries, and human populations. To quantify the intensity of drought, scientists use a moisture index (MI).

Features of Drought

Drought is characterized as any scarcity of water that affects agriculture, livestock, industry, or human population. It refers to a temporary reduction in water or moisture availability significantly below the normal or expected amount for a specific period. Drought can occur due to inadequate rainfall or rainfall occurring with substantial gaps between wet spells.

Objectives of Understanding Drought-Prone Regions

The objectives of understanding drought-prone regions in India include:

  • Educating people about the causes and effects of drought
  • Creating awareness about the need for water conservation
  • Identifying regions that require drought management strategies and resources
  • Developing strategies to mitigate the impact of drought on agriculture, industries, and human populations
  • Encouraging research and measures to enhance water availability in drought-prone areas

Effects of Drought

Drought has several adverse effects on the affected regions:

  • Water scarcity for drinking, irrigation, and industries
  • Reduction in agricultural productivity and crop losses
  • Decreased availability of fodder for livestock
  • Increased risk of wildfires
  • Economic losses due to reduced agricultural output
  • Migration of people from drought-prone areas to urban areas

Types of Drought

Drought can be classified into various types:

  • Meteorological Drought: Occurs when rainfall is inadequate
  • Hydrological Drought: Relates to water availability in rivers, lakes, and reservoirs
  • Agricultural Drought: Affects crop production and agriculture
  • Soil Moisture Drought: Refers to insufficient moisture in the soil
  • Socio-economic Drought: Impacts the socio-economic conditions of an area due to water scarcity
  • Famine: A severe and prolonged shortage of food
  • Ecological Drought: Affects ecosystems and biodiversity

Drought-Prone Regions in India

A drought-prone area is defined as one in which there is a greater than 20% probability of a drought year. Chronic drought-prone areas have a probability greater than 40%. In India, approximately one-third of the land area, around 10 lakh square kilometers, is prone to drought. These areas receive low and highly unreliable rainfall.

There are 77 districts in India that receive less than 75cm of rainfall per annum, making them highly drought-prone and accounting for 34% of the net sown area. Additionally, there are 22 districts in Maharashtra, Gujarat, Madhya Pradesh, Karnataka, Rajasthan, and Uttar Pradesh that receive 75-85cm of rainfall per annum and are also considered drought-prone.

It is interesting to note that droughts have occurred even in regions with adequate rainfall, such as West Bengal, Odisha, and Bihar, where failures in rainfall can affect millions of people due to high population densities.

Fun Fact: Frequency of Droughts in India

The frequency of droughts varies across different regions of India. Here is a breakdown of the recurrence of highly deficient rainfall periods in different meteorological subdivisions:

Meteorological Sub-divisions Recurrence pf the period of highly deficient Rainfall
Assam Very rare, once in 15 years
West Bengal, Chhattisgarh, Bihar, MP, Coastal Andhra Pradesh, Maharashtra, Konkan, Kerala, Odisha Once in 5 years
South interior Karnataka, eastern Uttar Pradesh, Vidarbha Once in 4 years
Gujarat, Eastern Rajasthan, Western Uttar Pradesh, Tamil Nadu, Kashmir, Rayalaseema, Telangana Once in 3 years
Western Rajasthan Once in 2.5 years

Pros and Cons

Pros:

  • Studying drought-prone regions helps in raising awareness about water scarcity and the need for conservation.
  • It enables the development of effective drought management strategies.
  • Understanding drought can assist in the mitigation of its adverse effects on agriculture, industries, and ecosystems.

Cons:

  • Drought can lead to agricultural losses, economic hardships, and human suffering.
  • Drought-prone regions often face water scarcity and long-lasting impacts on the local population.
  • Efforts to combat drought effects can be resource-intensive and challenging.

Conclusion

Drought-prone regions in India have a significant impact on the country’s agriculture, industries, and population. It is essential to understand the causes, effects, and strategies to mitigate the impact of drought. By raising awareness, implementing conservation measures, and developing sustainable solutions, we can work towards minimizing the impact of drought on the affected regions and ensure a better future for all.

Sources:

– Mr Bhugolvetta (geographystudy.com) – YouTube
– ProEducator Academy – Learn by Experts

Mutiple Choice Questions

1. What is the definition of drought?
A) A lack of water in a specific region for a specific period
B) A temporary reduction in water availability
C) Insufficient rainfall for agriculture, livestock, industry, or human population
D) All of the above

Explanation: According to the information provided, drought is defined as any lack of water to satisfy the normal needs of agriculture, livestock, industry, or human population. It is a temporary reduction in water or moisture availability significantly below the normal or expected amount for a specific period.

Correct answer: D) All of the above

2. What is the scientifically computed index for drought?
A) Moisture Index (MI)
B) Drought Index (DI)
C) Rainfall Index (RI)
D) Soil Moisture Index (SMI)

Explanation: According to the information provided, the scientifically computed index for drought is the Moisture Index (MI).

Correct answer: A) Moisture Index (MI)

3. What percentage of agricultural land in India is prone to drought?
A) 35%
B) 68%
C) 33%
D) 16%

Explanation: According to the information provided, around 68 percent of the agricultural land in India is prone to drought in varying degrees.

Correct answer: B) 68%

4. Which of the following is NOT a type of drought mentioned?
A) Meteorological drought
B) Hydrological drought
C) Agricultural drought
D) Economical drought
E) Ecological drought

Explanation: According to the information provided, the types of drought mentioned are meteorological drought, hydrological drought, agricultural drought, soil moisture drought, socio-economic drought, famine, and ecological drought.

Correct answer: D) Economical drought

5. What is the probability threshold for a drought-prone area/region in India?
A) 10%
B) 20%
C) 30%
D) 40%

Explanation: According to the information provided, a drought-prone area/region is defined as one in which the probability of a drought year is greater than 20%.

Correct answer: B) 20%

6. Which region in India is demarcated as the worst famine tracts of the country?
A) Ahmedabad to Kanpur
B) Kanpur to Jalandhar
C) Leeside of the Western Ghats
D) Southern tip of the peninsula

Explanation: According to the information provided, the desert and semi-desert region demarcated by the lines from Ahmedabad to Kanpur and Kanpur to Jalandhar is the worst famine tracts of the country.

Correct answer: A) Ahmedabad to Kanpur

7. What is the frequency of highly deficient rainfall in Western Rajasthan?
A) Once in 2.5 years
B) Once in 3 years
C) Once in 4 years
D) Once in 5 years

Explanation: According to the information provided, highly deficient rainfall occurs in Western Rajasthan once in 2.5 years.

Correct answer: A) Once in 2.5 years

Brief Summary | UPSC – IAS

Approximately 68% of agricultural land in India is prone to drought, with 35% experiencing drought conditions and 33% being chronically prone to drought. Drought can occur due to inadequate rainfall or insufficient rainfall during critical periods for crops. There are various types of drought, including meteorological, hydrological, agricultural, soil moisture, socio-economic, famine, and ecological. A drought-prone area is defined as one with a probability of a drought year greater than 20%, while a chronic drought-prone area has a probability greater than 40%. Around 77 districts in India receive less than 75cm of rainfall per year and are considered drought-prone.

Understanding Salinity: Distribution, Factors, and Effects

Understanding Salinity: The Measure of Salt in Water

Salinity is a crucial aspect of our oceans and seas, influencing various physical and chemical properties of water. It refers to the measure of the amount of dissolved salts in water and is typically expressed in grams of salt per liter or kilogram of water, or in parts per thousand (‰).

Source of Oceanic Salinity

The primary source of oceanic salinity is the land, with rivers bringing salts in solution form from continental areas. Additionally, volcanic ashes also contribute significantly to oceanic salinity. However, the salts brought by rivers undergo some modifications in the oceans, making volcanic ashes a major source of salinity in the oceans.

Controlling Factors of Salinity

Several factors affect the amount of salinity in different oceans and seas. These factors are known as controlling factors of oceanic salinity and include:

  • Evaporation: There is a direct positive relationship between the rate of evaporation and salinity. Higher temperatures and low humidity cause more concentration of salt, resulting in higher salinity.
  • Precipitation: Precipitation is inversely proportional to salinity. Higher rainfall leads to lower salinity, while lower rainfall results in higher salinity.
  • Influx of river water: Rivers bring salt from the land to the oceans, reducing salinity at their mouths. However, when evaporation exceeds the influx of fresh river waters, salinity increases.
  • Atmospheric pressure and wind direction: Anti-cyclonic conditions with stable air and high temperature increase salinity. Wind direction helps redistribute salt in the oceans, causing variations in salinity along the coasts.
  • Circulation of oceanic water: Oceanic currents mix seawaters and play a role in the spatial distribution of salinity. Equatorial warm currents drive away salts from the western coastal areas of continents and accumulate them along the eastern coastal areas.

Why Man is Seldom Drowned in High Salinity Sea Water?

The reason why humans are seldom drowned in sea water with very high salinity is due to the principle of buoyancy. Saltwater is denser than freshwater, allowing humans to float more easily. The high salinity of the water provides greater buoyancy, making it easier for individuals to stay afloat. Additionally, the high amount of dissolved salts affects the physical properties of water, increasing its density and providing additional support for buoyancy. However, prolonged exposure to highly salty water can be harmful to the human body due to dehydration and other health issues.

Significance of Salinity

Salinity has significant implications for aquatic life and the functioning of marine ecosystems. It determines the types of organisms that can thrive in different aquatic environments. Some organisms, such as certain types of fish and marine plants, have adapted to high salinity environments, while others are better suited for low salinity areas. Salinity also affects the water’s freezing point, heat capacity, conductivity, and density. Understanding salinity is crucial for studying and managing marine ecosystems, as well as for various industries that rely on oceanic resources.

Fun Fact:

The Dead Sea, located between Jordan and Israel, is one of the saltiest bodies of water on Earth. Its salinity is approximately 34.2%, almost ten times saltier than the regular ocean water. Due to its high salt concentration, it is effortless for individuals to float on the surface without sinking.

Mutiple Choice Questions

1. What is salinity?
a. The weight of the dissolved materials in sea water
b. The weight of the sample sea water
c. The amount of dissolved salts in water
d. The ratio between the weight of the dissolved materials and the weight of sample sea water

Explanation: Salinity is defined as the ratio between the weight of the dissolved materials and the weight of sample sea water.

2. How is salinity usually expressed?
a. In grams of salt per liter or kilogram of water
b. In grams of salt per milliliter of water
c. In parts per million (ppm)
d. In parts per thousand (‰)

Explanation: Salinity is usually expressed in grams of salt per liter or kilogram of water, or in parts per thousand (‰).

3. How does salinity affect water?
a. It affects its density, heat capacity, conductivity, and freezing point
b. It affects its color, odor, and taste
c. It changes its pH level
d. It has no effect on water

Explanation: Salinity affects many physical and chemical properties of water, such as its density, heat capacity, conductivity, and freezing point.

4. What is the primary source of oceanic salinity?
a. Volcanic ashes
b. Evaporation
c. Precipitation
d. Rivers

Explanation: The primary source of oceanic salinity is land, as rivers bring salts in solution form from the continental areas.

5. What is the relationship between evaporation and salinity?
a. There is a direct positive relationship between the rate of evaporation and salinity
b. There is a direct negative relationship between the rate of evaporation and salinity
c. There is an inverse relationship between the rate of evaporation and salinity
d. There is no relationship between evaporation and salinity

Explanation: There is a direct positive relationship between the rate of evaporation and salinity, meaning that greater the salinity, higher the evaporation rate.

6. How does precipitation affect salinity?
a. It increases salinity
b. It decreases salinity
c. It has no effect on salinity
d. It depends on the amount of precipitation

Explanation: Precipitation is inversely proportional to salinity, meaning that higher the rainfall, lower the salinity, and vice versa.

7. How does the influx of river water affect salinity?
a. It increases salinity
b. It decreases salinity
c. It has no effect on salinity
d. It depends on the river

Explanation: The influx of river water reduces the salinity at the mouth of the ocean, as the large volume of fresh water dilutes the salt concentration.

8. How do atmospheric pressure and wind direction affect salinity?
a. They increase salinity
b. They decrease salinity
c. They have no effect on salinity
d. It depends on the specific conditions

Explanation: Anti-cyclonic conditions with stable air and high temperature increase the salinity of the surface water of the oceans. Winds also help in redistributing salt in the oceans and seas, resulting in changes in salinity.

9. What is the composition of seawater?
a. A mixture of various gases
b. A composite solution of mineral substances in a dilute form
c. A mixture of organic compounds
d. Pure water without any dissolved substances

Explanation: Seawater contains a composite solution of a huge amount of mineral substances in a dilute form, making it an active solvent.

10. How does salinity vary with latitudinal distribution?
a. Salinity increases from the equator towards the poles
b. Salinity decreases from the equator towards the poles
c. Salinity is the highest near the equator
d. Salinity remains constant throughout the latitudes

Explanation: On an average, salinity decreases from the equator towards the poles, with the highest salinity recorded at 20-40 degrees north latitude.

Brief Summary | UPSC – IAS

Salinity is the measure of the amount of dissolved salts in water. It affects the physical and chemical properties of water and determines the types of organisms that can live in different aquatic environments. The primary source of oceanic salinity is from land, where rivers bring salts in solution form. The factors that affect salinity include evaporation, precipitation, influx of river water, prevailing winds, ocean currents, and sea waves. Evaporation increases salinity, while precipitation decreases it. The composition of seawater contains a wide variety of mineral substances in dilute form. Salinity varies from enclosed seas to open seas, with higher salinity in tropical zones and lower salinity near the equator and poles. Marginal areas of oceans have lower salinity due to the influx of fresh water from rivers.

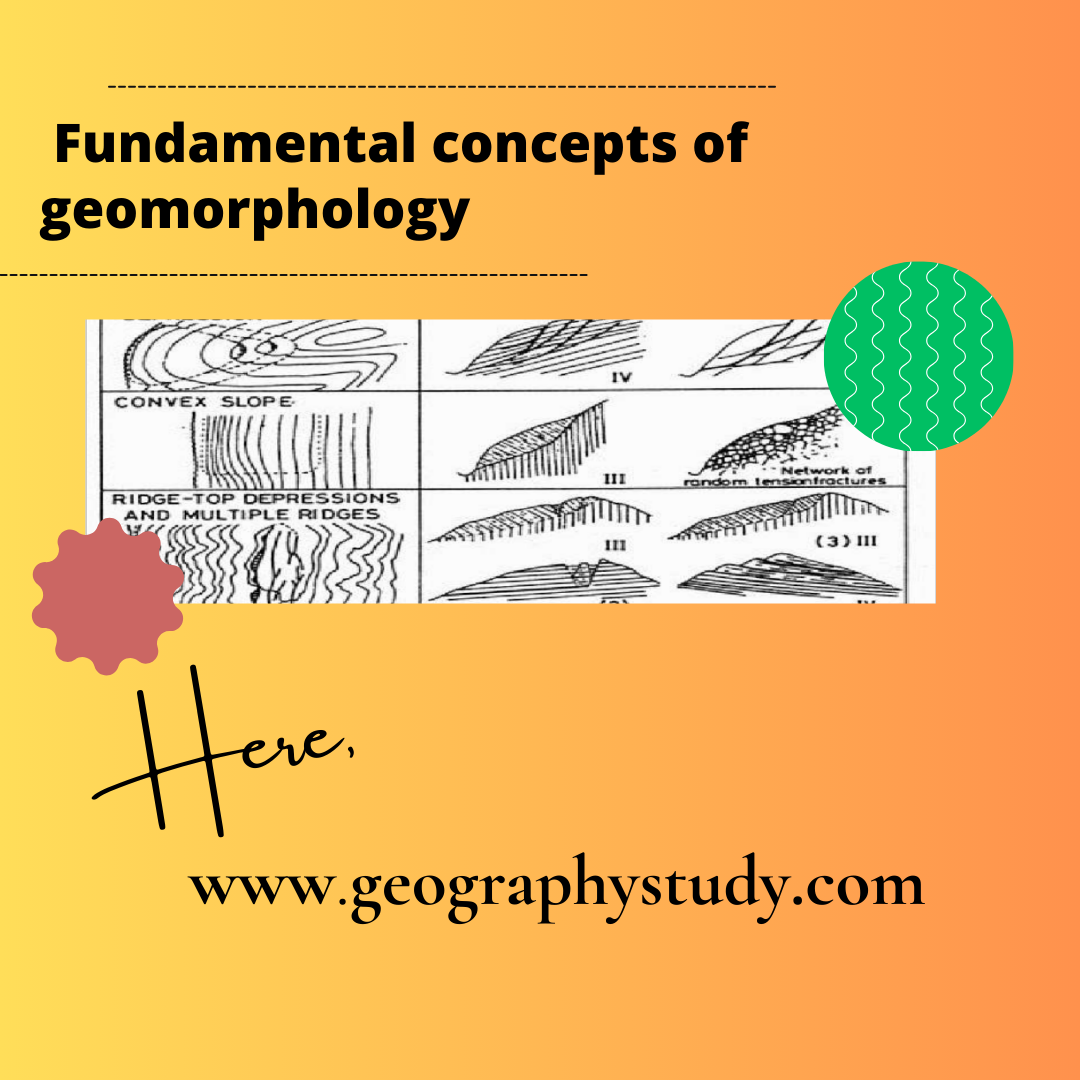
Fundamental Concepts of Geomorphology: Landform Interpretation and Evolution

fundamental concepts of geomorphology? - Geography Study

The Fundamental Concepts of Geomorphology

Geomorphology is a fascinating and diverse subject that involves the study of earth’s relief features and the processes that shape them. In this article, we will explore the most important principles of geomorphology known as the fundamental concepts of geomorphology. These concepts are crucial in understanding and interpreting landscapes.

Concept 1: The Principle of Uniformitarianism

According to this principle, the same physical processes and laws that operate today have been operating throughout geological time, although not necessarily with the same intensity. This principle, proposed by Hutton and popularized by Lyell, suggests that the present is the key to the past. For example, the wind deposits that formed the Navajo sandstone during Jurassic times followed different laws of wind flow compared to present-day wind deposits. This principle is also applied in predicting volcanic activity.

Concept 2: Geological Structure as a Dominant Control Factor

This concept highlights the importance of geological structures in the evolution of landforms. Geological structures include phenomena such as rock attributes, the presence or absence of structures, permeability of rocks, and more. These structural features of rocks are much older than the geomorphic forms developed upon them. The increasing application of geomorphic interpretation of aerial photographs is made possible by this principle.

Concept 3: Distinctive Imprints of Geomorphic Processes

Every geomorphic process leaves a distinctive imprint on landforms, and each process develops its own characteristic assemblage of landforms. This concept applies to both endogenetic processes like volcanism and earthquakes, as well as exogenic processes like weathering, mass wasting, and erosion. Landforms can be classified based on their genetic relationships, and this concept emphasizes the importance of understanding these relationships.

Concept 4: Sequence of Landform Development

As different erosional agencies act upon the Earth’s surface, a sequence of landforms with distinctive characteristics is produced at successive stages of their development. This idea is discussed in terms of geomorphic cycles, with metaphorical terms like “youth,” “mature,” and “old” used to designate stages of development. For example, every cycle of different geological processes follows this principle, and even partial cycles leave their imprint on the surface.

Concept 5: Complexity in Geomorphic Evolution

Geomorphic evolution is rarely influenced by a single process, and landscapes are more likely to be multicyclic rather than monocyclic. It is rare to find a landscape that has not been affected by multiple geomorphic processes. In some cases, older topography is seen on new landscapes, which are referred to as exhumed or resurrected landscapes.

Concept 6: Age of Earth’s Topography

Most of the Earth’s topography is no older than the Pleistocene, and topographic features that are ancient are rare. Those that do exist are likely exhumed forms due to degradation over geological time. For example, the majority of topographical features on the Himalayan range were formed during the Pleistocene age.

Concept 7: Influence of Pleistocene Changes

Proper interpretation of present-day landscapes requires a full appreciation of the manifold influences of geologic and climatic changes during the Pleistocene. The recognition that these changes have far-reaching effects on present-day topography is crucial. Glacial outwash and wind-blown materials of glacial origin can be found all over the world, particularly in the middle latitudes. Pleistocene diastrophism also played an important role in the formation of the Himalayas and the Grand Canyon.

Concept 8: Importance of World Climates

The operation of different geomorphic processes is influenced by climatic factors, such as temperature and precipitation. High altitude areas with specific climatic conditions impose modifications on these processes. Additionally, human activities can also have a significant influence on geomorphic processes.

Concept 9: Historical Extension of Geomorphology

While primarily concerned with present-day landscapes, geomorphology attains its maximum usefulness by considering historical aspects. A historical approach, also known as paleo-geomorphology, is necessary for proper interpretation. This approach involves the application of the principle of uniformitarianism and includes the study of stratigraphy and sedimentology. Overall, understanding these fundamental concepts of geomorphology is invaluable in interpreting and comprehending the complex and ever-changing landscapes of our planet.

Fun Fact:

The field of geomorphology is continuously evolving as new technologies, such as remote sensing and GIS, allow for more detailed and accurate analysis of Earth’s landforms and processes.

Mutiple Choice Questions

1. What is the underlying principle known as in Concept 1 of geomorphology?
a) Principle of uniformitarianism
b) Principle of structure
c) Principle of distinctiveness
d) Principle of complexity
Explanation: The underlying principle in Concept 1 of geomorphology is known as the Principle of uniformitarianism.

2. Who proposed the Principle of uniformitarianism?
a) Hutton
b) Lyell
c) Worcester
d) Ashley
Explanation: The Principle of uniformitarianism was proposed by Hutton and popularized by Lyell.

3. What is Concept 4 of geomorphology primarily focused on?
a) Geological structure
b) Genetic classification
c) Principles of erosion
d) Geomorphic cycles
Explanation: Concept 4 of geomorphology is primarily focused on the development stages of landforms and the concept of geomorphic cycles.

4. According to Concept 5 of geomorphology, landscapes influenced by a single geomorphic process are:
a) Multicyclic
b) Monocyclic
c) Resurrected
d) Exhumed
Explanation: According to Concept 5 of geomorphology, landscapes influenced by a single geomorphic process are rare, and landscapes are more likely to be multicyclic than monocyclic.

5. What is emphasized in Concept 8 of geomorphology?
a) Climatic factors
b) Geological structures
c) Landform classification
d) Human activities
Explanation: Concept 8 of geomorphology emphasizes the varying importance of different geomorphic processes influenced by climatic factors.

6. What is the term used to describe the historical approach in geomorphology?
a) Geomorphic cycles
b) Paleogeomorphology
c) Uniformitarianism
d) Genetic classification
Explanation: The term used to describe the historical approach in geomorphology is paleogeomorphology, which includes stratigraphy and sedimentology.

7. What is the main focus of geomorphology?
a) Interpretation of landscapes
b) Study of weather patterns
c) Analysis of plant species
d) Exploration of ocean depths
Explanation: The main focus of geomorphology is the interpretation of landscapes and the study of Earth’s relief features.

Brief Summary | UPSC – IAS

This article discusses the fundamental concepts of geomorphology. It explains that the same physical processes and laws that operate today have operated throughout geological time, although not always with the same intensity. Geological structure is a dominant control factor in the evolution of landforms. Geomorphic processes leave their distinct imprints upon landforms, each developing its own characteristic set of landforms. As different erosional agencies act upon the Earth’s surface, a sequence of landforms with distinctive characteristics is produced. Complexity is more prevalent than simplicity in geomorphic evolution. Most of the Earth’s topography is no older than the Pleistocene period. Proper interpretation of present-day landscapes requires an understanding of the geologic and climatic changes during the Pleistocene. Knowledge of world climates is necessary to understand the varying importance of different geomorphic processes. Finally, a historical approach to geomorphic landscapes is needed for proper interpretation.

“The Impact of Salinity on Water Properties and Organism Distribution: Exploring Controlling Factors & Regional Variations”

The Importance of Salinity in the Ocean

Salinity is a crucial parameter that affects various aspects of the ocean. It refers to the measure of the amount of dissolved salts in water, typically expressed in grams per liter or parts per thousand (‰). Understanding salinity is essential for studying the physical and chemical properties of water, as well as its impact on marine organisms. In this article, we will explore the distribution of salinity, its controlling factors, and the reasons why high salinity does not drown humans in the sea.

Source of Oceanic Salinity

The primary source of oceanic salinity is the land. Rivers bring dissolved salts from continental areas to the oceans. Additionally, volcanic ashes contribute to the salinity of the oceans.

Controlling Factors of Salinity

Several factors influence the amount of salinity in different oceans and seas:

  • Evaporation: There is a direct positive relationship between the rate of evaporation and salinity. Greater evaporation leads to higher salinity in the water and vice versa. High temperatures and low humidity create ideal conditions for evaporation, resulting in increased salt concentration.
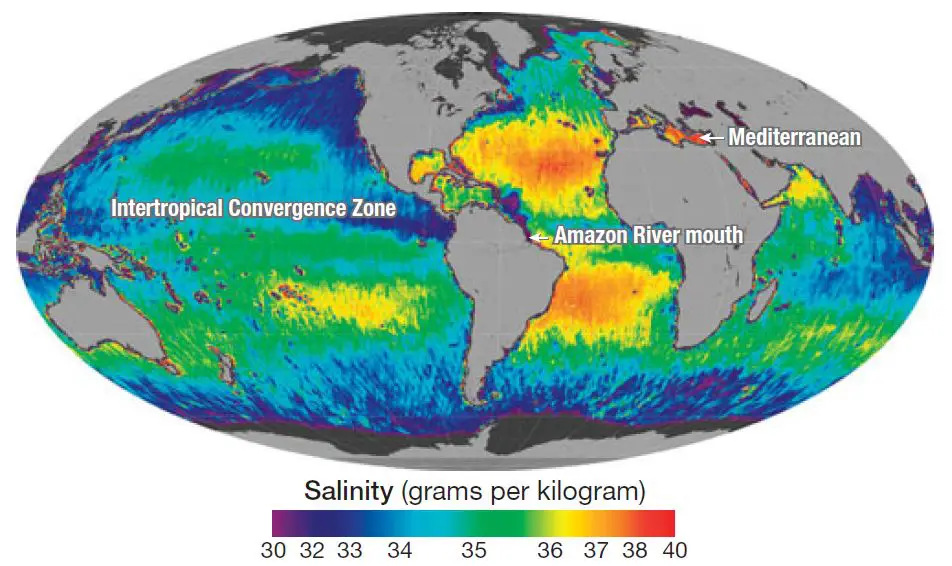
  • Precipitation: Salinity is inversely proportional to rainfall. Regions with high rainfall, such as the equatorial region, tend to have lower salinity. Conversely, areas with low rainfall, like subtropical high-pressure belts, experience higher salinity.
  • Influx of River Water: Rivers carry salts from the land to the oceans. However, large rivers pour considerable amounts of freshwater at their mouths, reducing the overall salinity at those points.
  • Atmospheric Pressure and Wind Direction: Anticyclonic conditions with stable air and high temperatures increase the salinity of surface water. Prevailing winds also redistribute salt, driving away saline water to less saline areas.
  • Ocean Currents: Oceanic currents play a role in mixing seawater and influencing the spatial distribution of salinity. Warm equatorial currents drive salts away from western coastal areas and accumulate them along eastern coasts. Oceanic currents have less impact on enclosed and marginal seas.

Composition of Seawater

Seawater contains a composite solution of various mineral substances in a dilute form. The major salts in seawater include sodium chloride, magnesium chloride, magnesium sulfate, calcium sulfate, potassium sulfate, calcium carbonate, and magnesium bromide.

Distribution of Salinity

The spatial distribution of salinity in the ocean can be studied from a horizontal and vertical perspective.

Horizontal Distribution

Salinity levels vary from enclosed seas to open seas. On average, salinity decreases from the equator towards the poles. However, the equator itself accounts for a relatively low salinity level. The highest salinity is typically recorded at latitudes between 20 and 40 degrees north, while the average salinity at 10-30 degrees south is around 35 ‰. Marginal areas of oceans often have lower salinity due to the influx of fresh water from rivers.

Vertical Distribution

Vertical distribution refers to the variation in salinity with depth. It is influenced by factors such as temperature, density, and currents. Typically, salinity decreases with depth, as freshwater and melting ice dilute the surface water. However, there can be variations depending on specific oceanic conditions and geographic locations.

Significance of Salinity

Salinity is crucial for studying the ocean’s overall health. It affects various physical and chemical properties of water, including density, heat capacity, conductivity, and freezing point. Salinity also impacts the types of organisms that can survive in different aquatic environments. By understanding salinity patterns, scientists can gain insights into ocean circulation, climate models, and marine ecosystems.

Fun Fact

Did you know that the Dead Sea, located between Israel and Jordan, has one of the highest levels of salinity in the world? Its salinity reaches about 34.2%, which is almost ten times saltier than the average ocean water.

In conclusion, salinity is a crucial parameter that affects various aspects of the ocean. It is influenced by factors such as evaporation, precipitation, river inflow, atmospheric pressure, wind direction, and ocean currents. Understanding salinity patterns helps scientists study the ocean’s physical and chemical properties, as well as its impact on marine life.

Mutiple Choice Questions

1. What is salinity?
a) The measure of the amount of dissolved salts in water
b) The weight ratio of dissolved materials to sample sea water
c) The density of water
d) The freezing point of water

Explanation: Salinity is the measure of the amount of dissolved salts in water. It is usually expressed in grams of salt per liter or kilogram of water, or in parts per thousand (‰).

2. What is the primary source of oceanic salinity?
a) Rivers bringing salts from continental areas
b) Volcanic ashes
c) Evaporation
d) Precipitation

Explanation: The primary source of oceanic salinity is land. Rivers bring salts in solution form from the continental areas and volcanic ashes are also a major source of oceanic salinity.

3. Which factor affects salinity by having a direct positive relationship with it?
a) Evaporation
b) Precipitation
c) Influx of river water
d) Prevailing winds

Explanation: Evaporation has a direct positive relationship with salinity. Greater the rate of evaporation, higher the salinity and vice versa. Evaporation causes more concentration of salt, leading to higher salinity.

4. In which region does salinity decrease due to high rainfall?
a) Subtropical high-pressure belts
b) Equatorial region
c) Trade winds belts
d) Sub-polar and polar zones

Explanation: The region with high rainfall, such as the equatorial region, records low salinity. Precipitation is inversely proportional to salinity, so higher rainfall leads to lower salinity.

5. How does the influx of river water affect salinity?
a) Salinity is reduced at the mouth of rivers
b) Salinity increases at the mouth of rivers
c) Salinity remains unchanged
d) Salinity decreases in rainy seasons

Explanation: The influx of river water reduces salinity at the mouth of rivers. The big and voluminous rivers pour down immense water at the mouth of the ocean, causing a decrease in salinity.

6. How do anti-cyclonic conditions affect salinity?
a) Increase salinity of surface water of oceans
b) Decrease salinity of surface water of oceans
c) Have no effect on salinity
d) Cause high precipitation

Explanation: Anti-cyclonic conditions with stable air and high temperature increase the salinity of the surface water of the oceans. Subtropical high-pressure belts represent such conditions, leading to high salinity.

7. How do oceanic currents affect the spatial distribution of salinity?
a) They mix seawaters and influence salinity
b) They have no influence on salinity
c) They increase salinity along the western coasts
d) They increase salinity along the eastern coasts

Explanation: Oceanic currents affect the spatial distribution of salinity by mixing seawaters. Equatorial warm currents drive away salts from the western coastal areas and accumulate them along eastern coastal areas, influencing salinity.

8. What is the composition of seawater in terms of salts?
a) A composite solution of mineral substances in dilute form
b) Pure water
c) No salts are present in seawater
d) A mixture of acids and bases

Explanation: Seawater contains a composite solution of a huge amount of mineral substances in dilute form, making it an active solvent. It consists of various salts such as sodium chloride, magnesium chloride, magnesium sulfate, calcium sulfate, and more.

9. How does salinity vary with latitude?
a) Salinity decreases from the equator towards the poles on average
b) Salinity increases from the equator towards the poles on average
c) Salinity remains constant throughout all latitudes
d) Salinity is highest near the equator

Explanation: Salinity decreases from the equator towards the poles on average. However, it is important to note that higher salinity is seldom recorded near the equator. The highest salinity is typically found at 20-40 degrees north latitude.

10. Which sea has salinity below normal?
a) Baltic Sea
b) Red Sea
c) Persian Gulf
d) Mediterranean Sea

Explanation: The Baltic Sea has salinity below normal, recording a salinity of 3-15‰. The Red Sea, Persian Gulf, and Mediterranean Sea have salinity above the normal.

Brief Summary | UPSC – IAS

Salinity is the measure of the amount of dissolved salts in water and affects various properties and organisms in aquatic environments. The primary source of oceanic salinity is land, with rivers bringing salts in solution form. Factors such as evaporation, precipitation, influx of river water, prevailing winds, ocean currents, and sea waves all influence the amount of salinity in different oceans and seas. Evaporation has a direct positive relationship with salinity, while precipitation is inversely proportional to salinity. Other factors such as atmospheric pressure, wind direction, and circulation of oceanic water also play a role. Salinity varies horizontally and vertically across different latitudes and regions.

“Understanding Salinity: Distribution & Factors Controlling Oceanic Salinity”

Understanding Salinity: The Measure of Dissolved Salts in Water

Salinity is a term used to describe the measure of the amount of dissolved salts in water. It is usually expressed in grams of salt per liter or kilogram of water, or in parts per thousand (‰). Salinity affects numerous physical and chemical properties of water, such as its density, heat capacity, conductivity, and freezing point. Furthermore, salinity plays a crucial role in determining the types of organisms that can thrive in different aquatic environments.

Source of Oceanic Salinity

The primary source of oceanic salinity is the land. Rivers carry salts in solution form from the continental areas, contributing to the salinity of the oceans. Additionally, volcanic ashes are a major source of oceanic salinity.

Controlling Factors of Salinity

Several factors influence the salinity levels in different oceans and seas. These factors are referred to as controlling factors of oceanic salinity:

  1. Evaporation: There is a direct positive relationship between the rate of evaporation and salinity. Higher evaporation rates, resulting from high temperatures and low humidity, cause increased salt concentration and higher overall salinity. For example, the salinity is generally higher near the tropics due to the high rate of evaporation in dry air over the tropics of Cancer and Capricorn.
  2. Precipitation: Precipitation is inversely proportional to salinity. Regions with high rainfall, such as the equatorial region, tend to have lower salinity compared to areas with low rainfall, such as the subtropical high-pressure belt.
  3. Influx of river water: Rivers bring salt from the land to the oceans. However, large rivers pouring immense amounts of water into the ocean can reduce salinity at their mouths. On the other hand, regions with higher rates of evaporation than influx of fresh river water experience an increase in salinity.
  4. Atmospheric pressure and wind direction: Stable air with high temperatures caused by anti-cyclonic conditions can increase the salinity of surface ocean water. Prevailing winds help redistribute salt in the oceans and seas, resulting in changes in salinity levels. For example, westerlies increase salinity along the western coasts of continents while lowering salinity along the eastern coasts.
  5. Circulation of oceanic water: Oceanic currents play a role in mixing seawaters and affecting the spatial distribution of salinity. Equatorial warm currents drive away salts from western coastal areas of continents and accumulate them along eastern coastal areas, influencing the salinity levels in those regions.

Composition of Seawater

Seawater contains a composite solution of various mineral substances in dilute form due to its role as an active solvent. The composition of seawater includes:

Salts Amount (‰) Percentage
Sodium chloride (NaCl) 27.2 77.8%
Magnesium chloride (MgCl2) 3.8 10.9%
Magnesium sulfate (MgSO4) 1.6 4.7%
Calcium sulfate (CaSO4) 1.2 3.6%
Potassium sulfate (K2SO4) 0.8 2.5%
Calcium carbonate (CaCO3) 0.1 0.3%
Magnesium bromide (MgBr2) 0.1 0.2%

Distribution of Salinity

Salinity distribution in oceans and seas can be analyzed from both horizontal and vertical perspectives.

Horizontal Distribution of Salinity

The latitudinal distribution of salinity shows a decreasing trend from the equator towards the poles, with the highest salinity typically recorded around 20-40 degrees north latitude. However, the equatorial zone itself accounts for a relatively low salinity of approximately 35‰. The northern and southern hemispheres, on average, record salinity levels of 31‰ and 34‰, respectively. Marginal areas of oceans bordering continents generally have lower salinity due to the influx of fresh river waters.

Vertical Distribution of Salinity

The vertical distribution of salinity in the ocean varies with depth. In general, salinity levels decrease with depth, as surface waters tend to be influenced by factors such as evaporation and precipitation, while deeper waters are less affected by these processes. Vertical distribution plays a significant role in oceanographic studies, as it can provide insights into the mixing and circulation of oceanic waters.

Significance of Salinity

Salinity is of great importance in various fields, including oceanography, climate science, and marine biology. It helps scientists understand the composition and behavior of seawater, influences ocean currents and climate patterns, and affects the distribution and survival of marine organisms. The study of salinity provides valuable information for environmental monitoring, marine resource management, and predicting the impacts of climate change on aquatic ecosystems.

Fun Fact: Why Man is Seldom Drowned in Sea Water with Very High Salinity?

The high salinity of sea water makes it denser than the human body, resulting in increased buoyancy. This buoyancy makes it easier for humans to float and stay afloat in sea water with high salinity, reducing the likelihood of drowning. In comparison, freshwater bodies have lower salinity and lower buoyancy, making it more difficult to float and increasing the risk of drowning.

In conclusion, salinity is a crucial property of water, influencing various aspects of aquatic environments. Understanding the factors and distribution of salinity contributes to our knowledge of oceanography, climate science, and marine ecosystems.

Mutiple Choice Questions

1. What is salinity?
A) The weight of sea water
B) The weight of dissolved materials in sea water
C) The weight of salt per liter of water
D) The weight of salt per kilogram of water
Explanation: Salinity is defined as the ratio between the weight of dissolved materials and the weight of the sample sea water.

2. How is salinity usually expressed?
A) Grams of salt per liter of water
B) Grams of salt per kilogram of water
C) Parts per thousand (‰)
D) All of the above
Explanation: Salinity is usually expressed in grams of salt per liter or kilogram of water, or in parts per thousand (‰).

3. How does salinity affect water?
A) It increases the density of water
B) It influences the freezing point of water
C) It affects the heat capacity of water
D) All of the above
Explanation: Salinity affects many physical and chemical properties of water, such as its density, heat capacity, conductivity, and freezing point.

4. What is the primary source of oceanic salinity?
A) Volcanic ashes
B) Evaporation
C) Influx of river water
D) Rainfall
Explanation: The primary source of oceanic salinity is land, as rivers bring salts in solution form from the continental areas. Volcanic ashes are also a major source of oceanic salinity.

5. How does evaporation affect salinity?
A) It increases salinity
B) It decreases salinity
C) It has no effect on salinity
D) It depends on other factors
Explanation: Evaporation has a direct positive relationship with salinity. Higher rates of evaporation result in higher salinity, and vice versa.

6. How does precipitation affect salinity?
A) It increases salinity
B) It decreases salinity
C) It has no effect on salinity
D) It depends on other factors
Explanation: Precipitation is inversely proportional to salinity. Higher rainfall leads to lower salinity, and vice versa.

7. How does the influx of river water affect salinity?
A) It increases salinity
B) It decreases salinity
C) It has no effect on salinity
D) It depends on other factors
Explanation: The influx of river water reduces salinity at the mouth of the ocean. Where evaporation exceeds the influx of fresh river waters, there is an increase in salinity.

8. How do atmospheric pressure and wind direction affect salinity?
A) They increase salinity
B) They decrease salinity
C) They have no effect on salinity
D) It depends on other factors
Explanation: Anti-cyclonic conditions with stable air and high temperature increase the salinity of surface water. Winds also help redistribute salt in the oceans and seas.

9. How do oceanic currents affect salinity?
A) They increase salinity
B) They decrease salinity
C) They have no effect on salinity
D) It depends on other factors
Explanation: Oceanic currents affect the spatial distribution of salinity by mixing seawaters. Warm currents drive salts away from western coastal areas and accumulate them along eastern coastal areas.

10. What is the composition of seawater?
A) Mostly sodium chloride (NaCl)
B) Mostly magnesium chloride (MgCl2)
C) Mostly calcium sulfate (CaSO4)
D) All of the above
Explanation: Seawater contains a composite solution of many mineral substances. The most abundant is sodium chloride (NaCl), followed by magnesium chloride (MgCl2), magnesium sulfate (MgSO4), calcium sulfate (CaSO4), and other minerals.

Brief Summary | UPSC – IAS

Salinity is the measure of the amount of dissolved salts in water and affects many physical and chemical properties of water. The primary source of oceanic salinity is land, with rivers bringing salts into the oceans. The factors that affect the amount of salinity in different oceans and seas include evaporation, precipitation, the influx of river water, prevailing winds, ocean currents, and sea waves. Different factors can increase or decrease salinity in certain areas. For example, evaporation leads to higher salinity, while precipitation leads to lower salinity. The spatial distribution of salinity varies horizontally and vertically, with latitudinal distribution showing decreasing salinity from the equator towards the poles. The regional distribution of salinity varies in individual oceans and seas.

“Flood: Types, Causes, and Impacts – A Comprehensive Overview”

The Devastating Effects of Floods: Understanding the Significance, Features, and Impacts

As a teacher, it is crucial to educate students about natural disasters, including floods. Floods are a state of high water level along a river channel or on the coast, leading to the inundation of land that is typically not submerged. They can occur gradually, take hours to develop, or even happen suddenly without any warning. Floods are caused by various factors such as heavy rainfall, snowmelt, breach in embankments, and spill over.

The word “flood” originates from the Old English term “flod,” which is common to Germanic languages. The European Union (EU) Floods Directive defines a flood as the covering of land not normally submerged by water. This definition emphasizes the unusual nature and impact of floods.

flood and Types of Flood

Areal Flood

Areal floods occur in flat or low-lying areas where water is supplied by rainfall or snowmelt faster than it can either infiltrate or run off. They typically happen in floodplains and local depressions not connected to a stream channel. The velocity of overland flow in areal floods depends on the surface slope, contributing to their unique characteristics.

Flash Flood

Flash floods usually occur in hilly areas due to sudden heavy rains over a limited area. They can also happen when a temporary blockage in hilly areas impounds water, which, when released suddenly, creates havoc. Flash floods are characterized by their rapid development and destructive force.

River Flood

River floods occur due to heavy inflow of water from heavy rainfall, snowmelt, and short intense storms. They are commonly associated with rivers and streams overflowing their banks and can cause extensive damage to surrounding areas.

Coastal Flood

Coastal floods are caused by heavy rainfall from cyclones or tsunamis. These floods impact coastal regions, posing significant risks to both human settlements and ecosystems. Coastal floods often result in property damage and displacement of people living in vulnerable areas.

Urban Flood

Urban flooding refers to the inundation of land or property in densely populated areas due to rainfall overwhelming the capacity of drainage systems, such as storm sewers. This type of flood is a growing concern in cities worldwide, leading to infrastructure damage and disruptions to daily life.

Catastrophic Flood

Catastrophic riverine flooding is typically associated with major infrastructure failures, such as the collapse of a dam. They can also be caused by drainage channel modification resulting from a landslide, earthquake, or volcanic eruption. These floods have severe consequences and can uproot entire communities.

Causes of Flood

The causes of floods vary from region to region and can differ between rural and urban areas. Some major causes include heavy rainfall, heavy siltation of river beds, blockage in drains, landslides blocking the flow of streams, and the construction of dams and reservoirs.

Impacts of Flood

Floods have numerous devastating impacts, affecting both humans and the environment. Some key impacts include:

  • Human Loss: Floods can cause loss of life, displacing communities and creating immense hardship for affected individuals.
  • Property Loss: Homes, buildings, and infrastructure suffer extensive damage during floods, leading to financial losses.
  • Affects the Major Roads: Floodwaters can submerge roads, disrupting transportation networks and hindering rescue and relief operations.
  • Disruption of Air, Train, and Bus Services: Floods can disrupt air, train, and bus services, leading to delays and cancellations.
  • Spread of Water-borne Communicable Diseases: Contaminated floodwaters can lead to the outbreak of water-borne diseases such as cholera and dysentery.
  • Communication Breakdown: Floods can damage communication infrastructure, hindering communication between affected areas and rescue teams.
  • Electricity Supply Cutoff: Floods can damage electrical infrastructure, causing power outages that further compound the difficulties faced by affected communities.
  • Economic and Social Disruption: Floods can disrupt economic activities and social systems, leading to job losses and emotional distress.
  • Increase in Air and Water Pollution: Floodwaters can carry pollutants, causing contamination of air and water resources, affecting public health and ecosystems.

Major Floods in India

India has a history of devastating floods that have caused immense damage and loss of life. Some major floods include:

  • Bihar floods, 1987
  • Gujarat floods, 2005
  • Maharashtra floods, 2005
  • Assam floods, 2012
  • Uttarakhand floods, 2013
  • Jammu & Kashmir floods, 2014

Flooding remains a significant challenge in India, and efforts are ongoing to mitigate the impacts through better preparedness and infrastructure development.

Flood Fun Fact

Did you know that floods can cause significant ecological benefits? Floodwaters deposit nutrient-rich sediment onto floodplains, enriching the soil and supporting diverse ecosystems. This natural process helps sustain vegetation and provides habitats for numerous species, contributing to biodiversity.

As a teacher, it is essential to educate students on the significance, features, causes, and impacts of floods. By understanding these aspects, students can develop an appreciation for the environment, disaster management, and the importance of community resilience.

Mutiple Choice Questions

1. What is the definition of a flood according to the European Union Floods Directive?
a) A state of high water level along a river channel or on the coast that leads to inundation of land
b) A covering by water of land not normally covered by water
c) A sudden breach in the embankment causing water to overflow
d) Heavy rain or snowfall causing water to infiltrate or run off rapidly

Explanation: According to the European Union Floods Directive, a flood is defined as a covering by water of land not normally covered by water.

2. Which of the following types of floods occurs in flat or low-lying areas when water is supplied by rainfall or snowmelt more rapidly than it can infiltrate or run off?
a) Flash flood
b) River flood
c) Coastal flood
d) Areal flood

Explanation: Areal flood occurs in flat or low-lying areas when water is supplied by rainfall or snowmelt more rapidly than it can infiltrate or run off.

3. What causes a flash flood?
a) Heavy inflow of water from heavy rainfall, snowmelt, and short intense storms
b) Heavy siltation of the river bed
c) Sudden heavy rain over a limited area in hill areas
d) Heavy rainfall from cyclones or tsunamis

Explanation: Flash floods occur when there is sudden heavy rain over a limited area in hill areas.

4. Coastal floods are caused by which of the following?
a) Heavy inflow of water from heavy rainfall, snowmelt, and short intense storms
b) Heavy siltation of the river bed
c) Sudden heavy rain over a limited area in hill areas
d) Heavy rainfall from cyclones or tsunamis

Explanation: Coastal floods are caused by heavy rainfall from cyclones or tsunamis.

5. What is the main cause of urban flooding?
a) Heavy rainfall overwhelming the capacity of drainage systems
b) Sudden release of impounded water in hilly areas
c) Heavy inflow of water from heavy rainfall, snowmelt, and short intense storms
d) Construction of dams and reservoirs

Explanation: Urban flooding is caused by heavy rainfall overwhelming the capacity of drainage systems.

6. Catastrophic riverine flooding is usually associated with:
a) Major infrastructure failures such as dam collapse
b) Landslides blocking the flow of the stream
c) Construction of dams and reservoirs
d) Heavy inflow of water from heavy rainfall, snowmelt, and short intense storms

Explanation: Catastrophic riverine flooding is usually associated with major infrastructure failures such as dam collapse.

7. What are some major causes of floods?
a) Heavy rainfall, heavy siltation of the river bed, blockage in the drains, landslides blocking the flow of the stream, and construction of dams and reservoirs
b) Heavy siltation of the river bed, blockage in the drains, landslides blocking the flow of the stream, and construction of dams and reservoirs
c) Heavy rainfall, blockage in the drains, landslides blocking the flow of the stream, and construction of dams and reservoirs
d) Heavy rainfall, heavy siltation of the river bed, landslides blocking the flow of the stream, and construction of dams and reservoirs

Explanation: Some major causes of floods include heavy rainfall, heavy siltation of the river bed, blockage in the drains, landslides blocking the flow of the stream, and construction of dams and reservoirs.

8. What are some impacts of floods?
a) Human loss, property loss, disruption of major roads, and spread of water-borne communicable diseases
b) Human loss, property loss, disruption of air/train/bus services, and spread of water-borne communicable diseases
c) Human loss, property loss, communication breakdown, and increase in air/water pollution
d) Human loss, property loss, disruption of major roads, and electricity supply cut off

Explanation: Some impacts of floods include human loss, property loss, disruption of major roads, and spread of water-borne communicable diseases.

9. Which of the following is a major flood event in India?
a) Flash floods in Bihar, 1987
b) Coastal floods in Gujarat, 2005
c) River floods in Maharashtra, 2005
d) Urban floods in Assam, 2012

Explanation: Jammu & Kashmir floods in 2014 was a major flood event in India.

Brief Summary | UPSC – IAS

This article defines a flood as a state of high water level along a river or on the coast that leads to the inundation of land. There are several types of floods, including areal floods, flash floods, river floods, coastal floods, urban floods, and catastrophic floods. The causes of floods vary from heavy rainfall to blockage in drains or construction of dams. The impacts of floods include human and property loss, disruption of infrastructure and services, spread of water-borne diseases, communication breakdown, and economic and social disruption. It also mentions major floods in India, such as the Bihar floods in 1987 and the Jammu & Kashmir floods in 2014.

Geographical Indications of Goods: Protection and Regulations

Geographical Indications of Goods: Exploring their Significance, Features, Objectives, Effects, Pros and Cons

Introduction

Geographical Indications of Goods (GIs) are a form of intellectual property right (IPR) that identify a product’s origin and ensure its quality and reputation. GIs refer to a geographical indication that indicates the country or place of origin of a product.

Significance of Geographical Indications of Goods

GIs play a crucial role in promoting local culture, traditions, and heritage associated with specific products. They help protect traditional knowledge and ensure fair trade practices. GIs are also important for rural development as they provide economic opportunities to rural communities by promoting regional specialties.

Key Features of Geographical Indications of Goods

1. Geographical origin:
GIs are based on the specific geographical area where the product is produced. The unique characteristics of the region contribute to the distinctiveness of the product.

2. Reputation and quality:
GIs are granted only to products that have a reputation or certain qualities associated with their origin. This ensures that consumers can trust the authenticity and quality of the product.

3. Protection and enforcement:
GIs receive legal protection to prevent misrepresentation and unauthorized use. Unauthorized use or imitation of a GI can lead to legal actions.

Objectives of Geographical Indications of Goods

1. Protecting consumers:
GIs help consumers make informed choices by ensuring that products with specific qualities and characteristics are accurately labeled and marketed.

2. Promoting rural development:
By protecting regional specialties, GIs contribute to the economic development of rural communities and help preserve traditional knowledge and practices.

3. Encouraging fair trade:
GIs create a level playing field for producers by preventing unauthorized use of a product’s geographical indication. This promotes fair competition and prevents misleading practices.

Effects of Geographical Indications of Goods

GIs have several positive effects:

1. Economic growth:
GIs contribute to the economic growth of regions by supporting local industries, generating employment, and attracting tourism.

2. Cultural preservation:
By protecting traditional products, GIs help preserve cultural heritage, traditions, and knowledge associated with specific regions.

3. Quality assurance:
Consumers can rely on GIs to ensure the quality, safety, and authenticity of products. This builds trust and strengthens brand value.

Pros and Cons of Geographical Indications of Goods

Pros:

– Protection of traditional knowledge and cultural heritage.

– Promotion of fair trade practices and market opportunities for rural communities.

– Preservation of biodiversity and sustainable agricultural practices.

Cons:

– Complex registration and enforcement processes can be time-consuming and costly for producers.

– The exclusivity of GIs may limit competition and hinder innovation.

Fun Fact about Geographical Indications of Goods:

Did you know that the first documented use of a geographical indication dates back to 1730 when the Roquefort cheese of France was protected by law?

Conclusion

Geographical Indications of Goods play a vital role in protecting the reputation, quality, and origin of products. They promote economic growth, preserve cultural heritage, and provide consumers with assurance about the authenticity and quality of products. While there are some challenges associated with registration and enforcement, the overall impact of GIs is highly positive. As a consumer, you can support GIs by choosing products with recognized geographical indications and contributing to the preservation of local traditions and communities.

Mutiple Choice Questions

1. Which organization is responsible for the protection of Geographical Indications of Goods?
a) World Trade Organization (WTO)
b) Trade Related Aspects of Intellectual Property Rights (TRIPS)
c) Paris Convention for the Protection of Industrial Property
d) ProEducator Academy

Explanation: Geographical Indications of Goods are protected under the provisions of the World Trade Organization (WTO) and the Trade Related Aspects of Intellectual Property Rights (TRIPS) Agreement, as well as the Paris Convention for the Protection of Industrial Property.

2. When did the Geographical Indications of Goods (Registration and Protection) Act, 1999 become effective in India?
a) September 15, 2003
b) October 26, 2023
c) January 1, 2000
d) It is not specified

Explanation: The Geographical Indications of Goods (Registration and Protection) Act, 1999 became effective in India on September 15, 2003.

3. Which state/UT is known for producing Chokua Rice?
a) Assam
b) Odisha
c) Tamil Nadu
d) Uttar Pradesh

Explanation: Chokua Rice is produced in the state of Assam.

4. Which state/UT is known for producing Jaderi Namkatti?
a) Assam
b) Odisha
c) Tamil Nadu
d) Uttar Pradesh

Explanation: Jaderi Namkatti is produced in the state of Tamil Nadu.

5. Which state/UT is known for producing Usta Kala Shilp?
a) Goa
b) Rajasthan
c) North Karnataka
d) Andhra Pradesh

Explanation: Usta Kala Shilp is produced in the state of Rajasthan.

6. Which state/UT is known for producing Araku Valley Coffee & Pepper?
a) Goa
b) Rajasthan
c) North Karnataka
d) Andhra Pradesh

Explanation: Araku Valley Coffee & Pepper is produced in the state of Andhra Pradesh.

7. Which state/UT is known for producing Gond Painting?
a) Madhya Pradesh
b) Tamil Nadu
c) Andhra Pradesh
d) Jammu & Kashmir

Explanation: Gond Painting is produced in the state of Madhya Pradesh.

8. Which state/UT is known for producing Ladakh Seabuckthorn?
a) Madhya Pradesh
b) Ladakh (UTs)
c) Maharashtra
d) Jammu & Kashmir

Explanation: Ladakh Seabuckthorn is produced in the Union Territory of Ladakh.

9. Which state/UT is known for producing Morena Gajak?
a) Madhya Pradesh
b) Tamil Nadu
c) Andhra Pradesh
d) Rajasthan

Explanation: Morena Gajak is produced in the state of Madhya Pradesh.

10. Which state/UT is known for producing Bhandara Chinoor Rice?
a) Maharashtra
b) Odisha
c) Tamil Nadu
d) Jammu & Kashmir

Explanation: Bhandara Chinoor Rice is produced in the state of Maharashtra.

Brief Summary | UPSC – IAS

Geographical Indications of Goods refer to the origin of a product being associated with a specific country or place within that country. They are protected as a component of intellectual property rights under various international agreements. In India, the Geographical Indications of Goods (Registration and Protection) Act was enacted in 1999 to comply with the World Trade Organization (WTO) agreements. The act came into effect in 2003. This article also provides a list of some products that have been granted geographical indication tags in various states and union territories of India.

“The Impact of Salinity on Water Properties and Life Forms in Oceans”

Understanding Salinity: A Comprehensive Guide

Salinity is a crucial concept in the field of oceanography and environmental studies. It refers to the measure of the amount of dissolved salts in water and is usually expressed in grams of salt per liter or kilogram of water, or in parts per thousand (‰). Salinity plays a significant role in shaping the physical and chemical properties of water, such as density, heat capacity, conductivity, and freezing point, as well as influencing the types of organisms that can thrive in different aquatic environments.

Source of Oceanic Salinity

The primary source of oceanic salinity is the land. When rivers flow into the oceans, they bring salts in solution form from the continental areas. Additionally, volcanic ashes also contribute to the salinity of oceans. However, the salts brought by rivers undergo modification in the oceans before contributing to the overall salinity.

Controlling Factors of Salinity

Several factors influence the salinity of different oceans and seas and are therefore referred to as controlling factors of oceanic salinity. These factors include evaporation, precipitation, influx of river water, prevailing winds, ocean currents, and sea waves.

Evaporation

Evaporation has a direct positive relationship with salinity. Higher rates of evaporation lead to higher salinity, and vice versa. When evaporation occurs due to high temperatures and low humidity (dry conditions), it causes a higher concentration of salt, resulting in increased salinity. The salinity is higher near the tropics due to the high rate of evaporation combined with dry air over the tropics of Cancer and Capricorn.

According to Wust (1935), the mean annual rate of evaporation in the Atlantic Ocean is 94cm at 40 degrees north latitude, 149cm at 20 degrees north latitude, and 105cm near the equator. Salinity is 34.68‰ at 5 degrees north and more than 37‰ at 20 degrees north. In the southern Atlantic Ocean, evaporation is 143cm/year at 10 degrees south. Sub-tropical pressure belts and trade wind belts, which experience rapid evaporation, have higher salinity.

Precipitation

Precipitation is inversely proportional to salinity. Higher rainfall results in lower salinity, and vice versa. Regions with high rainfall, such as equatorial regions, record lower salinity compared to regions with low rainfall, like the subtropical high-pressure belt.

Influx of River Water

Rivers bring salt from the land to the oceans. However, rivers that pour down immense amounts of water at the mouth of the ocean reduce the salinity at that point. For example, the mouth of the Ganges, Congo, Niger, and Amazon rivers all contribute to reduced salinity. Salinity increases when evaporation surpasses the influx of fresh river water. The Mediterranean Sea, for instance, records a salinity of 40‰.

Atmospheric Pressure and Wind Direction

Anti-cyclonic conditions with stable air and high temperatures increase the salinity of ocean surface water. Sub-tropical high-pressure belts exhibit such conditions and cause high salinity. Winds also play a role in redistributing salt in the oceans and seas. They drive away saline water to less saline areas, resulting in a decrease in salinity in the former and an increase in the latter. Westerly winds increase salinity along the western coasts of continents but lower salinity along the eastern coast.

Why Does High Salinity in the Sea Water Not Cause Drowning?

Despite the high salinity in sea water, individuals are unlikely to drown due to it. This is because the human body contains a lower concentration of salts compared to the seawater. When immersed in highly saline water, osmosis occurs, causing water to move from areas of low salt concentration (the body) to areas of high salt concentration (the surrounding water). This movement of water prevents the body from absorbing excessive amounts of salt, making drowning unlikely in very high salinity seawater.

Composition of Seawater

Seawater contains a composite solution of various mineral substances in dilute form because it is an active solvent. The composition of seawater includes salts such as sodium chloride (27.21‰), magnesium chloride (3.80‰), magnesium sulfate (1.65‰), calcium sulfate (1.26‰), potassium sulfate (0.86‰), calcium carbonate (0.12‰), and magnesium bromide (0.08‰). These minerals contribute to the overall salinity of seawater.

Distribution of Salinity

The distribution of salinity in oceans and seas is studied in terms of both horizontal and vertical distribution.

Horizontal Distribution of Salinity

Salinity decreases on average from the equator towards the poles, although the highest salinity is seldom recorded near the equator. The equator accounts for only 35‰ of salinity, while the highest salinity (around 36‰) is recorded at 20-40 degrees north latitude. The average salinity between 10-30 degrees south latitude is 35‰. Low salinity is observed at 40-60 degrees in both hemispheres. On average, the northern hemisphere records an average salinity of 31‰, while the southern hemisphere records an average salinity of 34‰.

The salinity of marginal areas of oceans bordering continents is lower than their central parts due to the addition of freshwaters from rivers. However, the salinity of partially enclosed seas in higher latitudes is influenced by factors other than latitude, such as influx of meltwater. For example, the Baltic Sea has lower salinity than the North Sea, despite both having the same latitudinal extent.

Regional Distribution of Salinity

In terms of regional distribution, Jenkins divided the oceans into three categories based on salinity variations:

1. Seas with salinity above the norm:

  • Red Sea (34-41‰)
  • Persian Gulf (37-38‰)
  • Mediterranean Sea (37-39‰)

2. Seas with normal salinity:

  • Caribbean Sea and Gulf of Mexico (35-36‰)
  • Bass Strait (35‰)
  • Gulf of California (25-35‰)

3. Seas with salinity below the norm:

  • Arctic Sea, North Australian Sea, Bering Sea, Okhotsk Sea, Japan Sea, China Sea, Andaman Sea, North Sea, English Channel, Gulf of St. Lawrence (slightly less)
  • Baltic Sea, Hudson Bay (much below)

Overall, understanding salinity is essential in comprehending the complex dynamics of our oceans and the diverse ecosystems they support. It helps scientists and researchers monitor changes in salinity patterns, which can have implications for both marine life and climate.

Fun Fact: Did you know that the Dead Sea, located between Jordan and Israel, has one of the highest salinity levels in the world? With a salinity level of around 342‰, it is almost 10 times saltier than the average ocean!

Mutiple Choice Questions

1. What is salinity?
a) The amount of dissolved salts in water
b) The weight of dissolved materials in sea water
c) The measure of the weight of sample sea water
d) The ratio of weight of dissolved materials to weight of sea water

Explanation: Salinity is the measure of the amount of dissolved salts in water. It is usually expressed in grams of salt per liter or kilogram of water, or in parts per thousand (‰).

2. What are the controlling factors of salinity?
a) Evaporation, precipitation, influx of river water, and ocean currents and sea waves
b) Influx of river water, atmospheric pressure, wind direction, and evaporation
c) Ocean currents and sea waves, evaporation, precipitation, and composition of seawater
d) Precipitation, wind direction, composition of seawater, and atmospheric pressure

Explanation: The factors that affect the salinity of different oceans and seas are known as controlling factors of oceanic salinity. These factors include evaporation, precipitation, influx of river water, prevailing winds, ocean currents, and sea waves.

3. What is the relationship between evaporation and salinity?
a) Direct positive relationship
b) Direct negative relationship
c) Inverse positive relationship
d) Inverse negative relationship

Explanation: There is a direct positive relationship between the rate of evaporation and salinity. This means that greater the rate of evaporation, the higher the salinity, and vice versa. Evaporation leads to higher salinity due to the concentration of salt in water.

4. How does precipitation affect salinity?
a) It has no effect on salinity
b) It decreases salinity
c) It increases salinity
d) It depends on the amount of precipitation

Explanation: Precipitation is inversely proportional to salinity, meaning that higher rainfall leads to lower salinity and vice versa. Regions with high rainfall, such as equatorial regions, tend to have lower salinity compared to regions with low rainfall, like subtropical high-pressure belts.

5. What is the primary source of oceanic salinity?
a) Volcanic ashes
b) Rivers
c) Evaporation
d) Sea waves

Explanation: The primary source of oceanic salinity is land. Rivers bring salts in solution form from the continental areas into the oceans. Volcanic ashes are also a significant source of oceanic salinity.

6. How do ocean currents affect the distribution of salinity?
a) They have no effect on salinity
b) They increase salinity in all areas
c) They decrease salinity along western coasts and increase it along eastern coasts
d) They decrease salinity along eastern coasts and increase it along western coasts

Explanation: Ocean currents affect the spatial distribution of salinity by mixing seawaters. Warm equatorial currents drive away salts from western coastal areas and accumulate them along eastern coastal areas, leading to higher salinity. Currents have the least influence on enclosed and marginal seas.

7. What is the composition of seawater?
a) Only sodium chloride (NaCl)
b) A composite solution of various mineral substances
c) Mainly magnesium chloride (MgCl2) and magnesium sulphate (MgSO4)
d) Mostly calcium sulphate (CaSO4) and calcium carbonate (CaCO3)

Explanation: Seawater contains a composite solution of various mineral substances in a dilute form. The major salts in seawater include sodium chloride (NaCl), magnesium chloride (MgCl2), magnesium sulphate (MgSO4), calcium sulphate (CaSO4), potassium sulphate (K2SO4), calcium carbonate (CaCO3), and magnesium bromide (MgBr2).

8. How does salinity vary with latitude?
a) Salinity decreases from the equator towards the poles
b) Salinity increases from the equator towards the poles
c) Salinity is highest near the equator and lowest at the poles
d) Salinity is constant at all latitudes

Explanation: Salinity generally decreases from the equator towards the poles. However, higher salinity is seldom recorded near the equator. The highest salinity is usually found at 20-40 degrees north latitude, while low salinity is observed at 40-60 degrees in both hemispheres.

9. Which oceans have salinity above the normal range?
a) Atlantic Ocean, Indian Ocean, and Arctic Ocean
b) Red Sea, Persian Gulf, and Mediterranean Sea
c) North Pacific Ocean, South Pacific Ocean, and Southern Ocean
d) Caribbean Sea, Gulf of Mexico, and Gulf of California

Explanation: The Red Sea, Persian Gulf, and Mediterranean Sea have salinity above the normal range. Red Sea has a salinity range of 34-41 0/00, Persian Gulf has 37-38 0/00, and Mediterranean Sea has 37-39 0/00.

10. Which factor mainly controls the salinity of partially enclosed seas in higher latitudes?
a) Latitude
b) Melt-water influx
c) Ocean currents
d) Evaporation

Explanation: The salinity of partially enclosed seas in higher latitudes is mainly controlled by the influx of melt-water. This means that the amount of freshwater entering these seas from melting ice and snow dictates their salinity levels.

Brief Summary | UPSC – IAS

Salinity is the measure of the amount of dissolved salts in water and affects various properties of water and the types of organisms that can live in it. The primary source of oceanic salinity is the land, as rivers bring salts from the continental areas. The factors that control salinity include evaporation, precipitation, influx of river water, prevailing winds, ocean currents, and sea waves. Evaporation and precipitation have an inverse relationship with salinity, while the influx of river water reduces salinity at the mouth of rivers. Atmospheric pressure, wind direction, and oceanic currents also affect salinity. Salinity varies horizontally with latitude and regionally within individual oceans.

“The Difference Between Corrosion and Corrasion Explained”

Understanding the Difference between Corrosion and Corrasion

As a teacher, it is essential to provide comprehensive knowledge to your students. Today, let’s explore the difference between two terms that may appear similar but have distinct meanings and implications – corrosion and corrasion.

difference between corrosion and corrasion
Image Source: geographystudy.com

Difference between Corrosion and Corrasion

Corrosion and corrasion are distinct processes that affect materials and structures differently.

Corrosion

Corrosion refers to the gradual destruction of materials through chemical or electrochemical reactions with their environment. It is a common phenomenon observed in various substances.

There are several ways to prevent or mitigate corrosion, including the use of protective coatings, cathodic protection, corrosion inhibitors, and appropriate material selection and design.

Corrosion can occur in different forms, such as uniform corrosion, pitting corrosion, crevice corrosion, galvanic corrosion, and stress corrosion cracking. Each form has its own characteristics and effects on materials.

Examples of Corrosion

An interesting example of corrosion is the rusting of iron, which occurs when iron reacts with oxygen and water. The reddish-brown substance called rust is the result of this corrosive process.

Corrasion

  • Corrasion is a geological and geomorphological process that involves the erosion of the earth’s surface due to the friction caused by particles transported by water, wind, ice, or gravity.
  • Corrasion plays a significant role in shaping various landforms, including valleys, canyons, and cliffs by removing rocks and soil from their original locations.
  • Moreover, corrasion can impact the stability and integrity of both natural and man-made structures in the affected areas.

Significance of Understanding Corrosion and Corrasion

Gaining knowledge about corrosion and corrasion is crucial for several reasons, including:

  • Preserving and maintaining the integrity of materials and structures.
  • Ensuring the safety and longevity of infrastructure.
  • Avoiding financial losses caused by material degradation and replacement.
  • Developing strategies to combat or mitigate the effects of corrosion and corrasion.
  • Contributing to advancements in material science and engineering.

Effects and Consequences

The effects of corrosion and corrasion can have significant impacts on our surroundings and daily lives. Some notable effects include:

  • Reduced structural integrity of buildings, bridges, and other infrastructure.
  • Inefficiency and malfunctioning of machinery and equipment.
  • Decreased lifespan of vehicles and appliances.
  • Harmful environmental consequences due to the release of corroded or eroded materials.
  • Increase in maintenance and repair costs.

Pros and Cons

While corrosion and corrasion have negative implications, it is important to note that there can also be positive aspects:

Corrosion

Pros:

  • Natural occurrence in some processes, such as the rusting of iron.
  • Allows for the transformation and recycling of materials.
  • Serves as a basis for electrolysis and other important chemical reactions.

Cons:

  • Destruction and degradation of materials.
  • Costly repairs and maintenance.
  • Environmental pollution.

Corrasion

Pros:

  • Shapes and forms various landforms, contributing to the diversity of our planet.
  • Allows for the formation of natural resources, such as sedimentary rocks.

Cons:

  • Erosion of valuable soil.
  • Compromised stability of structures and landscapes.
  • Potential for landslides and geological hazards.

Fun Fact

Did you know that the Great Barrier Reef, one of the world’s most spectacular natural wonders, is threatened by both corrosion and corrasion? The reef experiences coral bleaching due to changes in water quality (corrosion), and its structure is eroded by waves and currents (corrasion). This emphasizes the importance of understanding and addressing these processes to protect the fragile ecosystem.

In conclusion, corrosion and corrasion may sound similar, but they have distinct meanings and implications. By comprehending these phenomena, we can make informed decisions to prevent damage, ensure safety, and preserve our environment.

Mutiple Choice Questions

1. What is the definition of corrosion?
A) The erosion of the earth’s surface by particles transported by water, wind, ice, or gravity.
B) The gradual destruction of materials by chemical or electrochemical reactions with their environment.
C) The shape and formation of various landforms through erosion.
D) The impact on stability and integrity of natural and man-made structures.

Explanation: Corrosion refers to the gradual destruction of materials due to chemical or electrochemical reactions with the environment.

2. How can corrosion be prevented or mitigated?
A) Using protective coatings, cathodic protection, corrosion inhibitors, and proper material selection and design.
B) Shape and formation of various landforms through erosion.
C) Impact on stability and integrity of natural and man-made structures.
D) Erosion of the earth’s surface by particles transported by water, wind, ice, or gravity.

Explanation: Corrosion can be prevented or mitigated by adopting measures such as using protective coatings, cathodic protection, corrosion inhibitors, and making appropriate material selections and designs.

3. What is an example of corrosion?
A) Erosion of the earth’s surface by particles transported by water, wind, ice, or gravity.
B) The gradual destruction of materials by chemical or electrochemical reactions with their environment.
C) The shape and formation of various landforms through erosion.
D) Impact on stability and integrity of natural and man-made structures.

Explanation: Rusting of iron is an example of corrosion, where the metal undergoes a chemical reaction with oxygen and water, leading to its gradual destruction.

4. What is the definition of corrasion?
A) The erosion of the earth’s surface by particles transported by water, wind, ice, or gravity.
B) The gradual destruction of materials by chemical or electrochemical reactions with their environment.
C) The shape and formation of various landforms through erosion.
D) The impact on stability and integrity of natural and man-made structures.

Explanation: Corrasion refers to a geological and geomorphological process that involves the erosion of the earth’s surface by the friction of particles transported by water, wind, ice, or gravity.

5. How does corrasion impact the environment?
A) The erosion of the earth’s surface by particles transported by water, wind, ice, or gravity.
B) The gradual destruction of materials by chemical or electrochemical reactions with their environment.
C) The shape and formation of various landforms through erosion.
D) The impact on stability and integrity of natural and man-made structures.

Explanation: Corrasion can shape various landforms, such as valleys, canyons, and cliffs, by removing rocks and soil. It can also impact the stability and integrity of natural and man-made structures in the affected areas.

Brief Summary | UPSC – IAS

Corrosion and corrasion are two different processes that affect materials and structures. Corrosion is the gradual destruction of materials through chemical or electrochemical reactions with the environment. It can be prevented or mitigated through various methods. Examples include rusting of iron. On the other hand, corrasion is a geological process that involves the erosion of the earth’s surface through the friction of particles transported by water, wind, ice, or gravity. It shapes landforms and can impact the stability and integrity of structures.

“Difference Between Anticline and Syncline: Geological Folds in Earth’s Crust”

Understanding the Difference Between Anticline and Syncline

Anticlines and synclines are two fundamental geological structures commonly found in folded rock layers within the Earth’s crust. They are essential components of structural geology and provide valuable information about the history of rock deformation.

Difference Between Anticline and Syncline

What is Anticline?

  • An anticline is a type of geological fold where rock layers or strata are folded into an arch or convex shape, resembling an upside-down “U” or a hill. The oldest rock layers are typically found in the center of the fold, while the younger layers are on the outer edges.
  • Anticlines are often associated with compressional forces within the Earth’s crust, typically resulting from tectonic plate movements.
  • These structures are important because they can trap and accumulate hydrocarbons (such as oil and gas) due to their upward-arching shape, forming potential reservoirs for these resources.

What is Syncline?

  • A syncline is the adversary of an anticline. It’s a geological fold where rock layers are folded into a concave shape, resembling a “U” or a trough. In synclines, the youngest rock layers are usually in the center, while the older layers are found on the outer parts of the fold.
  • Synclines often form in response to tectonic forces that result in stretching or extension of the Earth’s crust. These forces can cause rocks to bend downward and create synclinal structures.
  • In contrast to anticlines, synclines are less likely to trap hydrocarbons, as they tend to have a more downward-facing structure.

What is Monocline?

A monocline is a type of geological fold or flexure in the Earth’s crust characterized by a single, steeply inclined set of rock layers or strata.

Unlike anticlines and synclines, which involve bending in both horizontal and vertical directions, monoclines primarily exhibit a simple, one-sided incline or dip in the rock layers.

Monoclines are often associated with regional tectonic forces and can be significant features in structural geology.

Key Characteristics of a Monocline:

  1. Steep Inclination: In a monocline, the rock layers are tilted or folded at a relatively steep angle, typically greater than 30 degrees, but it can be even steeper. This tilt is primarily in one direction, creating a step-like appearance in the landscape.
  2. Unidirectional: Unlike anticlines and synclines, which involve folding in both horizontal and vertical directions, monoclines primarily exhibit a single vertical or near-vertical flexure. This means that the rock layers are tilted along one main axis.
  3. Surface Expression: Monoclines can be seen on the Earth’s surface as topographic features where a relatively flat layer of rock is uplifted and inclined along one side, creating a step or ridge in the landscape. They can also be exposed in canyons, cliffs, or mountain ranges.
  4. Formation: Monoclines typically form in response to tectonic forces and stress within the Earth’s crust. These forces can cause the crust to bend and uplift, leading to the creation of monoclines.

Monoclines are essential in understanding the structural geology of a region and can have various geological implications, such as the potential for the localization of mineral deposits or the influence on groundwater flow patterns. They are also of interest to geologists and researchers studying the Earth’s history and the processes that shape its surface.

Fun Fact: The term “anticline” comes from the Greek words “anti,” meaning “opposite” or “against,” and “klinein,” meaning “to bend.” In contrast, the term “syncline” comes from the Greek words “syn,” meaning “together,” and “klinein,” meaning “to bend.”

Significance of Anticlines and Synclines in Geology

Anticlines and synclines play a crucial role in understanding the geological history of an area. They provide valuable information about the forces that have shaped the Earth’s crust and help geologists determine the sequence of rock layers in folded mountain belts or sedimentary basins. Understanding the characteristics and formation processes of these structures

Mutiple Choice Questions

1. What is an anticline?
a) A type of geological fold where rock layers are folded into a concave shape.
b) A type of geological fold where rock layers are folded into an arch or convex shape.
c) A single, steeply inclined set of rock layers or strata.
d) A type of geological fold where rock layers are gently inclined in one direction.

Explanation: An anticline is a type of geological fold where rock layers are folded into an arch or convex shape, resembling an upside-down “U” or a hill. The oldest rock layers are typically found in the center of the fold, while the younger layers are on the outer edges.

2. What is the main characteristic of an anticline?
a) It is associated with compressional forces within the Earth’s crust.
b) It is the adversary of a syncline.
c) It tends to trap and accumulate hydrocarbons.
d) It is less likely to trap hydrocarbons.

Explanation: The main characteristic of an anticline is that it is associated with compressional forces within the Earth’s crust, typically resulting from tectonic plate movements.

3. What is a syncline?
a) A type of geological fold where rock layers are folded into an arch or convex shape.
b) A type of geological fold where rock layers are folded into a concave shape.
c) A single, steeply inclined set of rock layers or strata.
d) A type of geological fold where rock layers are gently inclined in one direction.

Explanation: A syncline is a geological fold where rock layers are folded into a concave shape, resembling a “U” or a trough. In synclines, the youngest rock layers are usually in the center, while the older layers are found on the outer parts of the fold.

4. What is the main characteristic of a syncline?
a) It is associated with compressional forces within the Earth’s crust.
b) It is the adversary of an anticline.
c) It tends to trap and accumulate hydrocarbons.
d) It is less likely to trap hydrocarbons.

Explanation: The main characteristic of a syncline is that it is the adversary of an anticline. It forms in response to tectonic forces that result in the stretching or extension of the Earth’s crust, causing rocks to bend downward and create synclinal structures.

5. What is a monocline?
a) A type of geological fold where rock layers are folded into an arch or convex shape.
b) A type of geological fold where rock layers are folded into a concave shape.
c) A single, steeply inclined set of rock layers or strata.
d) A simple, one-sided incline or dip in the rock layers.

Explanation: A monocline is a type of geological fold or flexure characterized by a single, steeply inclined set of rock layers or strata. It primarily exhibits a simple, one-sided incline or dip in the rock layers.

6. What is the main characteristic of a monocline?
a) Steep inclination
b) Folding in both horizontal and vertical directions
c) Formation from compressional forces within the Earth’s crust
d) Localization of mineral deposits

Explanation: The main characteristic of a monocline is its steep inclination. The rock layers are tilted or folded at a relatively steep angle, typically greater than 30 degrees, creating a step-like appearance in the landscape.

7. What can monoclines tell us about a region?
a) The potential for the localization of mineral deposits
b) The history of rock deformation
c) The influence on groundwater flow patterns
d) The processes that shape the Earth’s surface

Explanation: Monoclines are essential in understanding the structural geology of a region and can have various geological implications, such as the potential for the localization of mineral deposits or the influence on groundwater flow patterns. They also help researchers study the Earth’s history and the processes that shape its surface.

Brief Summary | UPSC – IAS

Anticlines and synclines are geological structures found in folded rock layers. Anticlines are arch-shaped folds with older rock layers in the center and are often associated with compressional forces. They can trap hydrocarbons and form reservoirs. Synclines are concave folds with younger rock layers in the center, formed by stretching forces. They are less likely to trap hydrocarbons. Monoclines are steeply inclined folds with a single direction of tilt and are formed by tectonic forces. They can be important for understanding structural geology, mineral deposits, and groundwater flow patterns.

“Factors Influencing Industrial Location Decisions: A Comprehensive Analysis”

Factors Affecting Industrial Location Decisions

Industrial location decisions are critical for businesses as they determine the optimal location for their facilities. The choice of location can significantly impact the company’s efficiency, cost-effectiveness, and overall success. Various factors influence industrial location decisions, and understanding them is crucial for companies and policymakers alike.

Significance of Industrial Location Decisions

Choosing the right industrial location is essential for several reasons:

  1. Cost Reduction: A strategically chosen location can help minimize transportation costs, reduce supply chain expenses, and improve operational efficiency.
  2. Market Access: Proximity to consumers and markets ensures easy access to target customers and enables quick response to their demands.
  3. Labor Availability: An appropriate location can provide access to a skilled and unskilled labor force, ensuring smooth production processes.
  4. Government Incentives: Governments often offer incentives, tax breaks, and subsidies to attract businesses. Choosing a location that offers such benefits can lead to cost savings.
  5. Resource Optimization: Strategic industrial location decisions help optimize the use of resources, such as raw materials, energy, and utilities.

Features Affecting Industrial Location

Several features influence industrial location decisions:

  1. Proximity to Raw Materials: Industries that rely on specific raw materials, such as mining or agriculture, often locate close to their sources to minimize transportation costs.
  2. Transportation and Infrastructure: Access to transportation networks, including roads, highways, railways, ports, and airports, is crucial for efficient movement of goods and employees.
  3. Labor Supply: Availability of skilled and unskilled labor is a significant factor as industries require a suitable workforce for production.
  4. Market Access: The proximity to consumers and markets is essential for industries focused on serving local or regional markets.
  5. Energy Supply: Reliable and cost-effective access to energy sources, such as electricity and natural gas, is critical for many industrial processes.
  6. Government Policies and Incentives: Government regulations, tax incentives, and subsidies can influence industrial location decisions.
  7. Land and Real Estate Costs: The cost of land and industrial real estate can significantly impact the location choice.
  8. Environmental Regulations: Environmental considerations, such as emissions restrictions, waste disposal regulations, and sustainability goals, play a role in location decisions.
  9. Infrastructure and Utility Costs: Access to water, wastewater treatment, and other utilities can affect the feasibility of industrial operations.
  10. Proximity to Suppliers and Customers: Being close to suppliers and customers can reduce lead times and transportation costs.
  11. Political Stability: A stable political environment is important for long-term investments and operations.
  12. Quality of Life: Factors like the availability of education, healthcare, and cultural amenities can influence the ability to attract and retain a skilled workforce.
  13. Clusters and Industry Agglomeration: Many industries cluster together in specific regions to take advantage of a shared labor pool, suppliers, and knowledge spillovers.
  14. Regulatory and Compliance Considerations: Industries with specific regulatory requirements may need to consider proximity to regulatory agencies.
  15. Risk and Resilience: Industrial facilities consider factors like natural disaster risk, climate resilience, and supply chain vulnerabilities in their location decisions.
  16. Economic Incentives: Governments may offer tax breaks, grants, or other incentives to attract businesses to a particular area.
  17. Access to Research and Development: Industries requiring innovation often locate near universities, research centers, or innovation hubs.
  18. Regional Economic Conditions: The local business environment and economic stability of a region can influence location choices.
  19. Transportation Costs: The cost of transporting raw materials and finished products is a significant factor for some industries.
  20. Regulatory Environment: Industries may consider the ease of complying with local, state, and national regulations when choosing a location.

Objectives and Effects of Industrial Location Decisions

The objectives of industrial location decisions include:

  • Optimizing operational efficiency
  • Reducing costs
  • Improving market access and customer responsiveness
  • Ensuring access to skilled labor
  • Complying with regulatory requirements

Industrial location decisions have several effects:

  • Economic Growth: Strategic industrial locations contribute to regional and national economic growth.
  • Employment Opportunities: Industrial facilities create job opportunities for the local population.
  • Infrastructure Development: Industrial locations drive the development of transportation networks, utilities, and other infrastructure.
  • Trade and Supply Chains: Optimal industrial locations facilitate efficient global trade and supply chains.

Pros and Cons of Industrial Location Decisions

Pros:

  • Cost Savings: Well-planned industrial locations can lead to cost savings through reduced transportation expenses and access to government incentives.
  • Efficient Operations: Strategic locations improve operational efficiency, supply chain management, and customer responsiveness.
  • Access to Resources: Proximity to raw materials, labor, and markets ensures easy access to essential resources.
  • Economic Growth: Industrial locations contribute to regional and national economic growth, creating employment opportunities.

Cons:

  • High Initial Investment: Establishing industrial facilities in prime locations often requires substantial upfront investments.
  • Environmental Impact: Industrial activities can have adverse environmental effects if not managed properly.
  • Dependence on Government Support: Reliance on government incentives and policies may introduce uncertainties in the long run.

Fun Fact: Clustering and Industry Agglomerations

Did you know that many industries cluster together in specific regions to benefit from shared resources and knowledge spillovers? These clusters, also known as industry agglomerations, promote collaboration, innovation, and competitiveness within the industry. Silicon Valley, the hub of the technology industry, is a prime example of such a cluster.

In conclusion, industrial location decisions involve considering various factors such as proximity to raw materials, labor availability, market access, infrastructure, government policies, and environmental considerations. By carefully evaluating these factors, companies can make informed decisions that optimize their operations, reduce costs, and contribute to economic growth.

So, the next time you see a factory or industrial facility, remember that its location was chosen based on a careful analysis of numerous factors!

Mutiple Choice Questions

1. Which factor plays a significant role in determining the location of industrial facilities?
a) Proximity to raw materials
b) Access to transportation networks
c) Availability of skilled and unskilled labor
d) All of the above

Explanation: The correct answer is d) All of the above. Proximity to raw materials, access to transportation networks, and availability of skilled and unskilled labor are all common factors that often play a significant role in determining the location of industrial facilities.

2. Why is proximity to raw materials important for some industries?
a) It reduces transportation costs
b) It increases production efficiency
c) It improves market access
d) It ensures political stability

Explanation: The correct answer is a) It reduces transportation costs. Industries that rely on specific raw materials, like mining or agriculture, are often located close to their sources to reduce transportation costs.

3. Which factor is crucial for the efficient movement of goods and employees?
a) Proximity to raw materials
b) Labor supply
c) Transportation and infrastructure
d) Quality of life

Explanation: The correct answer is c) Transportation and infrastructure. Access to transportation networks, including roads, highways, railways, ports, and airports, is crucial for the efficient movement of goods and employees.

4. What is the significance of market access for industrial facilities?
a) It ensures political stability
b) It reduces lead times and transportation costs
c) It improves access to research and development
d) It minimizes environmental regulations

Explanation: The correct answer is b) It reduces lead times and transportation costs. Proximity to consumers and markets is essential for industries focused on serving local or regional markets, as it can reduce lead times and transportation costs.

5. Which factor is critical for many industrial processes?
a) Energy supply
b) Government policies and incentives
c) Land and real estate costs
d) Environmental regulations

Explanation: The correct answer is a) Energy supply. Reliable and cost-effective access to energy sources, such as electricity and natural gas, is critical for many industrial processes.

6. How can government policies and incentives influence industrial location decisions?
a) They can increase transportation costs
b) They can decrease land and real estate costs
c) They can offer tax incentives and subsidies
d) They can restrict access to skilled labor

Explanation: The correct answer is c) They can offer tax incentives and subsidies. Government regulations, tax incentives, and subsidies can influence industrial location decisions by providing economic benefits and incentives for businesses to operate in a particular area.

7. What factor can significantly impact the location choice of industrial facilities?
a) Environmental regulations
b) Land and real estate costs
c) Proximity to suppliers and customers
d) Political stability

Explanation: The correct answer is b) Land and real estate costs. The cost of land and industrial real estate can significantly impact the location choice of industrial facilities.

8. Which factor can affect the feasibility of industrial operations?
a) Proximity to raw materials
b) Government policies and incentives
c) Infrastructure and utility costs
d) Risk and resilience

Explanation: The correct answer is c) Infrastructure and utility costs. Access to water, wastewater treatment, and other utilities can affect the feasibility of industrial operations.

9. What role does political stability play in industrial location decisions?
a) It ensures access to research and development
b) It reduces transportation costs
c) It minimizes environmental regulations
d) It provides a stable environment for long-term investments and operations

Explanation: The correct answer is d) It provides a stable environment for long-term investments and operations. A stable political environment is important for industrial facilities as it provides a favorable and predictable environment for long-term investments and operations.

10. Which factor can influence the ability to attract and retain a skilled workforce?
a) Quality of life
b) Clusters and industry agglomeration
c) Regulatory and compliance considerations
d) Economic incentives

Explanation: The correct answer is a) Quality of life. Factors like the availability of education, healthcare, and cultural amenities can influence the ability to attract and retain a skilled workforce.

11. Why do many industries cluster together in specific regions?
a) To reduce transportation costs
b) To increase production efficiency
c) To take advantage of shared resources and knowledge spillovers
d) To minimize environmental regulations

Explanation: The correct answer is c) To take advantage of shared resources and knowledge spillovers. Many industries cluster together in specific regions to take advantage of a shared labor pool, suppliers, and knowledge spillovers, which can lead to increased efficiency and innovation.

12. What should industries with specific regulatory requirements consider when choosing a location?
a) Proximity to raw materials
b) Risk and resilience
c) Economic incentives
d) Proximity to regulatory agencies

Explanation: The correct answer is d) Proximity to regulatory agencies. Industries with specific regulatory requirements, such as pharmaceuticals or aerospace, may need to consider proximity to regulatory agencies to ensure compliance with regulations.

13. What factors should industrial facilities consider in terms of risk and resilience?
a) Proximity to raw materials
b) Access to research and development
c) Risk of natural disasters and climate resilience
d) Transportation costs

Explanation: The correct answer is c) Risk of natural disasters and climate resilience. Industrial facilities should consider factors like natural disaster risk, climate resilience, and supply chain vulnerabilities in their location decisions to ensure their operations are not significantly affected by external risks.

14. What incentives can governments offer to attract businesses to a particular area?
a) Tax breaks, grants, or other incentives
b) Access to transportation networks
c) Availability of skilled labor
d) Quality of life amenities

Explanation: The correct answer is a) Tax breaks, grants, or other incentives. Governments may offer tax breaks, grants, or other incentives to attract businesses to a particular area and promote economic development.

15. Where might industries requiring innovation and research facilities locate?
a) Near transportation networks
b) Near universities, research centers, or innovation hubs
c) In regions with low land and real estate costs
d) Near suppliers and customers

Explanation: The correct answer is b) Near universities, research centers, or innovation hubs. Industries that require innovation and research facilities may locate near universities, research centers, or innovation hubs to facilitate collaboration and access to research resources.

16. How can regional economic conditions influence industrial location choices?
a) They can increase transportation costs
b) They can decrease the availability of skilled labor
c) They can affect the local business environment and economic stability
d) They can minimize regulatory and compliance considerations

Explanation: The correct answer is c) They can affect the local business environment and economic stability. Regional economic conditions, including the local business environment and economic stability, can influence industrial location choices by affecting the overall economic viability and competitiveness of a region.

17. What factor is significant for industries that rely on transporting raw materials and finished products?
a) Proximity to raw materials
b) Access to research and development
c) Quality of life
d) Transportation costs

Explanation: The correct answer is d) Transportation costs. The cost of transporting raw materials to the facility and finished products to the market is a significant factor for industries that rely on transportation.

18. Why is the regulatory environment important for some industries?
a) It reduces transportation costs
b) It ensures energy supply
c) It influences the ease of complying with regulations
d) It minimizes land and real estate costs

Explanation: The correct answer is c) It influences the ease of complying with regulations. Industries may consider the ease of complying with local, state, and national regulations when choosing a location to minimize the regulatory burden on their operations.

Overall Explanation: Industrial location decisions are complex and involve a combination of factors such as proximity to raw materials, transportation and infrastructure, labor supply, market access, energy supply, government policies and incentives, land and real estate costs, environmental regulations, infrastructure and utility costs, proximity to suppliers and customers, political stability, quality of life, clusters and industry agglomeration, regulatory and compliance considerations, risk and resilience, economic incentives, access to research and development, regional economic conditions, transportation costs, and the regulatory environment. Companies often conduct comprehensive site selection studies to evaluate the suitability of potential locations based on these and other criteria in order to optimize their operations and reduce costs.

Brief Summary | UPSC – IAS

Industrial location decisions are influenced by a variety of factors including proximity to raw materials, transportation and infrastructure, labor supply, market access, energy supply, government policies, land and real estate costs, environmental regulations, infrastructure and utility costs, proximity to suppliers and customers, political stability, quality of life, industry clusters, regulatory and compliance considerations, risk and resilience, economic incentives, access to research and development, regional economic conditions, and transportation costs. Companies often conduct site selection studies to evaluate potential locations based on these factors to optimize their operations and reduce costs.

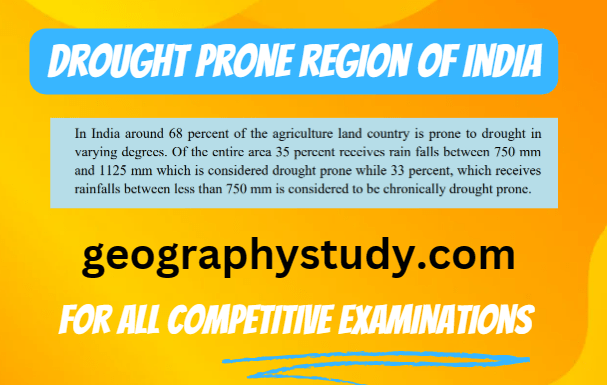
“Indian Railway Zones: 18 Divisions Managing Vast Network”

how many railway zones of India

The Indian Railways: An Overview of the 18 Railway Zones

The Indian Railways is one of the largest railway networks in the world, connecting millions of people and transporting goods across the country. To efficiently manage and operate this vast network, the Indian Railways is divided into 18 railway zones. Each zone has its own administrative and operational responsibilities, ensuring smooth functioning of the railways within their respective regions. Let’s take a closer look at these 18 Indian Railways zones.

1. Northern Railway (NR)

As the name suggests, Northern Railway covers the northern regions of India, including states like Jammu & Kashmir, Punjab, Haryana, Uttar Pradesh, and parts of Rajasthan. Its headquarter is located in New Delhi.

2. North Eastern Railway (NER)

The North Eastern Railway zone serves the north-eastern states of India, including Bihar, Uttar Pradesh, Uttarakhand, and parts of Madhya Pradesh. Its headquarter is located in Gorakhpur.

3. Northeast Frontier Railway (NFR)

Covering the easternmost part of India, the Northeast Frontier Railway zone extends to the northeastern states of Assam, Arunachal Pradesh, Nagaland, Manipur, Mizoram, Tripura, and parts of Bihar and West Bengal. Its headquarter is located in Guwahati.

4. Eastern Railway (ER)

Eastern Railway zone covers the eastern parts of India, including West Bengal, Bihar, and Jharkhand. Its headquarter is located in Kolkata.

5. South Eastern Railway (SER)

The South Eastern Railway zone serves the southeastern regions of India, including West Bengal, Jharkhand, and parts of Odisha. Its headquarter is located in Kolkata.

6. South Central Railway (SCR)

South Central Railway zone covers the central and southern parts of India, including Andhra Pradesh, Telangana, Maharashtra, and parts of Karnataka and Tamil Nadu. Its headquarter is located in Secunderabad.

7. Southern Railway (SR)

Southern Railway zone extends to the southern states of India, including Tamil Nadu, Kerala, Puducherry, and parts of Andhra Pradesh and Karnataka. Its headquarter is located in Chennai.

8. Central Railway (CR)

Central Railway zone covers the central parts of India, including Maharashtra and parts of Madhya Pradesh and Karnataka. Its headquarter is located in Mumbai.

9. Western Railway (WR)

Western Railway zone serves the western regions of India, including Maharashtra, Gujarat, and parts of Rajasthan and Madhya Pradesh. Its headquarter is located in Mumbai.

10. South Western Railway (SWR)

The South Western Railway zone covers the southwestern parts of India, including Karnataka and parts of Maharashtra and Tamil Nadu. Its headquarter is located in Hubballi.

11. North Western Railway (NWR)

North Western Railway zone serves the northwestern regions of India, including Rajasthan, Punjab, and parts of Gujarat and Haryana. Its headquarter is located in Jaipur.

12. West Central Railway (WCR)

West Central Railway zone covers the central parts of India, including Madhya Pradesh and parts of Rajasthan and Maharashtra. Its headquarter is located in Jabalpur.

13. North Central Railway (NCR)

North Central Railway zone serves the central regions of India, including parts of Uttar Pradesh and Madhya Pradesh. Its headquarter is located in Prayagraj (formerly Allahabad).

14. East Central Railway (ECR)

East Central Railway zone covers the eastern and central parts of India, including Bihar and parts of Jharkhand and Uttar Pradesh. Its headquarter is located in Hajipur.

15. South East Central Railway (SECR)

The South East Central Railway zone serves the southeastern regions of India, including parts of Chhattisgarh, Odisha, and Maharashtra. Its headquarter is located in Bilaspur.

16. East Coast Railway (ECoR)

East Coast Railway zone covers the eastern coastal regions of India, including Odisha and parts of Andhra Pradesh. Its headquarter is located in Bhubaneswar.

17. Konkan Railway (KR)

The Konkan Railway is a separate entity from the Indian Railways. It covers the Konkan region of Maharashtra, including areas like Mumbai, Goa, and Mangalore.

18. Metro Railway, Kolkata

Metro Railway in Kolkata is another separate entity that operates the metro rail system in the city.

The significance of dividing the Indian Railways into zones is to ensure better management, efficient operations, and focused development of each region. It allows for a decentralized approach in decision-making, resource allocation, and service delivery.

Some of the key features of these railway zones include:

  • Headquarters: Each zone has its own administrative headquarters, which serve as the central control and coordination centers for that particular zone.
  • Divisional Offices: Within each zone, there are divisional offices responsible for managing and operating the railways at a more local level.
  • Railway Infrastructure: The zones are responsible for the maintenance, expansion, and development of railway tracks, stations, signaling systems, and other infrastructure within their respective regions.
  • Train Operations: The zones manage the scheduling, routing, and operation of trains within their regions, ensuring smooth movement of passengers and freight.

The objectives of having multiple railway zones in India are:

  • Efficient Management: Dividing the Indian Railways into zones allows for better management and coordination of resources, services, and operations.
  • Focused Development: Each zone can focus on the specific needs and requirements of its region, leading to targeted development and improvement.
  • Effective Administration: The zonal structure enables effective administration and decision-making at the local level, leading to quicker responses and solutions to problems.
  • Regional Connectivity: Railway zones contribute to better connectivity within their regions, enabling easier travel and transportation for people and goods.

The division of the Indian Railways into zones has had several effects:

  • Improved Operations: The zonal structure has led to improved operations, better utilization of resources, and increased efficiency in the Indian Railways.
  • Regional Development: Each zone has been able to focus on the specific needs and development of its region, resulting in improved infrastructure and services.
  • Employment Generation: The railway zones have created employment opportunities in various regions, contributing to local economic growth.
  • Connectivity and Mobility: Dividing the Indian Railways into zones has enhanced connectivity and mobility, making travel and transportation more accessible and convenient for people.

While the division of the Indian Railways into zones has several advantages, there are also some potential disadvantages or challenges. These may include:

  • Coordination Issues: With multiple zones, coordination between them and the central authority can sometimes be challenging, leading to delays or inefficiencies.
  • Inter-zonal Disparities: There may be variations in development and services across different zones, creating inequalities in access and facilities for passengers.
  • Infrastructure Maintenance: In some cases, maintenance and infrastructure development may be neglected or delayed due to resource constraints or administrative issues.

Fun Fact: Did you know that the Indian Railways operates the longest railway line in the world? The Vivek Express, running from Dibrugarh in Assam to Kanyakumari in Tamil Nadu, covers a distance of over 4,263 kilometers!

In conclusion, the 18 railway zones of the Indian Railways play a crucial role in managing and operating the vast railway network across India. They ensure efficient administration, focused development, and improved connectivity within their respective regions. While there are some challenges associated with the zonal structure, the overall impact of dividing the Indian Railways into zones has been positive, leading to enhanced services, development, and mobility for millions of people.

Sources:

For more information, you can visit the official website of the Indian Railways at indianrailways.gov.in.

how many railway zones of India
Image Source: geographystudy.com

Mutiple Choice Questions

1. How many railway zones are there in India?
a) 12
b) 15
c) 18
d) 21

Explanation: According to the provided information, there are 18 railway zones in India.

2. Which is the largest railway network in the world?
a) Indian Railways
b) Chinese Railways
c) Russian Railways
d) American Railways

Explanation: The Indian Railways is mentioned as one of the largest railway networks in the world.

3. Which zone of Indian Railways is responsible for managing the railway infrastructure and services in Kolkata?
a) Northern Railway (NR)
b) Metro Railway, Kolkata
c) Eastern Railway (ER)
d) South Eastern Railway (SER)

Explanation: Metro Railway, Kolkata is mentioned as a separate zone responsible for managing the railway infrastructure and services in Kolkata.

4. Which zone of Indian Railways is responsible for managing the railway infrastructure and services in Mumbai?
a) Western Railway (WR)
b) Central Railway (CR)
c) South Western Railway (SWR)
d) Konkan Railway (KR)

Explanation: Western Railway, according to the provided information, is responsible for managing the railway infrastructure and services in Mumbai.

5. How many zones of Indian Railways have “Central” in their name?
a) 1
b) 2
c) 3
d) 4

Explanation: According to the provided information, there is one zone with “Central” in its name, which is the Central Railway (CR).

6. Which is the southernmost zone of Indian Railways?
a) Southern Railway (SR)
b) South Central Railway (SCR)
c) South Western Railway (SWR)
d) South East Central Railway (SECR)

Explanation: Southern Railway is mentioned as the southernmost zone of Indian Railways.

7. Which zone of Indian Railways is responsible for managing the railway infrastructure and services in Delhi?
a) Northern Railway (NR)
b) North Eastern Railway (NER)
c) Northeast Frontier Railway (NFR)
d) East Central Railway (ECR)

Explanation: Northern Railway, according to the provided information, is responsible for managing the railway infrastructure and services in Delhi.

8. Which zone of Indian Railways is responsible for managing the railway infrastructure and services in Chennai?
a) Southern Railway (SR)
b) South Eastern Railway (SER)
c) South Western Railway (SWR)
d) East Coast Railway (ECoR)

Explanation: Southern Railway, according to the provided information, is responsible for managing the railway infrastructure and services in Chennai.

Brief Summary | UPSC – IAS

As of January 2022, there are 18 railway zones in the Indian Railways, which is one of the largest railway networks in the world. Each zone is responsible for managing and operating the railway infrastructure and services within its defined geographical region. The 18 zones include Northern Railway, Eastern Railway, Southern Railway, Western Railway, Central Railway, and others. The Konkan Railway Corporation is a separate entity from the Indian Railways. For more information, visit the Indian Railways’ official website.

Types of Clouds and their Origin | UPSC – IAS

Hydrological cycle in detail description | UPSC

Types of clouds and their characteristics upsc

Types of Clouds and their Origin | UPSC – IAS

We all know the sky can be full of water. But most of the time we can’t witness the water. The drops of water are too small to see. Clouds are visible accumulations of water droplets or solid ice crystals that float in the Earth’s troposphere moving with the wind. From space, clouds are visible as a white blanket surrounding the planet. So in this session we are going to discuss the origin, types and also importance of clouds.

Origin of clouds | UPSC – IAS

  • As defined by the World Meteorological Organization (WMO), it’s primarily “a hydrometeor consisting of a visible aggregate of minute particles of liquid water or ice, or both, suspended in the free air and usually not touching the Earth’s surface.” Thus, clouds are the visible sign of ongoing atmospheric processes and as such they are a useful diagnostic tool.
  • Clouds are made of tiny drops of water or ice crystals that settle on dust particles in the atmosphere. The droplets are so small – i.e., a diameter of about a hundredth of a millimeter – in which each cubic meter of air contain 100 million droplets.

Formation of clouds | UPSC – IAS

  • Clouds form when the invisible water vapor in the air condenses into visible water droplets or ice crystals. There is water around us all the time in the form of tiny gas particles, also known as water vapor. There are some tiny particles floating around in the air – such as salt and dust – these are called aerosols.
  • The water vapor and the aerosols are constantly bumping into each other. When the air is cooled, some of the water vapor sticks to the aerosols when they collide – this is like condensation. Eventually, bigger water droplets form around the aerosol particles, and these water droplets start sticking together with other droplets, forming clouds.
  • The warmer the air is, the more water vapor it can hold. Clouds are usually produced through condensation – as the air rises, it will cool and reduced temperature of the air, decreases its ability to hold water vapor so that condensation occurs. The height at which dew point is reached and clouds are formed that point is called as condensation level.

Required elements for cloud formation

Clouds consist of many tiny droplets resulting from the condensation of water vapor (gaseous state) into liquid water or ice (solid state). They form when the air is cooled to its dew point. This is considered its condensation or saturation point.

  • The first requirement for cloud formation is moisture. This moisture is constantly recycled through the earth-atmosphere system by means of the hydrologic cycle. Moisture in this cycle exists normally in the 3 states of water: solid, liquid, and vapor.
  • The primary way to cool the atmosphere is through upward vertical motion or lifting of air. Thus the second requirement for cloud formation is a source of lift, through the following processes:

Fronts associated with low pressure systems Orographic or mountain barriers

  • Convection
  • Convergence (forced coming together of airflow)

While vertical motion is the primary method of cooling that leads to cloud formation, there are two other atmospheric cooling processes. These processes are advection and radiation, and they can lead to cooling of the lower layers of the atmosphere.

  • Advection refers to the horizontal movement of air or moisture across the earth’s surface. For example, if mild moist air moves (advects) over a snow pack or other cold surface (land or water), the air may be cooled to its saturation point from below. This may lead to fog formation.
  • Radiational cooling can also cool the lower layers of the atmosphere on clear, calm and dry nights. As the earth’s surface cools, it will cool the air in contact with it. This air may be cooled to its saturation point resulting in the formation of late night or early morning fog or ground fog. This type of fog occurs frequently in river valleys.

Thus, moisture and lift are required for cloud formation. This lift must cool the atmosphere sufficiently so it approaches its dew point or saturation point.

Types of Clouds | UPSC – IAS

Clouds are an important part of Earth’s weather. There are many kinds of clouds. The meteorologist classifies clouds mainly by their appearance.

 Types of Clouds | UPSC - IAS

After World War II, the World Meteorological Organization published a new International Cloud Atlas (1956) in two volumes. It contains 224 plates, describing 10 main cloud genera (families) subdivided into 14 species based on cloud shape and structure. Nine general varieties, based on transparency and geometric arrangement are also described. The genera, listed according to their height, are as follows:

High clouds: These clouds are high up in the sky, mean heights from 5 to 13 km, or 3 to 8 miles. The important high cloud types are,

  • Cirrus
  • Cirrocumulus
  • Cirrostratus

Middle clouds: Middle clouds are found between low and high clouds, mean heights 2 to 7 km, or 1 to 4 miles. The following are some important middle clouds,

  • Altocumulus
  • Altostratus

Low clouds: Low clouds form closer to Earth’s surface. Low clouds can even touch the ground, mean heights 0 to 2 km, or 0 to 1.2 miles.. These clouds are called as fog. They are,

  • Nimbostratus
  • Stratocumulus
  • Stratus
  • Cumulus
  • Cumulonimbus

Another way the clouds are named is by their shape. Cirrus clouds are high clouds. They look like feathers. Cumulus clouds are middle clouds. These clouds look like giant cotton balls in the sky. Stratus clouds are low clouds. They cover the sky like bed sheets.

  • Heights given are approximate averages for temperate latitudes. Clouds of each genus are generally lower in the Polar Regions and higher in the tropics.

types of clouds in detail overview | UPSC

Four principal classes are recognized when clouds are classified according to the kind of air motions that produce them:

  • Layer clouds formed by the widespread regular ascent of air,
  • Layer clouds formed by widespread irregular stirring or turbulence,
  • Cumuliform clouds formed by penetrative convection, and
  • Orographic clouds formed by the ascent of air over hills and mountains.

So what are the causes for cloud formation?

There are five factors which can lead to air rising, cooling and clouds formation

  • Surface heating – This happens when the ground is heated by the sun which heats the air in contact with it causing it to rise. The rising columns are often called thermals. Surface heating tends to produce cumulus clouds.
  • Topography forcing – The topography – or shape and features of the area – can cause clouds to be formed. When air is forced to rise over a barrier of mountains or hills it cools as it rises. Layered clouds are often produced by this way.
  • Frontal – Clouds are formed when a mass of warm air rises up over a mass of cold, dense air over large areas along fronts. A ‘front’ is the boundary between warm, moist air and cooler, drier air.
  • Convergence – Streams of air flowing from different directions are forced to rise where they flow together, or converge. This can cause cumulus cloud and showery conditions.
  • Turbulence – A sudden change in wind speed with height creating turbulent dynamics in the air.

The range of ways in which clouds can be formed and the variable nature of the atmosphere results in an enormous variety of shapes, sizes and textures of clouds.

Atmospheric processes creating lift and clouds | UPSC – IAS

  • Since cold air (dense) sinks and warm air (less dense) rises, clouds that form in an unstable environment (warm below and cold aloft) tend to be lumpy or globular in appearance. These clouds will resemble bubbles in a pot of boiling water.
  • These are the cumuliform or convective clouds that we are all familiar with and are due to the localized nature of the sudden updrafts and downdrafts of convection.

On the other hand, a stable environment (cold surface and warm aloft) is characterized by a more gradual lifting process resulting in extensive areas of layered or stratiform type clouds. These clouds last longer than those involved in convective processes.

Clouds due to lift by fronts

  • For over three-quarters of the 20th century, the low pressure/cyclone conceptual model developed by the Norwegian School of meteorologists has dominated weather analysis techniques. With the advances in satellite and radar technology, this concept continues to evolve, but the conceptual model still forms the foundation for understanding frontal lift and cloud formation.
  • In the case of a warm front, both the warm advancing air and the cold retreating air are moving in the same direction. As warm air glides up and over cold surface air (warm front), the clouds tend to be layered.
  • In contrast, cold fronts cause more abrupt lifting with more intense localized vertical motion as the cold and warm air masses collide. This generally results in cumuliform clouds with showery conditions as the cold air undercuts and forces the warm air up.

Frontal lift Clouds are generally of the stratiform layered type (stable) when associated with warm fronts. Cold fronts are generally associated with cumuliform clouds (unstable). Thunderstorms are most likely with cold fronts but can accompany warm fronts.

Orographic lift clouds

Air flow perpendicular to a range of hills or mountains is forced to rise up and over the mountains (i.e. the orographic barrier). As the air rises on the windward side of the mountain range (or hills), it cools (expansion) and may eventually reach its saturation point with clouds forming. The reverse is true as the air descends down the leeward side of the mountains. This subsiding air is warmed through compression.

  • Subsiding, warming air can hold more moisture before reaching saturation. As a result, clouds tend to break up to the lee of mountains.

This process frequently happens during a winter snowstorm, with heavy snow along the windward side and lesser amounts to the lee of the mountains. It is referred to as the umbrella or shadowing effect of mountains.

Lift due to convection

  • We are all familiar with the white cotton ball (cumulus) type clouds on a warm summer afternoon. This is the process of convection.
  • The earth’s atmosphere is transparent to incoming solar radiation. Once this radiation hits the ground, it will convert to heat energy. As the ground warms, the air in contact with the ground is also warmed through conduction.
  • As the air is warmed, it becomes less dense, thus it rises (convection). However, as air rises it cools, with clouds ultimately forming over the updraft. The spacing of these up and down drafts results in the observed distribution of cumulus clouds. On the edges of the clouds, cool air sinks to replace the warm air rising, thereby completing the convection cell.

Lift due to Convection results in clouds and may occur in combination with other forms of lift (frontal or orographic) with showers or thunderstorms ultimately developing.

Convergence and lift

Another source of lift, which is really a combination of the above processes, is convergence. When air is forced to converge or come together, it can only go upward (can’t go into the ground). An example would be the air flowing inward toward the center of low pressure which is forced to rise.

Colors of clouds | UPSC – IAS

Before going to cloud color, we must understand why the sky is blue? The rays from the sun have all of the colors in the visible color spectrum in them, so the rays appear to be white. This “white” sunlight passes through the Earth’s atmosphere, and the tiny airborne molecules, such as nitrogen particles, scatter the light from the blue part of the color spectrum. The molecules scatter the blue light until it is evenly distributed. The other colors in the spectrum reach the Earth’s surface with no interference, so their color isn’t distributed throughout the sky. Therefore, the sky appears to be blue.

  • Clouds are white because the water droplets are bigger than the particles that scatter the blue light in the sky. The clouds scatter and reflect all the visible colors of light that strike them. Since the visible colors of the sun appear to be white, the clouds that reflect that light must be white too. So clouds are white because they reflect the white light from the sun.
  • In some cases, if the cloud is super thick or filled with a lot of water molecules; sunlight cannot pass through the cloud. Therefore, clouds can appear very dark because of the lack of sunlight shining through.
  • The white colors of clouds come from the condensed water vapor having a high reflective quality. When all wavelengths of light are reflected back we can see white color. The grey color comes from seeing clouds from beneath. White clouds are white if we notice, on sunny days. This is because we can see the sunlight directly hitting them and see that light almost completely reflected back. On cloudy days most sunlight is blocked by the translucent and refractive quality of cloud cover. This makes clouds appear darker in color as part of the light has been uniformly absorbed.
  • The color of a cloud also depends on the color of the light that illuminates it. When sunlight passes through thick layer of atmosphere and dust particles at sunset, blue color is scattered by Rayleigh scattering and only red-to-orange color remains. The clouds reflect these unscattered red/orange rays and appear in that color. The effect is much like shining a red spotlight on a white sheet.
  • Since the Earth is spherical, the clouds at different heights turn red at different time when the sun crosses the horizon. Just before the sunset, the color of low clouds (e.g. stratus) will turn red first. Shortly after the sunset, the high clouds (e.g. cirrus) would be gradually stained in deep red and become apparent under the darken background. A viewer on the ground can distinguish the clouds at different heights according to the relative timing of their color change during sunset.
  • Clouds at night are visible only when there is a source of light. Thin clouds will generally appear white under the white moonlight. For the bottom of dense low clouds, the main light source is the light from the ground originated from street lamps and other light sources in cities. Such light shines on the cloud aloft and is scattered by the base of a low cloud, making the low cloud appears yellowish orange or white when observed in urban area. The phenomena will be more obvious if the cloud is lower or denser.
  • Finally, clouds have color. Some are white, some are grey, and in special circumstances such as major storms can have weird colors like green or red. This goes back to refraction. Most color that we can see is visible, because our eyes perceive how objects absorb or reflect certain wavelengths of light

Importance of clouds | UPSC – IAS

Clouds are essential to the earth-atmosphere system. Clouds complete the following functions:

  • Clouds help to regulate Earth’s energy balance by reflecting and scattering solar radiation and by absorbing Earth’s infrared energy.
  • They are required for precipitation to occur and, hence are an essential part of the hydrologic cycle.
  • Clouds indicate what type of atmospheric processes are occurring (e.g., cumulus clouds indicate surface heating and atmospheric turbulence).
  • Clouds help to redistribute the extra heat from the equator toward the poles.
  • Clouds are important for many reasons. Rain and snow are two of those reasons. At night, clouds reflect heat and keep the ground warmer. During the day, clouds make shade that can keep us cooler.

Hydrological cycle in detail description | UPSC

Clouds are an important part of our atmosphere and they have a critical role in controlling the amount of the sun’s energy that reaches the earth’s surface. Clouds can have a cooling effect on the atmosphere, which counteract increases in temperature caused by climate change. Understanding exactly how clouds impact on our climate and ensuring that we can accurately model the current role and extent of clouds is critical to determine how any changes in climate will affect clouds and how clouds will affect climate in the future.

  • In order to predict the climate several decades into the future, we need to understand many aspects of the climate system, one being the role of clouds in determining the climate’s sensitivity to change. Clouds affect the climate but changes in the climate, in turn, affect the clouds. This relationship creates a complicated system of climate feedbacks, in which clouds modulate Earth’s radiation and water balances.
  • Clouds are an important part of the water cycle. The water cycle is the movement of water from the Earth into the sky and then back down to Earth again.
  • The sun heats water on the surface of the Earth, and causes it to evaporate. Evaporation is the process when water moves from liquid to vapor form. Water vapor is made up of tiny water droplets in the air. Water can also move into the air through transpiration.
  • The greenhouse effect is not only produced by the greenhouse gases, clouds absorb long wavelength (infrared) radiation from the surface of the Earth and radiate some of it back down. In addition to this absorption and re-radiation of infrared radiation from the Earth’s surface they may simply reflect it back to the surface.
  • Clouds also have a major role in reflecting some of the Sun’s short wavelength (visible light) radiation back into space. Thus clouds share a role with the greenhouse gases and also share a role with the ice and snow fields of the high latitudes.

Conclusion | UPSC – IAS

  • A cloud is a large collection of very tiny droplets of water or ice crystals. The droplets are so small and light that they can float in the air. All air contains water, but near the ground it is usually in the form of an invisible gas called water vapor.
  • When warm air rises, it expands and cools. Cool air can’t hold as much water vapor as warm air, so some of the vapor condenses into tiny pieces of dust that are floating in the air and forms a tiny droplet around each dust particle. When billions of these droplets come together they become a visible cloud.
  • Clouds are important in weather forecasting and also play an important role in hydrological cycle.

Distribution of Salinity, Density and Temperature of Sea Water | UPSC

salinity describe the general distribution of salinity in the oceans UPSC IAS factors affecting salinity of ocean water

salinity describe the general distribution of salinity in the oceans UPSC IAS factors affecting salinity of ocean water

Distribution of Salinity, Density and Temperature of Sea Water | UPSC

The world ocean meaning the combined oceans of the earth, occupying about 71% of the earth’s surface & has a mean depth of about 3800m including shallow seas in addition to the main basins. The round figure of 4000m applies quite well to the average depth of the main portions of the Atlantic, Pacific 7 Indian Oceans. Volume of the world ocean is about 1.4 billion cubic kilometers (1.37×10 to the power of 9 cu km) which constitutes 97.2 % of the world’s free water most of the remaining 2.8% is locked up in glaciers.

Physio-chemical characteristics of seawater

Physical characteristics of sea water-

  • Water is the sole natural compound which exists in 3 statuses in the conditions of temperature & pressure which are found on earth. The liquid state being the most common.
  • Water has high specific heat, linked on the one hand, to the fact that one its constituents hydrogen has the highest specific heat of all the elements & on the other hand to the presence of hydrogen bonds.
  • The freezing of water is accompanied by an increase in volume of about 105 & because of this ice floats on water, freezing splits the partitions of cells in animal or plant & porous.
  • The surface tension of water is the highest of all liquids. This characteristic influences the formation of drops of water as well as waves.
  • The surface water in a liquid state reflects only a small part of luminous radiation & absorbs much solar heat.
  • The transmission of light is unaffected by salinity temperature or pressure. However suspended particle may scatter the light. Is more penetrating & they are subjected to molecular scattering & hence the blue color of the ocean. Different colors of the ocean like green or brownish particularly along coast due to green planktonic species & due to detritus suspended the water.
  • Sound waves propagation is easily affected by factors like salinity, temperature or pressure. The speed of waves increases with increase in salinity, temperature or pressure.

The chemical composition of sea-water

Ocean water contains variety of substances dissolved in water & as suspended particles. The composition of sea water vary from place to place 7 is primarily depends on the abundance of life forms, presence of rivers & other geological & meteorological conditions. Thus different substances are dissolved in sea water. The dissolved substances of seawater is therefore can be into 2 categories namely

Dissolved gases in sea-water

  • The major gases found in sea water in the order of their relative abundances are Nitrogen, Oxygen & Carbon dioxide. Apart from these the presence of hydrogen sulphide gas is significant as it indicate bacterial activity, decay of organic material & stagnation of water.

The mineral constituents of water

  • The sea contains a large number of dissolved compounds & elements. The seawater contains about 10 major elements & at least about 49 minor & trace elements.

The ten major elements of the sea water & their concentrations are listed below.

Elements Cl Na Mg S Ca K Br C Sr B
% 19.35 10.79 1.29 0.88 0.41 0.38 0.06 0.03 0.01 0.005

Most of the dissolved elements in the sea are found in ionic form constituting ionic sea salts. Majority of ionic sea salts result from the following compounds.

Sodium chloride‐NaCl, Magnesium Chloride‐MgCl2, Potassium Sulphate‐MgSO4, Calcium Sulphate‐ CaSO4, Potassium Sulphate‐K2SO4, Magnesium bromide‐MgBr2, & Potassium Chloride‐KCl.

The ocean is a dimensional body & so the distribution of physical properties like salinity, temperature 7 density is represented in a space by the help of coordinates of latitudes & longitudes with the additional factor of depth.

Salinity of Ocean water:

  • Salinity is the total amount of solid material in a kilogram of sea water expressed in parts per thousand. The average salinity of seawater is 3.5% 7 is generally expressed as 35 parts per thousands.

The list of salts & there weight & percentage is given in the table.

Salts Weight (g) %
Sodium Chloride 27.213 77.8
Magnesium Chloride 3.809 10.9
Magnesium Sulphate 1.658 4.7
Calcium Sulphate 1.260 3.6
Potassium Sulphate 0.863 2.5
Calcium Carbonate 0.123 0.3
Magnesium Bromide 0.076 0.2

Change in salinity distribution

  • Salinity changes due to winds resulting from differing in atmospheric pressure. The strong wind blowing throughout the year carry much of the warm & saline water from the western shore of the land in the
  • lower middle latitudes & from the eastern shore in the higher latitudes resulting in changes in salinity distribution. The variations in salinity are according to the nature of the atmosphere i.e. the difference between precipitation 7 evaporation.

Distribution of Sea water | UPSC – IAS

Horizontal distribution

  • Salinity is primarily controlled by latitude, & consequently decreases from the equator towards the pole. It is not maximum at the equator due to excess of rain over evaporation but the region of 20‐40 degree N records the highest average salinity of 36 % as a result of higher evaporation. In the southern hemisphere between 10‐30 degree S, 36% salinity is found. After obtaining maximum in the lower middle latitude, it again decreases between 40‐60 degree N & S & is 31% in northern hemisphere & 33% in southern hemisphere. Still lesser salinity is found in the polar areas due to the melting of ice. However, for the whole of northern hemisphere the average salinity observed is 34% 7 in southern hemisphere it is 35%. The different in these 2 is attributed to the abundance of ocean water in the Southern Hemisphere.

Vertical Distribution

  • Salinity in the ocean decreases or increases in bottom according to the nature of the water mass. Those who attribute salinity to the atmospheric reaction conclude that due to the greater depth & less radius of influence of the greater depth & less radius of influence of the atmosphere salinity decreases at the bottom. This variation in salinity shows large difference with the latitude unless there is an occurrence of some cold or warm water mass which may result in drastic changes. At the southern boundary of the Atlantic salinity is 33.0, but; at 200 fathoms it reaches up to 34% increases to 34.50 still deeper at the bottom. Just at the equator the surface salinity of 34% increases with the depth to 35% due to greater mixture of fresh water at the surface.
  • The saltiest water occurs in the Red Sea & the Persian Gulf where rates of evaporation are very high of the major oceans the North Atlantic is the saltiest its salinity averages about 37.9%.
  • Generally it can be said that in high latitude salinity increases with depth due to dense water found at the bottom. Whereas in the middle latitude salinity increases with the depth up to 200 bottoms & then it starts decreasing. At equator due to a mixture of fresh water by rainfall surface salinity is low; just below this greater salinity is found which again decreases at the bottom due to the presence of cold water.

Density of Ocean water | UPSC – IAS

  • The density of any substances is the mass per unit volume stated in grams per cubic centimeter. Commonly the word density is used for specific gravity which is the ratio of the density to that of distilled water at a given temperature & under atmospheric pressure.
  • Pure water has maximum density of one unit at temperature 4 degree Celsius, whereas for the sea it changes according to the salinity content.
  • Density of pure water depends upon temperature & pressure only.
  • Whereas that of sea water depends upon temperature, pressure 7 salinity.
  • This diagram shows the role of salinity on changes in density & freezing point.
  • From the figure clear that pure clear that pure water freezes at 0 degree Celsius & has maximum density at 4 degree Celsius. The freezing point of ocean water decreases with increasing salinity so also the temperature of maximum density of.

Distribution of density of sea water | UPSC – IAS

  • In general there is a latitudinal difference in the density distribution, depending on the character of the water changing from equator to the poles. The density of the upper layer commonly increases from the tropics towards the poles.
  • The nature of the comparatively dense water in to sink down below the lighter water when 2 water masses having different density more dense water sinks down & then spreads out from the place where the similar density is found. It is observed that in the middle latitude, denser water sinks at lesser depths than the water that sinks at convergence in higher latitudes.

Vertical Distribution

The vertical distribution of density would reveal that generally at surface water of low density are found which increase in density towards the bottom. It is so because any amount of water which finds itself among less dense water would sink automatically below the surface up to that depth where water of similar density is found. Hence at places of convergences dense water mass sinks below the lighter one & forms bottom water. Nevertheless contrary to the surface current from the equator towards the pole there is bottom 7 this brings denser water under the surface of the sea.

Temperature of Ocean water | UPSC – IAS

  • The study of temperatures of oceans is the subject matter of massive meteorology which deals with that portion of the atmosphere which overspreads the great water masses.
  • The temperature of the sea & its accurate measurements has been one of the chief tasks of oceanographs, as it helps in the determination of the movements of large masses of ocean water.

There are various process of heating the ocean water

  1. By absorption of radiation from the sun
  2. Convection of heat through the ocean bottom from the interior of the earth.
  3. Transformation of kinetic energy into heat.
  4. Heating due to chemical processes.
  5. Convection of sensible heat from the atmosphere
  6. And condensations of water vapour.

Distribution of Temperature

The temperature & its distribution are determined by the following factors.

  1. The intensity & daily duration of solar radiated energy received.
  2. The depletion of this energy in this atmosphere by reflection, scattering & absorption.
  3. The albedo of the surface & its changes according to the angle of rays.
  4. Heat balance.
  5. Heat transfer through evaporation condensation.
  6. Important physical characteristics of the surface.

Ex – If the salinity of the ocean is greater the boiling point is raised & hence the temperature is high. Similarly if the density is lower than the temperature would be higher vice versa. But a combination of high temperature the amount of evaporation also determines the temperature.

Surface temperature of Ocean water | UPSC – IAS

A number of features which regard to the surface temperature of the ocean in relation to the latitudes are clearly brought out when we study the data given in the table below. The temperature decreases with the increasing distance from the equator. The decrease is about ½ per latitude though in actual observation it is slightly different. As a general rule the temperature decreases as the latitude increases but in all the oceans the higher values of the surface temperature are found to the north of equator.

North Atlantic Indian Pacific Southern Atlantic Indian Pacific
latitude Ocean Ocean Ocean latitude in Ocean Ocean Ocean
in degree degree
70 60‐ 5.60 70 – 60 ‐1.30 ‐1.50 ‐1`.30
60 50‐ 8.66 5.74 60 – 50 1.76 1.63 5.00
50 40‐ 13.16 9.99 50 – 40 8.68 8.67 11.16
40 30‐ 20.40 18.62 40 – 30 16.90 17.00 16.98
30 20‐ 24.16 26.14 23.38 30 – 20 21.20 22.53 21.53
10 0‐ 25.81 27.23 26.42 20 – 10 23.16 25.85 25.11
26.66 27.85 27.20 10  0‐ 25.18 27.41 26.01

Average surface temperature of the oceans between parallels of latitudes [temperature in degree centigrade].

Temperature beneath the surface

The sun rays have no direct effect below 600 feet & in spite of movement of water a vast bulk of sea is relatively cold. In general the complete stratification may appear in sea as lighter water of high salinity is found above the dense cold bottom water.

The following facts are marked as the characteristics of the vertical distribution of temperature of the sea.

  • Firstly in spite of a general decrease of temperature towards the bottom the rate of fall is not equal at all depths up to 2000m the fall is rapid whereas it is almost stagnant below it.
  • Secondly the surface temperature decreases with the increasing latitudes. Whereas the bottom temperature remains almost the same thus the rate of fall at equator is greater than at poles.
  • The surface temperature & its decrease may be found to be influenced by the factor of upwelling of bottom water.
  • In equatorial region an almost reversal of average conditions is found. At the surface the temperature & salinity is slightly lower due to abundant rainfall but just below it a layer exhibits high temperature & high salinity. Further at greater depth the usual decrease is found.
  • Higher temperature is found at the bottom is due to insulation, anticyclonic circulation of currents around it & lesser mixing of cold waters.

Conclusion | UPSC – IAS

  • In ocean the distribution of physical properties like salinity, density & temperature is represented with the help of coordinates of latitudes & longitudes with the additional factor of depths.
  • Variations in salinity are according to the atmosphere i.e. the difference between precipitation and evaporation.
  • Density of seawater depends upon the temperature, pressure and salinity.
  • If the salinity is greater than the boiling point is raised & hence the temperature is high & also combination of high salinity & high density also produces high temperature.
  • Temperature, density & salinity of sea water are inter‐related with each other.

Causes of Eutrophication and Algal bloom | UPSC – IAS

Causes of Eutrophication and Algal bloom | UPSC - IAS

Causes of Eutrophication and Algal bloom | UPSC - IAS

Causes of Eutrophication and Algal bloom | UPSC – IAS

Eutrophication derives from the Greek word eutrophos, meaning nourished or enriched. Eutrophication is the natural aging of a lake by biological enrichment of its water. In a young lake the water is cold and clear, supporting little life. With time, streams draining into the lake introduce nutrients such as nitrogen and phosphorus, which encourage the growth of aquatic organisms. In other words, the Eutrophication refers to the addition of artificial or non-artificial substances, such as nitrates and phosphates, through fertilizers or sewage, to a fresh water system. It can be anthropogenic or natural.

  • Eutrophication leads to increase in the primary productivity of the water body or “bloom” of phytoplankton. The overgrowth causes the loss of oxygen in the water leading to severe reductions in fish and other animal populations.
  • What is the cause of eutrophication ? – Domestic sewage, the most common source of pollution of water bodies, reduces dissolved oxygen but increases biochemical oxygen demand of receiving water. Domestic sewage is rich in nutrients, especially, nitrogen and phosphorus, which cause eutrophication and nuisance algal blooms.

Types of Eutrophication | UPSC – IAS

Eutrophication is mainly divided into natural and cultural Eutrophication.

Natural Eutrophication

  • In natural Eutrophication, a lake is characterized by nutrient enrichment. During this process an oligotrophic lake is converted into an eutrophic lake. It permits the production of phytoplankton, algal blooms and aquatic vegetation that in turn provide ample food for herbivorous zooplankton and fish.
  • While Cultural Eutrophication is caused by human activities. Which in turn are responsible for addition of 80% nitrogen and 75% phosphorus to lake and streams.

Accelerated or Cultural Eutrophication

  • Over the centuries, as silt and organic debris pile up, the lake grows shallower and warmer, with warm-water organisms supplanting those that thrive in a cold environment. Marsh plants take root in the shallows and begin to fill in the original lake basin. Eventually, the lake gives way to large masses of floating plants (bog), finally converting into land.
  • Depending on climate, size of the lake and other factors, the natural aging of a lake may span thousands of years. However, pollutants from human activities like effluents from the industries and homes can radically accelerate the aging process. This phenomenon has been called Cultural or Accelerated Eutrophication.
  • In other words when the process of Eutrophication is increased by the human activities, it is called cultural or accelerated Eutrophication. This is because the human activities (mainly development in nature) increase the surface runoff and the nutrients such as Phosphates, Nitrates are supplied to the Ocean water. They may be supplied by Constriction works, treatment plants, golf courses, fertilizers, and farms.

Features and sources of Eutrophication | UPSC - IAS

Features of Eutrophication | UPSC – IAS

  • Eutrophication escalates rapidly when high nutrients from fertilizers, domestic and industrial wastes, urban drainage, detergents and animal, sediments enter water streams.
  • Eutrophication causes several physical, chemical and biological changes, which considerably deteriorate the water quality.
  • It creates algal bloom, releases toxic chemicals that kill fish, birds and other aquatic animals.
  • Decomposition of algal bloom leads to the depletion of oxygen in water. Thus with a high CO2 level and poor oxygen through reduction of nitrates.
  • On complete exhaustion of nitrate, oxygen may as last resort be obtained by reduction of sulphate yielding hydrogen sulphide causing foul smell and putrefied taste of water. Many pathogenic microbes, viruses, protozoa and bacteria and grow on sewage products under anaerobic conditions. It results into the spread of fatal water-borne disease such as polio, dysentery, diarrhoea, typhoid and viral hepatitis.

Ways to control Eutrophication | UPSC – IAS

  • Several prevention and technical devices have been used to control Eutrophication. The wastewater must be treated before its discharge into water streams.
  • Recycling of nutrients can be checked through harvest. Removing nitrogen and phosphorous at the source, division of nutrient-rich waters from the receiving bodies and dilution of these elements can minimize Eutrophication.
  • Algal blood should be removed upon their death and decomposition. Limiting the dissolve nutrients can control algal growth. The most suitable, feasible and effective method involves the use of chemicals to precipitate additional phosphorus.
  • Precipitants like alum, lime, iron and sodium aluminate may be used. Physicochemical methods can be adopted to remove nutrients. for example phosphorus can be removed by precipitation and nitrogen by nitrification or denitrification.
  • Electrodialysis, reverse osmosis and ion exchange methods. Copper-sulphate and sodium arsenite are employed for killing algae and rooted plant respectively.

Relation between Viruses and Aquatic Ecosystem | UPSC – IAS

  • A teaspoon of seawater contains about one million of Viruses, making them the most abundant biological entity in aquatic environments. They are useful in the regulation of saltwater and freshwater ecosystems. The Bacteriophage, which is harmless to plants and animals, play the most important role here.
  • They infect and destroy the bacteria in aquatic microbial communities, comprising the most important mechanism of recycling carbon in the marine environment. However, the organic molecules released from the bacterial cells by the viruses stimulate fresh bacterial and algal growth. Viruses are useful for the rapid destruction of harmful algal blooms that arises generally from the Blue Green algae and often kills other marine life.
  • Viruses increase the amount of Photosynthesis in Oceans and are responsible for reducing the amount of carbon dioxide in the atmosphere by approximately 3 giga-tonnes of carbon per year.

All Types of satellite orbits and their features

All Types of satellite orbits and their features | UPSC - IAS

All Types of satellite orbits and their features | UPSC - IAS

Types of satellite orbits and their features | UPSC – IAS

When the satellite is moving in the orbits, it stays in position because the centripetal force on the satellite balances the gravitational attractive force of the earth. This balance depends on the following:

  • Distance from the earth
  • Tangential speed of the satellite
  • Earth’s radius
  • Gravitational force of the earth. But it does not depend upon:
  • Mass of the satellite
  • Size of the Satellite

There are three major types of orbits viz. :-

  • Polar orbit – A polar orbit is one in which a satellite passes above or nearly above both poles of the body being orbited on each revolution. It therefore has an inclination of 90 degrees to the body’s equator.
  • Inclined orbit- A satellite is said to occupy an inclined orbit around Earth if the orbit exhibits an angle other than 0° to the equatorial plane.
  • Near-Equatorial orbit- A near-equatorial orbit is an orbit that lies close to the equatorial plane of the object orbited. Such an orbit has an inclination near 0°.

About Geostationary Orbit (GEO) | UPSC – IAS

A geostationary orbit, also referred to as a geosynchronous equatorial orbit (GEO), is a circular geosynchronous orbit 35,786 kilometres (22,236 miles) above Earth’s equator and following the direction of Earth’s rotation.
  • If we need a satellite for the purpose which needs this satellites to remain at a particular distance from earth at all the time, then we need circular orbits so all the points on circular orbit are at equal distance from earth’s surface. The circular equatorial orbit is exactly in the plane of equator on the earth.
  • If the satellite is moving in the circular-equatorial orbit and its angular velocity is equal to earth’s angular velocity, the satellite is said to be moving along with the earth. This satellite would appear stationary from the earth and this orbit would be called Geostationary Orbit.

About Geostationary Orbit (GEO) | UPSC - IAS

Features of Geostationary Orbits

  • The orbit is circular
  • The orbit is in equatorial plane i.e. directly above the equator and thus inclination is zero.
  • The angular velocity of the satellite is equal to angular velocity of earth
  • Period of revolution is equal to period of rotation of earth.
  • Finish one revolution around the earth in exactly one day i.e. 23 hours, 56 Minutes and 4.1 seconds
  • There is ONLY one geostationary orbit.

About Geosynchronous Orbit | UPSC – IAS

There is a difference between the geostationary and geosynchronous orbits. We should note that while other orbits may be many, there is ONLY ONE Equatorial orbit, i.e. the orbit which is directly above the earth’s equator. Sometimes we send a satellite in the space which though has a period of revolution is equal to period of rotation of earth, but its orbit is neither equatorial nor Circular.

  • So, this satellite will finish one revolution around the earth in exactly one day i.e. 23 hours, 56 Minutes and 4.1 seconds, yet it does NOT appear stationary from the earth.
  • It looks oscillating but NOT stationary and that is why it is called Geosynchronous. So, the main features of a geosynchronous satellite are as follows:-

Features of Geosynchronous Orbits-

  • The orbit is NOT circular
  • The orbit is NOT in equatorial plane i.e. directly above the equator, it’s in inclined orbit
  • The angular velocity of the satellite is equal to angular velocity of earth
  • Period of revolution is equal to period of rotation of earth.
  • Finish one revolution around the earth in exactly one day i.e. 23 hours, 56 Minutes and 4.1 seconds
  • There are many geosynchronous orbits.

Note – that it is practically NOT possible to achieve an absolute geostationary orbit. So, the terms geostationary and geosynchronous are used alternatively.

Advantages of GEO satellites

  • Most communications satellites in use today for commercial purposes are placed in the geostationary orbit, because one satellite can cover almost 1/3 of Earth’s surface, offering a reach far more extensive than what any terrestrial network can achieve.
  • The geosynchronous satellites remain stationary over the same orbital location, users can point their satellite dishes in the right direction, without costly tracking activities, making communications reliable and secure
  • Because of their capacity and configuration, GEOs are often more cost-effective for carrying high-volume traffic, especially over long-term contract arrangements. For example, excess capacity on GEO systems often is reserved in the form of leased circuits for use as a backup to other communications methods.
  • GEO systems have significantly greater available bandwidth than the Low Earth Orbit -LEO and Medium Earth Orbit – MEO systems. This permits them to provide two-way data, voice and broadband services that may be impractical for other types of systems.
  • GEO satellites are proven, reliable and secure – with a lifespan of 10-15 years.

Altitude of Geostationary Orbit

  • In Geostationary Orbit, the satellite moves with an orbital speed of 11068 km per hours.
  • A minimum of three satellites are needed to cover the entire earth.
  • Super synchronous orbit is a disposal / storage orbit above GSO. From earth, they would seem drifting in westerly direction.
  • Sub synchronous orbit is a orbit close to but below GSO and is used for satellites undergoing station, changes in an eastern direction.

About Low Earth Orbits | UPSC – IAS

A low Earth orbit is an Earth-centred orbit with an altitude of 2,000 km or less, or with at least 11.25 periods per day and an eccentricity less than 0.25. Most of the artificial objects in outer space are in Low Earth Orbit (LEO). The International Space Station is in a LEO that varies from 320 km to 410 km above the Earth’s surface.

  • A satellite can also be placed in orbits below the Geostationary orbit, however, it will require higher orbital velocity. For example, a satellite which is placed in an orbit at altitude of 200 kilometers will need an orbital velocity of approximately 29,000 kilometer per hour.
  • Similarly, a satellite placed in an orbit at around 1730 kilometers will need a speed of 25,400 kilometers per hour.
  • LEO systems fly about 1,000 kilometers above the Earth (between 400 miles and 1,600 miles) and, unlike GEOs, they appear travelling across the sky from earth.
  • A typical LEO satellite takes 1 and half hours to orbit the Earth, which means that a single satellite is “in view” of ground equipment for a only a few minutes. As a consequence, if a transmission takes more than the few minutes that any one satellite is in view, a LEO system must “hand off” between satellites in order to complete the transmission.
  • In general, this can be accomplished by constantly relaying signals between the satellite and various ground stations, or by communicating between the satellites themselves using “inter-satellite links.”
  • LEO systems are designed to have more than one satellite in view from any spot on Earth at any given time, minimizing the possibility that the network will lose the transmission. Because of the fast-flying satellites, LEO systems must incorporate sophisticated tracking and switching equipment to maintain consistent service coverage.
  • The need for complex tracking schemes is minimized, but not obviated, in LEO systems designed to handle only short-burst transmissions.
  • The advantage of the LEO system is that the satellites’ proximity to the ground enables them to transmit signals with no or very little delay, unlike GEO systems. LEO satellites rotate the earth and currently deliver significant voice quality over the Geosynchronous (GEO) satellite systems.
  • Now a days, LEO Satellites are used in constellations such as Globalstar and Iridium constellations. In addition, because the signals to and from the satellites need to travel a relatively short distance, LEOs can operate with much smaller user equipment (e.g., antennae) than can systems using a higher orbit.
  • In addition, a system of LEO satellites is designed to maximize the ability of ground equipment to “see” a satellite at any time, which can overcome the difficulties caused by obstructions such as trees and buildings.

Advantages and disadvantages of Low Earth Orbit (LEO)

  • It requires less energy to place a satellite into a LEO and the LEO satellite needs less powerful amplifiers for successful transmission, LEO is still used for many communication applications.
  • However, since these LEO orbits are not geostationary, a network (or “constellation”) of satellites is required to provide continuous coverage.
  • The transmission delay associated with LEO systems is the lowest of all of the systems.
  • Because of the relatively small size of the satellites deployed and the smaller size of the ground equipment required, the LEO systems are expected to cost less to implement than the other satellite systems.
  • The small coverage area of a LEO satellite means that a LEO system must coordinate the flight paths and
    communications handoffs a large number of satellites at once, making the LEOs dependent on highly complex and sophisticated control and switching systems.
  • LEO satellites have a shorter life span than other systems. There are two reasons for this:
    • First, the lower LEO orbit is more subject to the gravitational pull of the Earth and
    • Second, the frequent transmission rates necessary in LEO systems mean that LEO satellites generally have a shorter battery life than others.

Issue of Orbital Decay in Low Earth Orbits

Decay is a gradual decrease of the distance between two orbiting bodies at their closest approach over many orbital periods. These orbiting bodies can be a planet and its satellite, a star and any object orbiting.

  • The satellites particularly in the Low Earth Orbit (LEO) are subject to a drag produced by an atmosphere due to frequent collisions between the satellite and surrounding air molecules.
  • The amount of this drag keeps increasing or decreasing depending upon several factors including the solar activity. The more activity heats of the upper atmosphere and can increase the drag.
  • This drag in a long duration causes a reduction in the altitude of a satellite’s orbit, which is called orbital decay. So, the major cause of the orbital decay is Earth’s atmosphere.
  • The result of the drag is increased heat and possible reentry of satellite in atmosphere causing it to burn. Lower its altitude drops, and the lower the altitude, the faster the decay.
  • Apart from Atmosphere, the Tides can also cause orbital decay, when the orbiting body is large enough to raise a significant tidal bulge on the body it is orbiting and is either in a retrograde orbit or is below the synchronous orbit. Mars’s moon Phobos is one of the best examples of this.

About Medium Earth Orbit (MEO) | UPSC – IAS

Medium Earth orbit (MEO), sometimes called intermediate circular orbit, is the region of space around Earth above low Earth orbit and below geosynchronous orbit. Unlike the circular orbit of the geostationary satellites, MEO’s are placed in an elliptical (oval-shaped) orbit.

  • Medium Earth Orbit (MEO) systems operate at about 8,000-20,000 km above the Earth, which is lower than the GEO orbit and higher than most LEO orbits.
  • The MEO orbit is a compromise between the LEO and GEO orbits. Compared to LEOs, the more distant orbit requires fewer satellites to provide coverage than LEOs because each satellite may be in view of any particular location for several hours.
  • Compared to GEOs, MEOs can operate effectively with smaller, mobile equipment and with less latency (signal delay). These orbits are primarily reserved for communications satellites that cover the North and South Pole.
  • Although MEO satellites are in view longer than LEOs, they may not always be at an optimal elevation. To combat this difficulty, MEO systems often feature significant coverage overlap from satellite to satellite, which in turn requires more sophisticated tracking and switching schemes than GEOs.
  • Typically, MEO constellations have 10 to 17 satellites distributed over two or three orbital planes. Most planned MEO systems will offer phone services similar to the Big LEOs. In fact, before the MEO designation came into wide use,
  • MEO systems were considered Big LEOs. Examples of MEO systems include – ICO Global Communications and the proposed Orblink from Orbital Sciences.
  • The orbit is home to a number of artificial satellites – the most common uses include navigation, communication, and geodetic/space environment science.

About Polar Orbits | UPSC – IAS

A polar orbit is one in which a satellite passes above or nearly above both poles of the body being orbited on each revolution. It therefore has an inclination of 90 degrees to the body’s equator

The Polar Orbit is not much suitable for communication purposes because it moved in a different direction than that of direction of earth’s rotation. So, the use of Polar satellites depends upon their arrival at a particular point on earth at a particular point. The Polar orbits are used for special applications like navigational satellites.

Features of Polar Orbits

  • Except for polar geosynchronous orbit, a satellite in a polar orbit will pass over the equator at a different longitude on each of its orbits.
  • No one spot on the Earth’s surface can be sensed continuously from a satellite in a polar orbit, this is its biggest drawback.
  • The polar orbit can be manipulated also. If we want a satellite in polar orbit to remain hovering over a certain area for larger time, it can be placed in a highly elliptical orbit with its apogee over that area.
  • In a polar orbit, the satellite passes above or nearly above both poles of the earth being orbited on each revolution. So, we can say that the inclination of such orbit is almost 90 degrees to the equator.

The Polar orbits are used for – earth-mapping, earth observation, and reconnaissance satellites, as well as for some weather satellites. However, Iridium satellite constellation also uses a polar orbit to provide telecommunications services.

Why Polar orbits are used for earth-mapping ?

Polar orbits are in a plane that is almost perpendicular to the plane of the equator and so passes over the poles of the Earth and then also, Earth rotates from East to West under the satellite. For instance, if the period of satellite is 6 hours then in one polar revolution, earth will rotate around 90° westwards. Thus, in a couple of days the whole earth can be mapped.

About Inclined Orbit | UPSC – IAS

  • An inclined orbit is used to cover the Polar Regions. It’s not a very popular orbit and used not very frequently. The height of the inclined orbit is kept such that it covers the required area of the region of interest. The time for which the satellite is visible to the point on the earth is also controlled.
  • Satellite cannot remain in continuous contact with the point on the earth if rotating in inclined orbit. Sometimes the inclined orbit is also called elliptical inclined orbit.

About Sun-synchronous orbit | UPSC – IAS

A Sun-synchronous orbit, also called a heliosynchronous orbit, is a nearly polar orbit around a planet, in which the satellite passes over any given point of the planet’s surface at the same local mean solar time.

  • Sun-synchronous orbit or a heliosynchronous orbit very important because of its particular importance to satellites intended for remote sensing and military applications.
  • A sun-synchronous orbit is one that lies in a plane that maintains a fixed angle with respect to the Earth-sun direction. In other words, it combines altitude and inclination in such a way that an object on that orbit ascends or descends over any given point of the Earth’s surface at the same local mean solar time.
  • We can say that the orbital plane in such a case has a fixed orientation with respect to the Earth-sun direction and the angle between the orbital plane and the Earth-sun line remains constant throughout the year.

Features of Sun Synchronous Orbits

  • The satellite passes over a given location on Earth every time at the same local solar time.
  • Thus, it guarantees the same illumination condition, which varies only with seasons.
  • The orbit is Quasi-polar in nature and so ensures coverage of the whole surface of the Earth
  • Every time a sun-synchronous satellite completes one revolution around earth, it traverses a thin strip on the surface of the Earth. During the next revolution it traverses another strip.

About Frozen Orbits | UPSC – IAS

A frozen orbit is an orbit for an artificial satellite in which natural drifting due to the central body’s shape has been minimized by careful selection of the orbital parameters. Typically, this is an orbit in which, over a long period of time, the satellite’s altitude remains constant at the same point in each orbit.

  • We all know that Earth is not perfectly round. This means the gravitation is not exactly same at all the places. Apart from that there is gravitational pull from Sun and Moon too, followed by the solar radiation pressure, air drag and so many other forces.
  • In other words, most satellites experience noticeable variations in orbital eccentricity (orbit’s eccentricity is a way of measuring how much the orbit deviates from a perfect circle).
  • But, fortunately, the distorting impacts of these issues can be induced to cancel each other by expert satellite planners. They choose optimum Orbital altitude, inclination, eccentricity and argument of perigee. The satellites whose orbital parameters are controlled by such techniques is said to be in Frozen Orbits.
  • Thus we can say that:- Frozen orbit is a Sun-synchronous orbit in which the precession of the orbital plane around the polar axis of the Earth caused by the oblateness of the Earth is utilized to the benefit of the mission by choosing correct orbital parameters.
  • The Earth observation satellites European Remote Sensing satellite (ERS) -1, European Remote Sensing satellite (ERS) -2 and Envisat are all operated in Sun-synchronous “frozen” orbits.

About Clarke Orbit | UPSC – IAS

A single geostationary satellite can view approximately one third of the Earth’s surface. If three satellites are placed at the proper longitude, the height of this orbit allows almost the Earth’s entire surface to be covered by the satellites. It was first of all conceptualized by world famous science fiction writer Arthur C. Clarke.

The stations would be arranged approximately equidistantly around the earth and the following longitudes appear suitable:

  • 30°E – Africa & Europe
  • 150°E – China & Oceania
  • 90° W– The Americas

The station chain would be linked by radio or optical beams and thus any broadcast service could be provided. The geostationary orbit is now sometimes referred as the Clarke Orbit or the Clarke Belt in his honor.

About Highly elliptical orbit (HEO) | UPSC – IAS

About Highly elliptical orbit (HEO) | UPSC - IAS

  • A highly elliptical orbit is an elliptic orbit with high eccentricity, usually referring to one around Earth. Examples of inclined HEO orbits include Molniya orbits, named after the Molniya Soviet communication satellites which used them, and Tundra orbits.
  • Highly Elliptical Orbits (HEOs) about the Earth are often selected for astrophysics and astronomy missions, as well as for Earth missions, such as Molniya or Tundra orbits, as they offer vantage point for the observation of the Earth and the Universe.

Other types of Orbit | UPSC – IAS

  • Super synchronous orbit is a disposal / storage orbit above GSO. From earth, they would seem drifting in westerly direction.
  • Sub synchronous orbit is a orbit close to but below GSO and is used for satellites undergoing station, changes in an eastern direction.
  • Graveyard orbit is a Supersynchronous orbit where spacecraft are intentionally placed at the end of their operational life.

Kashmir Saffron gets GI Tag and its Significance | UPSC – IAS

kashmiri saffron gi tag upsc

kashmiri saffron gi tag upsc

Significance of Geographical Tag of – Kashmir saffron

Kashmir saffron is a very precious and costly product. With the GI tag, Kashmir saffron would gain more prominence in the export market and also stop adulteration prevalent in the trade of Kashmir saffron.

As Iran is responsible for 90–93% of global production, with much of their produce exported. High-grade Kashmiri saffron is often sold and mixed with cheaper Iranian imports; these mixes are then marketed as pure Kashmiri saffron, a development that has cost Kashmiri growers much of their income.

Uses of Kashmir Saffron | UPSC – IAS

  • Kashmir saffron is renowned globally as a spice (Saffron is the most expensive spice in the world). It has been associated with traditional Kashmiri cuisine and represents the rich cultural heritage of the region.
  • The unique characteristics of Kashmir saffron are its longer and thicker stigmas (thread-like structures, or stigma), natural deep-red colour, high aroma, bitter flavour, chemical-free processing.

Uniqueness of Kashmir Saffron

  • It is the only saffron in the world grown at an altitude of 1,600 m to 1,800 m AMSL (above mean sea level), which adds to its uniqueness and differentiates it from other saffron varieties available the world over.
  • Location – It is cultivated and harvested in the Karewa (highlands) of Jammu and Kashmir.
  • It is used in cosmetics and for medicinal purposes.

Types of Kashmir Saffron | UPSC – IAS

The saffron available in Kashmir is of three types —

  • Lachha Saffron – with stigmas just separated from the flowers and dried without further processing;
  • Mongra Saffron – in which stigmas are detached from the flower, dried in the sun and processed traditionally; and
  • Guchhi Saffron – which is the same as Lachha, except that the latter’s dried stigmas are packed loosely in airtight containers while the former has stigmas joined together in a bundle tied with a cloth thread.

Benefits of Kashmiri Saffron

  • Kashmir saffron rejuvenates health and is used in cosmetics and for medicinal purposes.
  • There is also growing evidence that saffron may help improve mood and be a useful addition to treatment for depression.
  • Saffron is high in antioxidants, which may help kill cancer cells while leaving normal cells unharmed. However, more human research is needed.
  • Both eating and smelling saffron appears to help treat PMS symptoms, such as irritability, headaches, cravings, pain, and anxiety.
  • Improved heart disease risk, blood sugar levels, eyesight, and memory. However, more studies are needed to draw stronger conclusions.
  • Antioxidants help fight against oxidative stress and free radicals in the body. The main active antioxidants include:
    • Crocin
    • Picrocrocin
    • Safranal

Subduction zone and Importance of Studying Them | UPSC – IAS

Subduction Zones UPSC - IAS

Subduction Zones UPSC - IAS

Subduction Zone- are the regions where tectonic plates converge and one plate slips/subsides beneath the other. It results in formation of trenches for Example:- Aleutian Trench. At these regions, magma finds its way to the surface resulting in volcanic eruptions.

Importance of studying Subduction zones them:

  • Climate change – Aerosols released during volcano can slow down climate change.
  • Aviation industry – Flight schedule gets disrupted as a result of volcanic ash n smoke.
  • Island formation – magma solidification results in island formation.
  • Seismic activity – 90% of earthquakes occur in the Pacific ring of fire which is a region of subduction
  • Population density – Around 10 crore people live, within 100 kilometer of subduction zone.
  • Disaster management – Recovery and response can be better arranged.

Invasive Alien Species in India and its Causes | UPSC – IAS

Invasive Alien Species ZSI findings and its Causes UPSC - IAS

Invasive Alien Species ZSI findings and its Causes UPSC - IAS

Invasive Alien Species by Zoological Survey of India (ZSI) | UPSC – IAS

An invasive alien species is a species that is not native to a specific location (an introduced species), and that has a tendency to spread to a degree believed to cause damage to the environment, human economy or human health.

An introduced species, alien species, foreign species, exotic species, non-indigenous species, or non-native species is a species living outside its native distributional range, but which has arrived there by human activity, either deliberate or accidental.

Causes of Invasive Alien Species | UPSC – IAS

While all species compete to survive, invasive species appear to have specific traits or specific combinations of traits that allow them to outcompete native species. In some cases, the competition is about rates of growth and reproduction. In other cases, species interact with each other more directly.

Study found invasive species tended to have only a small subset of the presumed traits and that many similar traits were found in noninvasive species, requiring other explanations. Common invasive species traits include the following:

  • Fast growth
  • Rapid reproduction
  • High dispersal ability
  • Phenotype plasticity (the ability to alter growth form to suit current conditions)
  • Tolerance of a wide range of environmental conditions (Ecological competence)
  • Ability to live off of a wide range of food types
  • Association with humans
  • Prior successful invasions

Findings of Zoological Survey of India | UPSC – IAS

National Conference on the Status of Invasive Species in India was organised by Zoological Survey of India and the Botanica  Survey of India in which ZSI announced a list of alien invasive animal species. Findings of Zoological Survey of India are as follows:-

ZSI has made a list of 157 species of Invasive Alien Species (IAS) out of which 58 are found on land and freshwater habitat and 99 are found in marine ecosystem. Common Alien Animal Species found in India are –

  • African Apple Snail – found in Andaman and Nicobar Island, now spread across the whole country
  • Papaya Mealy Bug – massively affected papaya crop in Assam, West Bengal and Tamil Nadu
  • Cotton Mealy Bug – threat to cotton crops in Deccan
  • Amazon sailfin catfish – responsible for destroying fish population in wetlands
  • Orange Cup-Coral – originated in Indo- East Pacific, now also found in Andaman and Nicobar Island, Gulf of Kutch, Kerala and Lakshadweep.
  • Primrose Willow -It is an aquatic plant native to Central and South America. It flourishes in sandy and mineral rich soil of wetlands. First seen in Karbi Anglong district of Assam and is now spreading in Tamil Nadu, Kerala, the Andaman & Nicobar Islands and West Bengal.

Steps taken to control Invasive Alien Species | UPSC – IAS

Invasive alien species (IAS) are a global issue that requires international cooperation and actions. Preventing international movement of Invasive alien species (IAS) and rapid detection at borders are less costly than control and eradication. Preventing the entry of Invasive alien species (IAS) is carried out through inspections of international shipments, customs checks and proper quarantine regulations. 

  • Article 8(h) of CBD and Aichi Target 9 aim to control or eradicate alien species which threaten ecosystems, habitats and species.
  • Global Invasive Species Program is supporting to implement Article 8(h) of CBD with IUCN as partner organization and also working to address the global threat to IAS.
  • IUCN’s Invasive Species Specialist Group has also been working to promote and facilitate the exchange of IAS information and knowledge across the globe and ensure linkages between policy making and flow of knowledge.
  • IUCN has also developed a number of global databases which provide critical information on IAS such as Global Invasive Species Database and the Global Register of Introduced and Invasive Species.

Heat budget of the earth and Distribution of Temperature | UPSC – IAS

Heat budget of the earth and Distribution of Temperature UPSC IAS PCS NCERT

Heat budget of the earth and Distribution of Temperature | UPSC – IAS

Earth’s internal heat budget is fundamental to the thermal history of the Earth. A heat budget is the perfect balance between incoming heat absorbed by earth and outgoing heat escaping it in the form of radiation.

Learning Objectives:-

  • Difference between Shortwave and Longwave Radiation
  • What happens to solar radiation when it enters Earth’s atmosphere?
  • How is solar radiation received and distributed ?
  • How does electromagnetic radiation warm the atmosphere?

We begin by discussing Earth’s solar radiation “budget”—the balance of incoming and outgoing radiation.

Shortwave versus Longwave Radiation | UPSC – IASShortwave versus Longwave Radiation UPSC

  • Solar radiation is almost completely in the form of visible light, ultraviolet and short infrared radiation, which as a group is referred to as shortwave radiation.
  • Radiation emitted by Earth -or terrestrial radiation – is entirely in the thermal infrared portion of the spectrum and is referred to as longwave radiation.

A wavelength of about 4 micrometers is considered the boundary on the spectrum separating longwave radiation from shortwave radiation. Thus, all terrestrial radiation is longwave radiation, whereas virtually all solar radiation is shortwave radiation.

Long-Term Energy Balance | UPSC – IAS

Long-Term Energy Balance Introduction UPSC PCS

In the long run, there is a balance between the total amount of energy received by Earth and its atmosphere as insolation on one hand, and the total amount of energy returned to space on the other. (Humans are likely altering the energy balance of the atmosphere through greenhouse gas emissions – for the purposes of understanding atmospheric warming processes, we will ignore that possibility for the moment.)

  • Although there is an overall long-term balance between incoming and outgoing radiation, the details of the energy exchanges between Earth’s surface and atmosphere are important for understanding basic weather processes.

Earth’s Energy Budget | UPSC – IAS

The balance of incoming and outgoing heat on Earth is referred to as its heat budget. While Earth’s energy budget accounts for the balance between the energy Earth receives from the Sun, the energy Earth radiates back into outer space after having been distributed throughout the five components of Earth’s climate system and having thus powered the so-called Earth’s heat engine.

  • The annual balance between incoming and outgoing radiation is the global energy budget, which can be illustrated by using 100 “units” of energy to represent total insolation (100 percent of insolation) received at the outer edge of the atmosphere and tracing its dispersal.
  • Keep in mind that the values shown here are approximate annual averages for the entire globe and do not apply to any specific location.

Heat budget of the earth and Distribution of Temperature UPSC IAS PCS NCERT

Radiation Loss from Reflection | UPSC – IAS

  • Most of the incoming solar radiation that arrives at the upper atmosphere does not warm it directly.
  • About 31 units of total insolation are reflected (or scattered) back into space by the atmosphere and the surface.
  • The albedo of Earth, therefore, is about 31 percent.

Direct Absorption of Solar Radiation | UPSC – IAS

  • Only 24 units of incoming solar radiation warm the atmosphere directly.
  • About 3 units of radiation (in the ultraviolet portion of the spectrum) are absorbed by ozone and so warm the ozone layer.
  • Another 21 units are absorbed by gases and clouds as incoming radiation passes through the rest of the atmosphere.

Surface-to-Atmosphere Energy Transfer | UPSC – IAS

  • About 45 units of insolation – nearly half of the total – simply transmit through the atmosphere to Earth’s surface where it is absorbed, warming the surface. The warmed surface of Earth then in turn transfers energy to the atmosphere above in a number of ways.
  • About 4 units of energy are conducted from Earth’s surface back into the atmosphere, where it is dispersed by convection. Energy is also transferred from the surface to the atmosphere through the transport of latent heat in water vapor.
  • About three-fourths of all sunshine falls on a water surface when it reaches Earth. Much of this energy is utilized in evaporating water from oceans, lakes, and other bodies of water.
  • About 19 units of energy pass into the atmosphere as latent heat stored in water vapor, eventually released when condensation takes place.
  • Greenhouse gases absorb large amounts of longwave radiation emitted by the surface, and in turn radiate much of this energy back to the surface where it may be absorbed – and then reemitted as longwave radiation again. Through the absorption of terrestrial radiation by greenhouse gases, the atmosphere receives a net gain of 14 units of energy.
  • A portion of the longwave radiation emitted by Earth’s surface, however, is transmitted directly through the atmosphere without being absorbed by the greenhouse gases.
  • Approximately 8 units of energy – in the form of longwave radiation with wavelengths between about 8 and 12 micrometers – transmit through what is called the atmospheric window, a range of wavelengths of infrared radiation that is not strongly absorbed by any atmospheric component. For the most part, then, the atmosphere is warmed indirectly by the Sun: the Sun warms the surface, and the surface, in turn, warms the air above.

Consequences of Indirect Warming of Atmosphere | UPSC – IAS

This complicated sequence of atmospheric warming has many ramifications. Because the atmosphere is warmed mostly from below rather than from above, the result is a troposphere in which cold air overlies warm air.

This “unstable” situation creates an environment of almost constant convective activity and vertical mixing. If the atmosphere were warmed directly by the Sun, resulting in warm air at the top of the atmosphere and cold air near Earth’s surface, the situation would be stable, essentially without vertical air movements. The result would be a troposphere that is largely motionless, apart from the effects of Earth’s rotation.

Variations in Insolation by Latitude and Season | UPSC – IAS

The energy budget we just discussed is broadly generalized. Many latitudinal and vertical imbalances are in this budget, and these are among the most fundamental causes of weather and climate variations.

  • In essence, we can trace a causal continuum wherein insolation absorption differences lead to temperature differences that lead to air-density differences that lead to pressure differences that lead to wind differences that often lead to moisture differences.
  • It has already been noted that world weather and climate differences are fundamentally caused by the unequal heating of Earth and its atmosphere. This unequal heating is the result of latitudinal and seasonal variations in insolation.

Latitudinal and Seasonal Differences | UPSC – IAS

  • There are only a few basic reasons for the unequal warming of different latitudinal zones. These reasons include variations in the angle at which solar radiation strikes Earth, the influence of the atmosphere itself on the intensity of radiation transmitted to Earth’s surface, and seasonal variations in day length.

Angle of Incidence | UPSC – IAS

The angle at which rays from the Sun strike Earth’s surface is called the angle of incidence. This angle is measured from a line drawn tangent to the surface. By this definition,

  • A ray striking Earth’s surface vertically, when the Sun is directly overhead, has an angle of incidence of 90°,
  • A ray striking the surface when the Sun is lower in the sky has an angle of incidence smaller than 90°, and
  • A ray striking Earth tangent to the surface (as at sunrise and sunset) has an angle of incidence of 0°.

Because Earth’s surface is curved and because the relationship between Earth and the Sun changes with the seasons, the angle of incidence for any given location on Earth also changes during the year.


The angle of incidence is the primary determinant of the intensity of solar radiation received at any spot on Earth.

  • If a ray strikes Earth’s surface vertically, the energy is concentrated in a small area;
  • if the ray strikes Earth obliquely, the energy is spread out over a larger portion of the surface.
  • The more nearly perpendicular the ray (in other words, the closer to 90° the angle of incidence), the smaller the surface area warmed by a given amount of insolation and the more effective the heating.
  • Averaged over the year as a whole, the insolation received by high-latitude regions is much less intense than that received by tropical areas.

Atmospheric Obstruction | UPSC – IAS

Insolation does not travel through the atmosphere unimpeded—it encounters various obstructions in the atmosphere.

  • Clouds, particulate matter, and gas molecules in the atmosphere may absorb, reflect, or scatter incoming solar radiation.
  • The result of these obstructions is a reduction in the intensity of this energy by the time it reaches Earth’s surface. On average, sunlight received at Earth’s surface is only about half as strong as it is at the top of Earth’s atmosphere.

The attenuation (weakening) of radiation that passes through the atmosphere varies from time to time and from place to place depending on two factors:-

  • The amount of atmosphere through which the radiation has to pass and
  • The Transparency of the air.

The distance a ray of sunlight travels through the atmosphere (commonly referred to as path length) is determined by the angle of incidence. A high angle ray traverses a shorter course through the atmosphere than a low-angle one.  A tangent ray (one having an incidence angle of 0°) must pass through nearly 20 times as much atmosphere as a vertical ray (one striking Earth at an angle of 90°).

Heat budget of the earth and Distribution of Temperature UPSC IAS, Atmospheric Obstruction NCERT

The effect of atmospheric obstruction tends to reinforce the pattern of solar energy distribution at Earth’s surface established by the angle of incidence.

For example, in high latitudes the Sun has a lower angle of incidence and a greater path length through the atmosphere than in the tropics. Thus, there are smaller losses of energy in the tropical atmosphere than in the polar atmosphere.

Duration of sunlight | UPSC – IAS

The duration of sunlight is another important factor in explaining latitudinal inequalities in warming. Longer days allow more insolation to be received and thus more solar energy to be absorbed.

  • In tropical regions, this factor is relatively unimportant because the number of hours between sunrise and sunset does not vary significantly from one month to another;
  • At the equator, of course, daylight and darkness are equal in length (12 hours each) every day of the year.
  • In middle and high latitudes, however, there are pronounced seasonal variations in day length. The conspicuous buildup of warmth in summer in these regions is largely a consequence of the long hours of daylight, and the winter cold is a manifestation of limited insolation being received because of the short days.

Latitudinal Radiation Balance | UPSC – IAS

As the vertical rays of the Sun shift northward and southward across the equator during the course of the year, the belt of maximum solar energy swings back and forth through the tropics.

  • Thus, in the low latitudes, between about 38° N and 38° S, there is an energy surplus, with more incoming than outgoing radiation.
  • In the latitudes north and south of these two parallels, there is an energy deficit, with more radiant loss than gain.
  • The surplus of energy in low latitudes is directly related to the consistently high angle of incidence, and the energy deficit in high latitudes is associated with low angles.

Physical Geography Dictionary and Glossary | A to Z | UPSC

Physical Geography Dictionary and Glossary | A to Z | UPSC

Physical Geography Dictionary and Glossary A to Z UPSC - IAS

Physical Geography Dictionary and Glossary | A to Z | UPSC – IAS


Geography terms and Definitions starting with A | UPSC – IAS

  • Ablation – Wastage of glacial ice through melting and sublimation.
  • Ablation zone The lower portion of a glacier where there is a net annual loss of ice due to  melting and sublimation.
  • Absolute humidity One measure of the actual water vapor content of air, expressed as the mass of  water vapor in a given volume of air, usually as grams of water per cubic meter of air.
  • Absorption The ability of an object to assimilate energy from electromagnetic waves that strike  it.
  • Accumulation (glacial ice accumulation) Addition of ice into a glacier by incorporation of snow.
  • Accumulation zone The upper portion of a glacier where there is a greater annual accumulation of  ice than there is wastage.
  • Acid rain Precipitation with a pH less than 5.6. It may involve dry deposition without moisture.
  • Adiabatic cooling Cooling by expansion, such as in rising air.
  • Adiabatic warming Warming by compression, such as in descending air.
  • Adret slope A slope oriented so that the Sun’s rays arrive at a relatively high angle. Such a  slope tends to be relatively warm and dry.
  • Advection Horizontal transfer of energy, such as through the movement of wind across Earth’s  surface.
  • Aeolian processes Processes related to wind action that are most pronounced, widespread, and  effective in dry lands.
  • Aerosols Solid or liquid particles suspended in the atmosphere; also called particulates.
  • Aggradation The process in which a stream bed is raised as a result of the deposition of sediment. A horizon Upper soil layer in which humus and other organic materials are mixed with mineral  particles.
  • Air mass An extensive body of air that has relatively uniform properties in the horizontal  dimension and moves as an entity.
  • Albedo The reflectivity of a surface. The fraction of total solar radiation that is reflected  back, unchanged, into space.
  • Alfisol A widely distributed soil order distinguished by a subsurface clay horizon and a  medium-to-generous supply of plant nutrients and water.
  • Alluvial fan A fan-shaped depositional feature of alluvium laid down by a stream issuing from a  mountain canyon.
  • Alluvium Any stream-deposited sedimentary material.
  • Alpine glacier Individual glacier that develops near a mountain crest line and normally moves  down-valley for some distance.
  • Andisol Soil order derived from volcanic ash. angiosperms Plants that have seeds encased in some sort of protective body, such as a fruit, a  nut, or a seedpod.
  • Angle of incidence The angle at which the Sun’s rays strike Earth’s surface.
  • Angle of repose Steepest angle that can be assumed by loose fragments on a slope without downslope  movement.
  • Annual plants (annuals) Plants that perish during times of environmental stress but leave behind a  reservoir of seeds to germinate during the next favorable period.
  • Antarctic Circle The parallel of 66.5° south latitude.
  • Antecedent stream Stream that predates the existence of the hill or mountain through which it  flows.
  • Anticline A simple symmetrical upfold in the rock structure.
  • Anticyclone A high-pressure center.
  • Antitrade winds Tropical upper-atmosphere westerly winds at the top of the Hadley cells that blow  toward the northeast in the Northern Hemisphere and toward the southeast in the Southern  Hemisphere.
  • Aphelion The point in Earth’s elliptical orbit at which Earth is farthest from the Sun (about  152,100,000 kilometers or 94,500,000 miles).
  • Aquiclude An impermeable rock layer that is so dense as to exclude water.
  • Aquifer A permeable subsurface rock layer that can store, transmit, and supply water.
  • Arctic Circle The parallel of 66.5° north latitude.
  • Arête A narrow, jagged, serrated spine of rock; remainder of a ridge crest after several glacial  cirques have been cut back into an interfluve from opposite sides of a divide.
  • Aridisol A soil order occupying dry environments that do not have enough water to remove soluble  minerals from the soil; typified by a thin profile that is sandy and lacking in organic matter.
  • Artesian well The free flow that results when a well is drilled from the surface down into the  aquifer and the confining pressure is sufficient to force the water to the surface without  artificial pumping.
  • Asthenosphere Plastic layer of the upper mantle that underlies the lithosphere. Its rock  is dense, but very hot and therefore weak and easily deformed.
  • Atmosphere The gaseous envelope surrounding Earth.
  • Atmospheric pressure The force exerted by the atmosphere on a surface.
  • Atoll Coral reef in the general shape of a ring or partial ring that encloses a  lagoon.
  • Average annual temperature range Difference in temperature between the average temperature of the hottest and coldest months for a location.
  • Average lapse rate The average rate of temperature decrease with height in the  troposphere—about 6.5° C per 1000 meters (3.6° F per 1000 feet).

Geography terms and Definitions starting with B | UPSC – IAS

  • Backwash Water moving seaward after the momentum of the wave swash is overcome by gravity and friction.
  • Badlands Intricately rilled and barren terrain of arid and semiarid regions, characterized by a multiplicity of short, steep slopes.
  • Bajada A continual alluvial surface that extends across the piedmont zone, slanting from the range toward the basin, in which it is difficult to distinguish between individual alluvial fans.
  • Barchan dune A crescent-shaped sand dune with cusps of the crescent pointing downwind.
  • Barometer Instrument used to measure atmospheric pressure.
  • Barrier island Narrow offshore island composed of sediment; generally oriented parallel to shore.
  • Barrier reef A prominent ridge of coral that roughly parallels the coastline but lies offshore, with a shallow lagoon between the reefs and the coast.
  • Basal slip The term used to describe the sliding of the bottom of a glacier over its bed on a lubricating film of water.
  • Basalt Fine-grained, dark (usually black) volcanic rock; forms from mafic (relatively low silica content) lava.
  • Base level An imaginary surface extending underneath the continents from sea level at the coasts and indicating the lowest level to which land can be eroded.
  • Batholith The largest and most amorphous of igneous intrusions.
  • Baymouth bar A spit that extends entirely across the mouth of a bay, transforming the bay into a lagoon.
  • Beach An exposed deposit of loose sediment, normally composed of sand and/or gravel, and occupying the coastal transition zone between land and water.
  • Beach drifting The zigzag movement of sediment caused by waves washing particles onto a beach at a slight angle; the net result is the movement of sediment along the coast in a general downwind direction.
  • Bedding plane Flat surfaces separating one sedimentary layer from the next.
  • Bedload Sand, gravel, and larger rock fragments moving in a stream by saltation and traction.
  • B horizon Mineral soil horizon located beneath the A horizon.
  • Biodiversity The number of different kinds of organisms present in a location.
  • Biogeography The study of the distribution patterns of plants and animals, and how these patterns change over time.
  • Biological weathering Rock weathering processes involving the action of plants or animals.
  • Biomass The total mass (or weight) of all living organisms in an ecosystem or per unit area.
  • Biome A large, recognizable assemblage of plants and animals in functional interaction with its environment.
  • Biosphere The living organisms of Earth.
  • Biota The total complex of plant and animal life.
  • Blowout (deflation hollow) A shallow depression from which an abundance of fine material has been deflated by wind.
  • Boreal forest (taiga) An extensive needleleaf forest in the subarctic regions of North America and Eurasia.
  • Braided channel pattern (braided stream) A stream that consists of a multiplicity of interwoven and interconnected shallow channels separated by low islands of sand, gravel, and other loose debris.
  • Broadleaf trees Trees that have flat and expansive leaves.
  • Butte An erosional remnant of very small surface area and clifflike sides that rises conspicuously above the surroundings.

Geography terms and Definitions starting with C | UPSC – IAS

  • Calcification One of the dominant pedogenic regimes in areas where the principal soil moisture movement is upward because of a moisture deficit. This regime is characterized by a concentration of calcium carbonate (CaCO3) in the B horizon, forming a hardpan.
  • Caldera Large, steep-sided, roughly circular depression resulting from the explosion and/or collapse of a large volcano. capacity (stream capacity) The maximum load that a stream can transport under given conditions.
  • Capacity (water vapor capacity) Maximum amount of water vapor that can be present in the air at a given temperature.
  • Capillarity The action by which water can climb upward in restricted confinement as a result of its high surface tension, and thus the ability of its molecules to stick closely together.
  • Carbonation A process in which carbon dioxide in water reacts with carbonate rocks to produce a very soluble product (calcium bicarbonate), which can readily be removed by runoff or percolation, and which can also be deposited in crystalline form if the water is evaporated.
  • Carbon cycle The change from carbon dioxide to living matter and back to carbon dioxide.
  • Carbon dioxide CO2 (Greenhouse) – minor gas in the atmosphere; one of the greenhouse gases; by-product of combustion and respiration.
  • Cation exchange capacity (CEC) Capability of soil to attract and exchange cations.
  • Cavern Large opening or cave, especially in limestone; often decorated with speleothems.
  • Chemical weathering The chemical decomposition of rock by the alteration of rock-forming minerals.
  • Chinook A localized downslope wind of relatively dry and warm air, which is further warmed adiabatically as it moves down the leeward slope of the Rocky Mountains.
  • Chlorofluorocarbons (CFCs) Synthetic chemicals commonly used as refrigerants and in aerosol spray cans; destroy ozone in the upper atmosphere.
  • C horizon Lower soil layer composed of weathered parent material that has not been significantly affected by translocation or leaching.
  • Cinder cone Small, common volcano that is composed primarily of pyroclastic material blasted out from a vent in small but intense explosions. The structure of the volcano is usually a conical hill of loose material.
  • Circle of illumination The edge of the sunlit hemisphere that is a great circle separating Earth into a light half and a dark half.
  • Cirque A broad amphitheater hollowed out at the head of a glacial valley by glacial erosion and frost wedging.
  • Cirque glacier A small glacier confined to its cirque and not moving down-valley.
  • Cirrus cloud High cirriform clouds of feathery appearance.
  • Clay Very small inorganic particles produced by chemical alteration of silicate minerals.
  • Climate An aggregate of day-to-day weather conditions and weather extremes over a long period of time, usually at least 30 years.
  • Climax vegetation A stable plant association of relatively constant composition that develops at the end of a long succession of changes.
  • Climograph (climatic diagram) Chart showing the average monthly temperature and precipitation for a weather station.
  • Cloud Visible accumulation of tiny liquid water droplets or ice crystals suspended in the atmosphere.
  • Col A pass or saddle through a ridge produced when two adjacent glacial cirques on opposite sides of a divide are cut back enough to remove part of the arête between them.
  • Cold front The leading edge of a cool air mass actively displacing warm air.
  • Collapse sinkhole A sinkhole produced by the collapse of the roof of a subsurface cavern; a collapse doline.
  • Colloids Organic and inorganic microscopic particles of soil that represent the chemically active portion of particles in the soil.
  • Competence (stream competence) The size of the largest particle that can be transported by a stream.
  • Composite volcano Volcanoes with the classic symmetrical, cone-shaped peak, produced by a mixture of lava outpouring and pyroclastic explosion; also stratovolcano.
  • Compromise map projection A map projection that is neither conformal or equivalent, but a balance of those, or other, map properties.
  • Condensation Process by which water vapor is converted to liquid water; a warming process because latent heat is released.
  • Condensation nuclei Tiny atmospheric particles of dust, bacteria, smoke, and salt that serve as collection centers for water molecules.
  • Conduction The movement of energy from one molecule to another without changing the relative positions of the molecules. It enables the transfer of heat between different parts of a stationary body.
  • Cone of depression The phenomenon whereby the water table has sunk into the approximate shape of an inverted cone in the immediate vicinity of a well as the result of the removal of a considerable amount of groundwater.
  • Conformal map projection A projection that maintains proper angular relationships over the entire map; over limited areas shows the correct shapes of features shown on a map.
  • Conic projection A family of maps in which one or more cones is set tangent to, or intersecting, a portion of the globe and the geographic grid is projected onto the cone(s).
  • Contact metamorphism Metamorphism of surrounding rocks by contact with magma.
  • Continental drift Theory that proposed that the present continents were originally connected as one or two large landmasses that have broken up and drifted apart over the last several hundred million years.
  • Continental ice sheet Large ice sheet covering a portion of a continental area.
  • Continental rift valley Fault-produced valley resulting from spreading or rifting of continent.
  • Controls of weather and climate The most important influences acting upon the elements of weather and climate.
  • Convection Energy transfer through the vertical circulation and movement of fluids, such as air, due to density differences.
  • Convection cell Closed pattern of convective circulation.
  • Convective lifting Air lifting with showery precipitation resulting from convection.
  • Convergent [plate] boundary Location where two lithospheric plates collide.
  • Convergent lifting Air lifting as a result of wind convergence.
  • Coriolis effect (Coriolis force) The apparent deflection of free-moving objects to the right in the Northern Hemisphere and to the left in the Southern Hemisphere, in response to the rotation of Earth.
  • Creep (soil creep) The slowest and least perceptible form of mass wasting, which consists of a very gradual downhill movement of soil and regolith.
  • Crust The outermost solid layer of Earth.
  • Cryosphere Subsphere of the hydrosphere that encompasses water frozen as snow or ice.
  • Cultural geography The study of the human and/or cultural elements of geography.
  • Cumulonimbus cloud Tall cumulus cloud associated with rain, thunderstorms, and other kinds of severe weather such as tornadoes and hurricanes.
  • Cumulus cloud Puffy white cloud that forms from rising columns of air.
  • Cutoff meander A portion of an old meandering stream course left isolated from the present stream channel because the narrow meander neck has been cut through by stream erosion.
  • Cyclone Low-pressure center.
  • Cylindrical projection A family of maps derived from the concept of projection onto a paper cylinder that is tangential to, or intersecting with, a globe.

Geography terms and Definitions starting with D | UPSC – IAS

  • Daylight-saving time Shifting of clocks forward one hour.
  • Debris flow Stream-like flow of dense, muddy water heavily laden with sediments of various sizes; a mudflow containing large boulders.
  • December solstice Day of the year when the vertical rays of the Sun strike the Tropic of Capricorn; on or about December 21; winter solstice in the Northern Hemisphere.
  • Deciduous tree A tree that experiences an annual period in which all leaves die and usually fall from the tree, due either to a cold season or a dry season.
  • Decomposers Mainly microscopic organisms such as bacteria that decompose dead plant and animal matter.
  • Deflation The shifting of loose particles by wind blowing them into the air or rolling them along the ground.
  • Delta A landform comprised of alluvium at the mouth of a river produced by the sudden reduction of a stream’s velocity and the resulting deposition of the stream’s load.
  • Dendritic drainage pattern A treelike, branching pattern that consists of a random merging of streams, with tributaries joining larger streams irregularly, but always at acute angles; generally develops in regions where the underlying structure does not significantly control the drainage pattern.
  • Dendrochronology Study of past events and past climate through the analysis of tree rings.
  • Denitrification The conversion of nitrates into free nitrogen in the air.
  • Denudation The total effect of all actions (weathering, mass wasting, and erosion) that lower the surface of the continents.
  • Desert Climate, landscape, or biome associated with extremely arid conditions.
  • Desert pavement Hard and relatively impermeable desert surface of tightly packed small rocks.
  • Desert varnish A dark shiny coating of iron and manganese oxides that forms on rock surfaces exposed to desert air for a long time.
  • Dew The condensation of beads of water on relatively cold surfaces.
  • Dew point temperature (dew point) The critical air temperature at which water vapor saturation is reached.
  • Differential weathering and erosion The process whereby different rocks or parts of the same rock weather and/or erode at different rates.
  • Digital elevation model (DEM) Computer-generated shaded-relief image of a landscape derived from a database of precise elevation measurements.
  • Dike A vertical or nearly vertical sheet of magma that is thrust upward into preexisting rock.
  • Disappearing stream Stream that abruptly disappears from the surface where it flows into an underground cavity; common in karst regions.
  • Dissolution Removal of bedrock through chemical action of water; includes removal of subsurface rock through action of groundwater.
  • Dissolved load The minerals, largely salts, that are dissolved in water and carried invisibly in solution.
  • Divergent [plate] boundary Location where two lithospheric plates spread apart.
  • Doldrums Belt of calm air associated with the region between the trade winds of the Northern and Southern hemispheres, generally in the vicinity of the equator. The region of the intertropical convergence zone (ITCZ).
  • Downcutting Action of stream to erode a deeper channel; occurs when stream is flowing swiftly and/or flowing down a steep slope.
  • Drainage basin An area that contributes overland flow and groundwater to a specific stream (also called a watershed or catchment).
  • Drainage divide The line of separation between runoff that descends into two different drainage basins.
  • Drift (glacial drift) All material carried and deposited by glaciers.
  • Drumlin A low, elongated hill formed by ice-sheet deposition and erosion. The long axis is aligned parallel with the direction of ice movements, with the blunt, steeper end facing the direction from which the ice came.
  • Dry adiabatic rate (dry adiabatic lapse rate) The rate at which a parcel of unsaturated air cools as it rises (10°C per 1000 meters [5.5°F per 1000 feet]).
  • Dynamic high High-pressure cell associated with prominently descending air.
  • Dynamic low Low-pressure cell associated with prominently rising air.

Geography terms and Definitions starting with E | UPSC – IAS

  • Earthflow Mass wasting process in which a portion of a water-saturated slope moves a short distance downhill.
  • Earthquake Vibrations generated by abrupt movement of Earth’s crust.
  • Easterly wave A long but weak migratory low-pressure trough in the tropics.
  • Ebb tide A periodic falling of sea level during a tidal cycle.
  • Ecosystem The totality of interactions among organisms and the environment in the area of consideration.
  • Ecotone The transition zone between biotic communities in which the typical species of one community intermingle with those of another.
  • Edaphic factors Having to do with soil.
  • E horizon A light-colored, eluvial layer that usually occurs between the A and B horizons.
  • Electromagnetic radiation Flow of energy in the form of electromagnetic waves; radiant energy.
  • Electromagnetic spectrum Electromagnetic radiation, arranged according to wavelength.
  • Elements of weather and climate The basic ingredients of weather and climate—temperature, pressure, wind, and moisture.
  • Elevation contour line (contour line) A line on a map joining points of equal elevation.
  • El Niño Periodic atmospheric and oceanic phenomenon of the tropical Pacific that typically involves the weakening or reversal of the trade winds and the warming of surface water off the west coast of South America.
  • Eluviation The process by which gravitational water picks up fine particles of soil from the upper layers and carries them downward.
  • Endemic Organism found only in a particular area.
  • Endothermic [animal] Warm-blooded animal.
  • Energy The ability to do work; anything that has the ability to change the state or condition of matter.
  • Enhanced Fujita Scale Classification scale of tornado strength, with EF-0 being the weakest tornadoes and EF-5 being the most powerful.
  • ENSO (El Niño/Southern Oscillation) Linked atmospheric and oceanic phenomenon of pressure and water temperature. Southern Oscillation refers to a periodic seesaw of atmospheric pressure in the tropical southern Pacific Ocean basin. Also see El Niño.
  • Entisol The least developed of all soil orders, with little mineral alteration and no pedogenic horizons.
  • Entrenched meanders A winding, sinuous stream valley with abrupt sides; possible outcome of the rejuvenation of a meandering stream.
  • Environmental lapse rate The observed vertical temperature gradient of the troposphere.
  • Ephemeral stream A stream that carries water only during the “wet season” or during and immediately after rains.
  • Epicenter Location on the surface directly above the center of fault rupture during an earthquake.
  • Equator The parallel of 0° latitude.
  • Equilibrium line A theoretical line separating the ablation zone and accumulation zone of a glacier along which accumulation exactly balances ablation.
  • Equivalent map projection A projection that maintains constant area (size) relationships over the entire map; also called an equal area projection.
  • Erg “Sea of sand.” A large area covered with loose sand, generally arranged in some sort of dune formation by the wind.
  • Erosion Detachment, removal and transportation of fragmented rock material.
  • Esker Long, sinuous ridge of stratified glacial drift composed largely of glaciofluvial gravel and formed by the choking of subglacial streams during a time of glacial stagnation.
  • Eustatic sea-level change Change in sea level due to an increase or decrease in the amount of water in the world ocean; also known as eustasy.
  • Evaporation Process by which liquid water is converted to gaseous water vapor; a cooling process because latent heat is stored.
  • Evapotranspiration The transfer of moisture to the atmosphere by transpiration from plants and evaporation from soil and plants.
  • Evergreen tree A tree or shrub that sheds its leaves on a sporadic or successive basis but at any given time appears to be fully leaved.
  • Exfoliation Weathering process in which curved layers peel off bedrock in sheets. This process commonly occurs in granite and related intrusive rocks after overlying rock has been removed, allowing the body to expand slightly. Also referred to as unloading.
  • Exfoliation dome A large rock mass with a surface configuration that consists of imperfect curves punctuated by several partially fractured shells of the surface layers; result of exfoliation.
  • Exotic species (exotics) Organisms that are introduced into “new” habitats in which they did not naturally occur.
  • Exotic stream A stream that flows into a dry region, bringing its water from somewhere else.
  • External [geomorphic] processes Destructive processes that serve to denude or wear down the landscape. Includes weathering, mass wasting, and erosion.
  • Extrusive igneous rock Igneous rock formed on the surface of Earth; also called volcanic rock.
  • Eye (eye of tropical cyclone) The non-stormy center of a tropical cyclone, which has a diameter of 16 to 40 kilometers (10 to 25 miles) and is a singular area of calmness in the maelstrom that whirls around it.

Geography terms and Definitions starting with F | UPSC – IAS

  • Fall Mass wasting process in which pieces of weathered rock fragments fall to the bottom of a cliff or steep slope; also called rockfall.
  • Fault A fracture or zone of fracture where the rock structure is forcefully broken and one side is displaced relative to the other. The movement can be horizontal or vertical, or a combination of both.
  • Fault-block mountain (tilted-fault-block mountain) A mountain formed where a surface block is faulted and relatively upthrown on one side without any faulting or uplift on the other side. The block is tilted asymmetrically, producing a steep slope along the fault scarp and a relatively gentle slope on the other side of the block.
  • Fault scarp Cliff formed by faulting.
  • Fauna Related to Animals.
  • Field capacity The maximum amount of water that can be retained in the soil after the gravitational water has drained away.
  • Fjord A glacial trough that has been partly drowned by the sea.
  • Flood basalt A large-scale outpouring of basaltic lava that may cover an extensive area of Earth’s surface.
  • Floodplain A flattish valley floor covered with stream-deposited sediments (alluvium) and subject to periodic or episodic inundation by overflow from the stream.
  • Flood tide The movement of ocean water toward the coast in a tidal cycle—from the ocean’s lowest surface level the water rises gradually for about 6 hours and 13 minutes.
  • Flora Related to Plants.
  • Fluvial processes Processes involving the work of running water on the surface of Earth.
  • Foehn a hot southerly wind on the northern slopes of the Alps.(Europe)
  • Fog A cloud whose base is at or very near ground level.
  • Folding The bending of crustal rocks by compression and/or uplift.
  • Food chain Sequential predation in which organisms feed upon one another, with organisms at one level providing food for organisms at the next level, and so on. Energy is thus transferred through the ecosystem.
  • Food pyramid A conceptualization of energy transfer through the ecosystem from large numbers of “lower” forms of life through succeedingly smaller numbers of “higher” forms, as the organisms at one level are eaten by the organisms at the next higher level. Also see food chain.
  • Forest An assemblage of trees growing closely together so that their individual leaf canopies generally overlap.
  • Fractional scale (fractional map scale) Ratio of distance measured on a map and the actual distance that represents on Earth’s surface, expressed as a ratio or fraction; assumes that the same units of measure are used on the map and on Earth’s surface.
  • Friction layer Zone of the atmosphere, between Earth’s surface and an altitude of about 1000 meters (3300 feet), where most frictional resistance to air flow is found.
  • Fringing reef A coral reef built out laterally from the shore, forming a broad bench that is only slightly below sea level, often with the tops of individual coral “heads” exposed to the open air at low tide.
  • Front A sharp zone of discontinuity between unlike air masses.
  • Frontal lifting The forced lifting of air along a front.
  • Frost wedging Fragmentation of rock due to expansion of water that freezes into ice within rock openings.
  • Fumarole A hydrothermal feature consisting of a surface crack that is directly connected with a deep-seated source of heat. The little water that drains into this tube is instantly converted to steam by heat and gases, and a cloud of steam is then expelled from the opening.
  • Funnel cloud Funnel-shaped cloud extending down from a cumulonimbus cloud; a tornado is formed when the funnel cloud touches the surface.

Geography terms and Definitions starting with G | UPSC – IAS

  • Gelisol Soil order that develops in areas of permafrost.
  • Geographic information systems (GIS) Computerized systems for the capture, storage, retrieval, analysis, and display of spatial (geographic) data.
  • Geomorphology The study of the characteristics, origin, and development of landforms.
  • Geostrophic wind A wind that moves parallel to the isobars as a result of the balance between the pressure gradient force and the Coriolis effect.
  • Geyser A specialized form of intermittent hot spring with water issuing only sporadically as a temporary ejection, in which hot water and steam are spouted upward for some distance.
  • Glacial erratic Outsize boulder included in the glacial till, which may be very different from the local bedrock.
  • Glacial flour Rock material that has been ground to the texture of very fine talcum powder by glacial action.
  • Glacial plucking Action in which rock fragments beneath the ice are loosened and grasped by the freezing of meltwater in joints and fractures, and then pried out and dragged along in the general flow of a glacier. Also called glacial quarrying.
  • Glacial steps Series of level or gently sloping bedrock benches alternating with steep drops in the down-valley profile of a glacial trough.
  • Glacial trough A valley reshaped by an alpine glacier, usually U-shaped.
  • Glaciofluvial deposition The action whereby rock debris that is carried along by glaciers is eventually deposited or redeposited by glacial meltwater.
  • Gleization The dominant pedogenic regime in areas where the soil is saturated with water most of the time due to poor drainage.
  • Global conveyer-belt circulation Slowly moving circulation of deep ocean water that forms a continuous loop from the North Atlantic to the Antarctic, into the Indian and Pacific Oceans, and back into the North Atlantic.
  • Global Positioning System (GPS) A satellite-based system for determining accurate positions on or near Earth’s surface.
  • Global warming Popular name given to the recent warming of Earth’s climate due to human-released greenhouse gases.
  • Graben A block of land bounded by parallel faults in which the block has been downthrown, producing a distinctive structural valley with a straight, steep-sided fault scarp on either side.
  • Gradient Elevation change of a stream over a given distance.
  • Granite The most common and well-known plutonic (intrusive) rock; coarse-grained rock consisting of both dark- and light-colored minerals; forms from felsic (relatively high silica content) magma.
  • Graphic scale (graphic map scale) The use of a line marked off in graduated distances as a map scale.
  • Grassland Plant association dominated by grasses and forbs.
  • Great circle Circle on a globe formed by the intersection of Earth’s surface with any plane that passes through Earth’s center.
  • Greenhouse effect The warming in the lower troposphere because of differential transmissivity for shortwave and longwave radiation through the greenhouse gases in the atmosphere; the atmosphere easily transmits shortwave radiation from the Sun but inhibits the transmission of longwave radiation from the surface.
  • Greenhouse gases Gases with the ability to transmit incoming shortwave radiation from the Sun but absorb outgoing longwave terrestrial radiation. The most important natural greenhouse gases are water vapor and carbon dioxide.
  • Greenwich Mean Time (GMT) Time in the Greenwich time zone. Today more commonly called UTC or Universal Time Coordinated
  • Groin A short wall built perpendicularly from the beach into the shore zone to interrupt the longshore current and trap sand.
  • Ground moraine A moraine consisting of glacial till deposited widely over a land surface beneath an ice sheet.
  • Groundwater Water found underground in the zone of saturation.
  • Gymnosperms Seed re-producing plants that carry their seeds in cones; “naked seeds.”

Geography terms and Definitions starting with H | UPSC – IAS

  • Hadley cells Two complete vertical convective circulation cells between the equator, where warm air rises in the ITCZ, and 25° to 30° of latitude, where much of the air subsides into the subtropical highs.
  • Hail Rounded or irregular pellets or lumps of ice produced in cumulonimbus clouds as a result of active turbulence and vertical air currents. Small ice particles grow by collecting moisture from supercooled cloud droplets.
  • Hamada A barren desert surface of consolidated material that usually consists of exposed bedrock but is sometimes composed of sedimentary material that has been cemented together by salts evaporated from groundwater.
  • Hanging valley (hanging trough) A tributary glacial trough, the bottom of which is considerably higher than the bottom of the principal trough that it joins.
  • Headward erosion Erosion that cuts into the interfluve at the upper end of a gully or valley.
  • Heat Energy that transfers from one object or substance to another because of a difference in temperature. Sometimes the term thermal energy is used interchangeably with the term heat.
  • High [pressure cell] Area of relatively high atmospheric pressure.
  • Highland climate High mountain climate where altitude is dominant control. Designated H in Köppen system.
  • Highland ice field Largely unconfined ice sheet in high mountain area.
  • Histosol A soil order characterized by organic, rather than mineral, soils, which is invariably saturated with water all or most of the time.
  • Horizon (soil horizon) The more or less distinctly recognizable layer of soil, distinguished from one another by differing characteristics and forming a vertical zonation of the soil.
  • Horn A steep-sided, pyramidal rock pinnacle formed by expansive glacial plucking and frost wedging of the headwalls where three or more cirques intersect.
  • Horse latitudes Areas in the subtropical highs characterized by warm sunshine and an absence of wind.
  • Horst A relatively uplifted block of land between two parallel faults.
  • Hot spot An area of volcanic activity within the interior of a lithospheric plate associated with magma rising up from the mantle below.
  • Hot spring Hot water at Earth’s surface that has been forced upward through fissures or cracks by the pressures that develop when underground water has come in contact with heated rocks or magma beneath the surface.
  • Humid continental climate Severe mid-latitude climate characterized by hot summers, cold winters, and precipitation throughout the year.
  • Humid subtropical climate Mild mid-latitude climate characterized by hot summers and precipitation throughout the year.
  • Humus A dark-colored, gelatinous, chemically stable fraction of organic matter on or in the soil.
  • Hurricane A tropical cyclone with wind speeds of 119 km/hr (74 mph; 64 knots) or greater affecting North or Central America.
  • Hydrogen bond Attraction between water molecules in which the negatively charged oxygen side of one water molecule is attracted to the positively charged hydrogen side of another water molecule.
  • Hydrologic cycle A series of storage areas interconnected by various transfer processes, in which there is a ceaseless interchange of moisture in terms of its geographical location and its physical state.
  • Hydrolysis A chemical union of water with another substance to produce a new compound that is nearly always softer and weaker than the original.
  • Hydrophytic adaptations Terrestrial plants adapted to living in very wet environments.
  • Hydrosphere Total water realm of Earth, including the oceans, surface waters of the lands, groundwater, and water held in the atmosphere.
  • Hydrothermal activity The outpouring or ejection of hot water, often accompanied by steam, which usually takes the form of either a hot spring or a geyser.
  • Hydrothermal metamorphism Metamorphism associated with hot, mineral-rich solutions circulating around preexisting rock.

Geography terms and Definitions starting with I | UPSC – IAS

  • Iceberg A great chunk of floating ice that breaks off an ice shelf or the end of an outlet glacier.
  • Ice cap climate Polar climate characterized by temperatures below freezing throughout the year.
  • Ice floe A mass of ice that breaks off from larger ice bodies (ice sheets, glaciers, ice packs, and ice shelves) and floats independently in the sea. This term is generally used with large, flattish, tabular masses.
  • Ice pack The extensive and cohesive mass of floating ice that is found in the Arctic and Antarctic oceans.
  • Ice shelf A massive portion of an ice sheet that projects out over the sea.
  • Igneous intrusion Features formed by the emplacement and cooling of magma below the surface.
  • Igneous rock Rock formed by solidification of molten magma.
  • Illuviation The process by which fine particles of soil from the upper layers are deposited at a lower level.
  • Inceptisol An immature order of soils that has relatively faint characteristics; not yet prominent enough to produce diagnostic horizons.
  • Inclination [of Earth’s axis] The tilt of Earth’s rotational axis relative to its orbital plane (the plane of the ecliptic).
  • Infrared [radiation] Electromagnetic radiation in the wavelength range of about 0.7 to 1000 micrometers; wavelengths just longer than visible light.
  • Inner core The solid, dense, innermost portion of Earth, believed to consist largely of iron and nickel.
  • Inselberg “Island mountain”; isolated summit rising abruptly from a low-relief surface.
  • Insolation Incoming solar radiation.
  • Interfluve The higher land or ridge above the valley sides that separates adjacent valleys; drained by overland flow.
  • Intermittent stream A stream that carries water only part of the time, during the “wet season” or during and immediately after rains.
  • Internal [geomorphic] processes Geomorphic processes originating below the surface; include volcanism, folding, and faulting.
  • International Date Line The line marking a time difference of an entire day from one side of the line to the other. Generally, this line falls on the 180th meridian except where it deviates to avoid separating an island group.
  • International System of measurement (SI) Popularly known as the “metric system” of measurement.
  • Intertropical convergence zone (ITCZ) The region near or on the equator where the northeast trades and the southeast trades converge; associated with rising air of the Hadley cells and frequent thunderstorms.
  • Intrusive igneous rock Igneous rock formed below ground from the cooling and solidification of magma; also called plutonic rock.
  • Invertebrates Animals without backbones.
  • Isobar A line joining points of equal atmospheric pressure.
  • Isohyet A line joining points of equal numerical value of precipitation.
  • Isoline A line on a map connecting points that have the same quality or intensity of a given phenomenon.
  • Isostasy Maintenance of the hydrostatic equilibrium of Earth’s crust; the sinking of the crust as weight is applied and the rising of crust as weight is removed.
  • Isotherm A line joining points of equal temperature.
  • ITCZ The Inter Tropical Convergence Zone, or ITCZ, is a belt of low pressure which circles the Earth generally near the equator where the trade winds of the Northern and Southern Hemispheres come together. It is characterised by convective activity which generates often vigorous thunderstorms over large areas.

Geography terms and Definitions starting with J | UPSC – IAS

  • Jet stream A rapidly moving current of wind in the upper troposphere; jet streams can be thought of as the high-speed “cores” of the high altitude westerly wind flow that frequently meander in a north-south direction over the midlatitudes.
  • Jetty A wall built into the ocean at the entrance of a river or harbor to protect against sediment deposition, storm waves, and currents.
  • Joints Cracks that develop in bedrock due to stress, but in which there is no appreciable movement parallel to the walls of the joint.
  • June solstice Day of the year when the vertical rays of the Sun strike the Tropic of Cancer; on or about June 21; summer solstice in the Northern Hemisphere.

Geography terms and Definitions starting with K | UPSC – IAS

  • karst Topography developed as a consequence of subsurface solution.
  • katabatic wind A wind that originates in cold upland areas and cascades toward lower elevations under the influence of gravity.
  • kettle An irregular depression in a morainal surface created when blocks of stagnant ice eventually melt.
  • kinetic energy The energy of movement.
  • knickpoint A sharp irregularity (such as a waterfall, rapid, or cascade) in a stream-channel profile; also known as a nickpoint.
  • knickpoint migration Upstream shift in location of a knickpoint due to erosion.
  • Köppen climate classification system A climatic classification of the world devised by Wladimir Köppen.

Geography terms and Definitions starting with L | UPSC – IAS

  • lagoon A body of quiet salt or brackish water in an area between a barrier island or a barrier reef and the mainland.
  • lahar Volcanic mudflow; a fast-moving muddy flow of volcanic ash and rock fragments.
  • lakelake is an area filled with water, localized in a basin, that is surrounded by land, apart from any river or other outlet that serves to feed or drain the lake.
  • land breeze Local wind blowing from land to water, usually at night. landform An individual topographic feature, of any size; the term landforms refers to topography.
  • landslide An abrupt and often catastrophic event in which a large mass of rock and/or soil slides bodily downslope in only a few seconds or minutes. An instantaneous collapse of a slope.
  • La Niña Atmospheric and oceanic phenomenon associated with cooler than usual water off the west coast of South America. Sometimes described as the opposite of El Niño.
  • large-scale map A map with a scale that is a relatively large representative fraction and therefore portrays only a small portion of Earth’s surface, but in considerable detail.
  • latent heat Energy stored or released when a substance changes state. For example, evaporation is a cooling process because latent heat is stored and condensation is a warming process because latent heat is released.
  • latent heat of condensation Heat released when water vapor condenses back to liquid form.
  • latent heat of evaporation Energy stored when liquid water evaporates to form water vapor.
  • lateral erosion Erosion that occurs when the principal current of a stream swings laterally from one bank to the other, eroding where the velocity is greatest on the outside bank and depositing alluvium where it is least on the inside bank.
  • lateral moraine Well-defined ridge of unsorted debris (till) built up along the sides of valley glaciers, parallel to the valley walls.
  • laterization The dominant pedogenic regime in areas where temperatures are relatively high throughout the year and which is characterized by rapid weathering of parent material, dissolution of nearly all minerals, and the speedy decomposition of organic matter.
  • latitude Location described as an angle measured north and south of the equator.
  • lava Molten magma that is extruded onto the surface of Earth, where it cools and solidifies.
  • lava dome (plug dome) Dome or bulge formed by the pushing up of viscous magma in a volcanic vent.
  • leaching Process in which dissolved nutrients are transported down in solution and deposited deeper in a soil.
  • lifting condensation level (LCL) The altitude at which rising air cools sufficiently to reach 100 percent relative humidity at the dew point temperature, and condensation begins.
  • lightning A luminous electric discharge in the atmosphere caused by the separation of positive and negative charges associated with cumulonimbus clouds.
  • limiting factor Variable that is important or most important in determining the survival of an organism.
  • linear fault trough Straight-line valley that marks the surface position of a fault, especially a strike-slip fault; formed by the erosion or settling of crushed rock along the trace of a fault.
  • liquefaction Phenomenon observed during an earthquake when water saturated soil or sediments become soft or even fluid during the time of strong ground shaking.
  • lithosphere Tectonic plates consisting of the crust and upper rigid mantle. Also used as a general term for the entire solid Earth (one of the Earth “spheres”).
  • litter The collection of dead plant parts that accumulate at the surface of the soil.
  • loam A soil texture in which none of the three principal soil separates – sand, silt, and clay – dominates the other two.
  • loess A fine-grained, wind-deposited silt. Loess lacks horizontal stratification, and its most distinctive characteristic is its ability to stand in vertical cliffs.
  • longitude Location described as an angle measured (in degrees, minutes, and seconds) east and west from the prime meridian on Earth’s surface.
  • longshore current A current in which water moves roughly parallel to the shoreline in a generally downwind direction; also called a littoral current.
  • longwave radiation Wavelengths of thermal infrared radiation emitted by Earth and the atmosphere; also referred to as terrestrial radiation.
  • low [pressure cell] Area of relatively low atmospheric pressure.
  • loxodrome (rhumb line) A true compass heading; a line of constant compass direction.

Geography terms and Definitions starting with M | UPSC – IAS

  • Magma Molten material below Earth’s surface.
  • Magnitude [of an earthquake] Scale used to describe the relative amount of energy released during an earthquake. Several different magnitude scales are in current use, such as the moment magnitude and the Richter scale.
  • Mantle The portion of Earth beneath the crust and surrounding the core.
  • Mantle plume A plume of mantle magma that rises to, or almost to, Earth’s surface; not directly associated with most lithospheric plate boundaries, but associated with many hot spots.
  • Map A flat representation of Earth at a reduced scale, showing only selected detail.
  • Map projection A systematic representation of all or part of the three dimensional Earth surface on a two-dimensional flat surface. map scale Relationship between distance measured on a map and the actual distance on Earth’s surface.
  • March equinox One of two days of the year when the vertical rays of the Sun strike the equator; every location on Earth has equal day and night; occurs on or about March 20 each year.
  • Marine west coast climate Mild mid-latitude climate characterized by mild temperatures and precipitation throughout the year.
  • Marine terrace A platform formed by marine erosion that has been uplifted above sea level.
  • Marsh Flattish surface area that is submerged in water at least part of the time but is shallow enough to permit the growth of water-tolerant plants, primarily grasses and sedges.
  • Mass wasting The short-distance downslope movement of weathered rock under the direct influence of gravity; also called mass movement.
  • Master joints Major joints that run for great distances through a bedrock structure.
  • Meandering channel pattern (meandering stream channel) Highly twisting or looped stream channel pattern.
  • Meander scar A dry former stream channel meander through which the stream no longer flows.
  • Mechanical weathering The physical disintegration of rock material without any change in its chemical composition; also called physical weathering.
  • Medial moraine A dark band of rocky debris down the middle of a glacier created by the union of the lateral moraines of two adjacent glaciers.
  • Mediterranean climate Mild mid-latitude climate characterized by dry summers and wet winters.
  • Mediterranean woodland and shrub Woodland and shrub plant association found in regions of mediterranean climate.
  • Mercator projection A cylindrical projection mathematically adjusted to attain complete conformality which has a rapidly increasing scale with increasing latitude; straight lines on a Mercator projection are lines of constant compass heading (loxodromes).
  • Meridian An imaginary line of longitude extending from pole to pole, crossing all parallels at right angles, and being aligned in true north– south directions.
  • Mesa A flat-topped, steep-sided hill with a limited summit area.
  • Mesocyclone Cyclonic circulation of air within a severe thunderstorm; diameter of about 10 kilometers (6 miles).
  • Metamorphic rock Rock that was originally something else but has been drastically changed by massive forces of heat, pressure, and/or hydrothermal fluids working on it from within Earth.
  • Mid-latitude anticyclone An extensive migratory high-pressure cell of the midlatitudes that moves generally with the westerlies.
  • Mid-latitude cyclone Large migratory low-pressure system that occurs within the midlatitudes and moves generally with the westerlies. Also called extratropical cyclone and wave cyclone.
  • Mid-latitude deciduous forest Broadleaf forest plant assemblage comprised of mostly deciduous trees.
  • Mid-latitude desert climate Desert climate characterized by warm summers but cold winters.
  • Mid-latitude grassland Grassland plant assemblage in semiarid regions of the midlatitudes; regionally called steppe, prairie, pampa, and veldt.
  • Mid-ocean ridge A lengthy system of deep-sea mountain ranges, generally located at some distance from any continent; formed by divergent plate boundaries on the ocean floor.
  • Milankovitch cycles Combination of long-term astronomical cycles involving Earth’s inclination, precession, and eccentricity of orbit; believed at least partially responsible for major periods of glaciation and deglaciation. Named for Milutin Milankovitch, an early twentieth- century Yugoslavian astronomer, who studied these cycles.
  • Millibar A measure of pressure, consisting of one-thousandth part of a bar, or 1000 dynes per square centimeter (1 dyne is the force needed to accelerate 1 gram of mass 1 centimeter per second per second).
  • Mineral A naturally formed solid inorganic substance that has a specified chemical composition and crystal structure.
  • Modified Mercalli intensity scale Qualitative scale from I to XII used to describe the relative strength of ground shaking during an earthquake.
  • Mohorovicˇic´ discontinuity The boundary between Earth’s crust and mantle. Also known simply as the Moho.
  • Mollisol A soil order characterized by the presence of a mollic epipedon, which is a mineral surface horizon that is dark, thick, contains abundant humus and base nutrients, and retains a soft character when it dries out.
  • Monsoon A seasonal reversal of winds; a general onshore movement in summer and a general offshore flow in winter, with a very distinctive seasonal precipitation regime.
  • Moraine The largest and generally most conspicuous landform feature produced by glacial deposition of till, which consists of irregular rolling topography that rises somewhat above the level of the surrounding terrain.
  • Mountain breeze Downslope breeze from a mountain due to chilling of air on its slopes at night.
  • Mudflow Rapid, downslope movement of a dense mixture of weathered rock and water through or within a valley.
  • Multispectral [remote sensing] A remote sensing instrument that collects multiple digital images simultaneously in different electromagnetic wavelength bands.

Geography terms and Definitions starting with N | UPSC – IAS

  • Natural levee An embankment of slightly higher ground fringing a stream channel in a floodplain; formed by deposition during flood-time.
  • Neap tides The lower-than-normal tidal variations that occur twice a month as the result of the alignment of the Sun and Moon at a right angle to one another.
  • Needleleaf trees Trees adorned with thin slivers of tough, leathery, waxy needles rather than typical leaves.
  • Net primary productivity The net photosynthesis of a plant community over a period of one year, usually measured in the amount of fixed carbon per unit area (kilograms of carbon per square meter per year).
  • Névé Snow granules that have become packed and begin to coalesce due to compression, achieving a density about half as great as that of water; also called firn.
  • Nitrogen cycle An endless series of processes in which nitrogen moves through the environment.
  • Nitrogen fixation Conversion of gaseous nitrogen into forms that can be used by plant life.
  • Normal fault The result of tension (extension) producing a steeply inclined fault plane, with the block of land on one side being pushed up, or upthrown, in relation to the block on the other side, which is downthrown.
  • North Pole Latitude of 90° north.

Geography terms and Definitions starting with O | UPSC – IAS

  • Occluded front A complex front formed when a cold front overtakes a warm front, lifting all of the warm air mass off the ground.
  • Occlusion Process of cold front overtaking a warm front to form an occluded front.
  • Ocean floor core samples Rock and sediment samples removed from ocean floor.
  • Oceanic trench (deep oceanic trench) Deep linear depression in the ocean floor where subduction is taking place.
  • Offset stream A stream course displaced by lateral movement along a fault.
  • O horizon The immediate surface layer of a soil profile, consisting mostly of organic material.
  • Orographic lifting Uplift that occurs when air is forced to rise over topographic barriers.
  • Outcrop Surface exposure of bedrock.
  • Outer core The liquid (molten) shell beneath the mantle that encloses Earth’s inner core.
  • Outwash plain Extensive glaciofluvial feature that is a relatively smooth, flattish alluvial apron deposited beyond recessional or terminal moraines by streams issuing from ice.
  • Overland flow The general movement of unchanneled surface water down the slope of the land surface.
  • Oxbow lake A cutoff meander that initially holds water.
  • Oxidation The chemical union of oxygen atoms with atoms from various metallic elements to form new products, which are usually more voluminous, softer, and more easily eroded than the original compounds.
  • Oxisol The most thoroughly weathered and leached of all soils. This soil order invariably displays a high degree of mineral alteration and profile development.
  • Oxygen cycle The movement of oxygen by various processes through the environment.
  • Oxygen isotope analysis Using the ratio of 16O (oxygen 16) and 18O (oxygen 18) isotopes in compounds such as water and calcium carbonate to infer temperature and other conditions in the past.
  • Ozone A gas composed of molecules consisting of three atoms of oxygen, O3.
  • Ozone layer The layer in the atmosphere between 16 and 40 kilometers (10 and 25 miles) high, where the concentration of ozone is greatest; the ozone layer absorbs much of the incoming ultraviolet solar radiation.

Geography terms and Definitions starting with P | UPSC – IAS

  • Pacific ring of fire Name given to the rim of the Pacific Ocean basin due to widespread volcanic and seismic activity; associated with lithospheric plate boundaries.
  • Paleoclimatology The study of past climates.
  • Paleomagnetism Past magnetic orientation.
  • Pangaea The massive supercontinent that Alfred Wegener first postulated to have existed about 200 million years ago. Pangaea broke apart into several large sections that have continually moved away from one another and that now comprise the present continents.
  • Parallel A line connecting all points of equal latitude; such a line is parallel to all other parallels.
  • Parallelism – The polarity of the Earth’s magnetic field is recorded in igneous rocks, and reversals of the field are thus detectable as “stripes” centered on mid-ocean ridges where the sea floor is spreading, while the stability of the geomagnetic poles between reversals has allowed paleomagnetists to track the past motion of continents.
  • Parent material The source of the weathered fragments of rock from which soil is made; solid bedrock or loose sediments that have been transported from elsewhere by the action of water, wind, or ice.
  • Particulate Composed of distinct tiny particles or droplets suspended in the atmosphere; also known as aerosols.
  • Paternoster lakes A sequence of small lakes found in the shallow excavated depressions or steps within a glacial trough.
  • Patterned ground Polygonal patterns in the ground that develop in areas of seasonally frozen soil and permafrost.
  • Pediment A gently inclined bedrock platform that extends outward from a mountain front, usually in an arid region.
  • Pedogenic regimes Soil-forming regimes that can be thought of as environmental settings in which certain physical/chemical/biological processes prevail.
  • Ped A larger mass or clump that individual soil particles tend to aggregate into and that determines the structure of the soil.
  • Perennial plants (perennials) Plants that can live more than a single year despite seasonal environmental variations.
  • Perennial stream A permanent stream that contains water the year round.
  • Periglacial zone An area of indefinite size beyond the outermost extent of ice advance that was indirectly influenced by glaciation.
  • Perihelion The point in its orbit where Earth is nearest to the Sun (about 147,100,000 kilometers or 91,400,000 miles).
  • Permafrost Permanent ground ice or permanently frozen subsoil.
  • Permeability A soil or rock characteristic in which there are interconnected pore spaces through which water can move.
  • Photochemical smog Form of secondary air pollution caused by the reaction of nitrogen compounds and hydrocarbons to ultraviolet radiation in strong sunlight.
  • Photoperiodism The response of an organism to the length of exposure to light in a 24-hour period.
  • Photosynthesis The basic process whereby plants produce stored chemical energy from water and carbon dioxide and which is activated By sunlight.
  • Physical geography Study of the physical elements of geography.
  • Piedmont zone Zone at the “foot of the mountains.”
  • Piezometric surface The elevation to which groundwater will rise under natural confining pressure in a well.
  • Pinnacle An erosional remnant in the form of a steep-sided spire that has a resistant caprock; normally found in an arid or semiarid environment; also speleothem column.
  • Planar projection (plane projection) A family of maps derived by the perspective extension of the geographic grid from a globe to a plane that is tangent to the globe at some point.
  • Plane of the ecliptic The imaginary plane that passes through the Sun and through Earth at every position in its orbit around the Sun; the orbital plane of Earth.
  • Plant respiration Stored energy in carbohydrates consumed directly by the plant itself; carbohydrates are oxidized, releasing water, carbon dioxide, and heat energy.
  • Plant succession The process whereby one type of vegetation is replaced naturally by another.
  • plastic flow [of glacial ice] Slow, non-brittle flow and movement of ice under pressure.
  • Plateau Flattish erosional platform bounded on at least one side by a prominent escarpment.
  • Plate tectonics A coherent theory of massive lithospheric rearrangement based on the movement of continent-sized plates.
  • Playa Dry lake bed in a basin of interior drainage.
  • Pleistocene Epoch An epoch of the Cenozoic era between the Pliocene and the Holocene; from about 2.6 million to about 11,700 years ago.
  • Pleistocene lakes Large freshwater lakes that formed in basins of interior drainage because of higher rainfall and/or lower evaporation during the Pleistocene.
  • Plug dome Volcano dome or bulge formed by the pushing up of viscous magma in a volcanic vent; also lava dome.
  • Pluton A large, intrusive igneous body.
  • Plutonic rock Igneous rock formed below ground from the cooling and solidification of magma; also called intrusive rock.
  • Pluvial (pluvial effects) Pertaining to rain; often used in connection with a past rainy period.
  • Podzolization The dominant pedogenic regime in areas where winters are long and cold, and which is characterized by slow chemical weathering of soils and rapid mechanical weathering from frost action, resulting in soils that are shallow, acidic, and with a fairly distinctive profile.
  • Polar easterlies A global wind system that occupies most of the area between the polar highs and about 60° of latitude. The winds move generally from east to west and are typically cold and dry.
  • Polar front The contact between unlike air masses in the subpolar low-pressure zone at about 60º N and S.
  • Polar high A high-pressure cell situated over either polar region.
  • Polarity [of Earth’s rotation axis] A characteristic of Earth’s axis wherein it always points toward Polaris (the North Star) at every position in Earth’s orbit around the Sun. Also called parallelism.
  • Porosity The amount of pore space between the soil particles and between the peds, which is a measure of the capacity of the soil to hold water and air.
  • Precipitation Drops of liquid or solid water falling from clouds.
  • Precipitation variability Expected departure from average annual precipitation in any given year.
  • Pressure gradient Change in atmospheric pressure over some horizontal distance.
  • Primary consumer Animals that eat plants as the first stage in a food pyramid or chain.
  • Primary pollutants Contaminants released directly into the air.
  • Prime meridian The meridian passing through the Royal Observatory at Greenwich (England), just east of central London, and from which longitude is measured.
  • Producers Organisms that produce their own food through photosynthesis; plants.
  • Proglacial lake A lake formed when ice flows across or against the general slope of the land and the natural drainage is impeded or completely blocked so that meltwater from the ice becomes impounded against the ice front.
  • Pseudocylindrical projection (elliptical projection) A family of map projections in which the entire world is displayed in an oval shape.
  • Pyroclastic flow High-speed avalanche of hot gases, ash, and rock fragments emitted from a volcano during an explosive eruption; also known as a nuée ardente.
  • Pyroclastics (pyroclastic material) Solid rock fragments thrown into the air by volcanic explosions.

Geography terms and Definitions starting with R | UPSC – IAS

  • Radiant energy It is the energy of electromagnetic waves. The term is most commonly used in the fields of radiometry, solar energy, heating and lighting, but is also used less frequently in other fields (such as telecommunications). radiant energy is the energy of electromagnetic and gravitational radiation. As energy, its SI unit is the joule. The quantity of radiant energy may be calculated by integrating radiant flux with respect to time
  • Radiation The process in which electromagnetic energy is emitted from a body; the flow of energy in the form of electromagnetic waves.
  • Rain The most common and widespread form of precipitation, consisting of drops of liquid water.
  • Rain shadow Area of low rainfall on the leeward side of a mountain range or topographic barrier.
  • Recessional moraine A glacial deposit of till formed during a pause in the retreat of the ice margin.
  • Recurrence interval [of a flood] The probability of a given-size flood occurring in a year; also called the return period.
  • Reflection The ability of an object to repel waves without altering either the object or the waves.
  • Reg A desert surface of coarse material from which all sand and dust have been removed by wind and water erosion. Often referred to as desert pavement or desert armor.
  • Regional metamorphism Widespread subsurface metamorphism of rock as a result of prolonged exposure to heat and high pressure, such as in areas of plate collision or subduction.
  • Regolith A layer of broken and partly decomposed rock particles that covers bedrock.
  • Relative humidity An expression of the amount of water vapor in the air (the water vapor content) in comparison with the maximum amount that could be there if the air were saturated (the capacity). This is a ratio that is expressed as a percentage.
  • Relief The difference in elevation between the highest and lowest points in an area; the vertical variation from mountaintop to valley bottom.
  • Remote sensing Measurement or acquisition of information by a recording device that is not in physical contact with the object under study; instruments used commonly include cameras and satellites.
  • Reverse fault A fault produced from compression, with the upthrown block rising steeply above the downthrown block.
  • Revolution [around the Sun] The orbital movement of Earth around the Sun over the year.
  • R horizon The consolidated bedrock at the base of a soil profile.
  • Ria shoreline An embayed coast with numerous estuaries; formed by the flooding of stream valleys by the sea.
  • Ridge [of atmospheric pressure] Linear or elongated area of relatively high atmospheric pressure.
  • Riparian vegetation Streamside growth, particularly prominent in relatively dry regions, where stream courses may be lined with trees, although no other trees are to be found in the landscape.
  • Roche moutonnée A characteristic glacial landform produced when a bedrock hill or knob is overridden by moving ice. The stoss side is smoothly rounded and streamlined by grinding abrasion as the ice rides up the slope, but the lee side is shaped largely by plucking, which produces a steeper and more irregular slope.
  • Rock Solid material composed of aggregated mineral material.
  • Rock cycle Term given to the long-term “recycling” of mineral material from one kind of rock to another.
  • Rockfall (fall) Mass wasting process in which weathered rock drops to the foot of a cliff or steep slope.
  • Rock glacier An accumulated talus mass that moves slowly but distinctly downslope under its own weight.
  • Rossby wave A very large north–south undulation of the upper-air westerlies and jet stream.
  • Rotation [of Earth] The spinning of Earth around its imaginary north– south axis.
  • Runoff Flow of water from land to oceans by overland flow, streamflow, and groundwater flow.

Geography terms and Definitions starting with S | UPSC – IAS

  • Saffir-Simpson Hurricane Scale Classification system of hurricane strength with category 1 the weakest and category 5 the strongest.
  • Sag pond A pond caused by the collection of water from springs and/or runoff into sunken ground, resulting from the crushing of rock in an area of fault movement.
  • Salina Dry lake bed that contains an unusually heavy concentration of salt in the lake-bed sediment.
  • Saline lake Salt lake; commonly caused by interior stream drainage in an arid environment.
  • Salinity A measure of the concentration of dissolved salts.
  • Salinization One of the dominant pedogenic regimes in areas where principal
  • Soil moisture movement is upward because of a moisture deficit.
  • Salt wedging Rock disintegration caused by the crystallization of salts from evaporating water.
  • Sand dune A mound, ridge, or low hill of loose, windblown sand.
  • Santa Ana winds Name given to dry, usually warm, and often very strong winds blowing offshore in southern California region.
  • Saturated adiabatic rate (saturated adiabatic lapse rate) The diminished rate of cooling, averaging about 6°C per 1000 meters (3.3°F per 1000 feet) of rising air above the lifting condensation level; a result of the latent heat of condensation counteracting some of the adiabatic cooling of rising air.
  • Saturation vapor pressure The maximum pressure that can be exerted by water vapor at a given temperature; the pressure exerted by water vapor when the air is saturated.
  • Scattering The deflection of light waves in random directions by gas molecules and particulates in the atmosphere; shorter wavelengths of visible light are more easily scattered than longer wavelengths.
  • Scree Pieces of weathered rock, especially small pieces, that fall directly downslope; also called talus.
  • Sea breeze A wind that blows from the sea toward the land, usually during the day.
  • Seafloor spreading The pulling apart of lithospheric plates to permit the rise of deep-seated magma to Earth’s surface in midocean ridges.
  • Secondary consumer Animals that eat other animals, as the second and further stages in a food pyramid or chain.
  • Secondary pollutant Pollutants formed in the atmosphere as a consequence of chemical reactions or other processes; for example see photochemical smog.
  • Sediment Small particles of rock debris or organic material deposited by water, wind, or ice.
  • Sediment budget [of a beach] The balance between the sediment being deposited on a beach and the sediment that is being transported away from a beach.
  • Sedimentary rock Rock formed of sediment that is consolidated by the combination of pressure and cementation.
  • Seif (longitudinal) dune Long, narrow desert dunes that usually occur in multiplicity and in parallel arrangement.
  • Sensible temperature The relative apparent temperature that is sensed by a person’s body.
  • Separates The size groups within the standard classification of soil particle sizes.
  • September equinox One of two days of the year when the vertical rays of the Sun strike the equator; every location on Earth has equal day and night; occurs on or about September 22 each year.
  • Shield volcanoes Volcanoes built up in a lengthy outpouring of very fluid basaltic lava. Shield volcanoes are broad mountains with gentle slopes.
  • Shortwave radiation Wavelengths of radiation emitted by the Sun, especially ultraviolet, visible, and short infrared radiation.
  • Shrubland Plant association dominated by relatively short woody plants.
  • Silicate mineral (silicates) A category of minerals composed of silicon and oxygen combined with another element or elements.
  • Sinkhole (doline) A small, rounded depression that is formed by the dissolution of surface limestone, typically at joint intersections.
  • Sinuous channel pattern (sinuous stream channel) Gently curving or winding stream channel pattern.
  • Slip face [of sand dune] Steeper leeward side of a sand dune.
  • Slump A slope collapse slide with rotation along a curved sliding plane.
  • Small-scale map A map whose scale is a relatively small representative fraction and therefore shows a large portion of Earth’s surface in limited detail.
  • Snow Solid precipitation in the form of ice crystals, small pellets, or flakes, which is formed by the direct conversion of water vapor into ice.
  • Soil An infinitely varying mixture of weathered mineral particles, decaying organic matter, living organisms, gases, and liquid solutions. Soil is that part of the outer “skin” of Earth occupied by plant roots.
  • Soil order The highest (most general) level of soil classification in the Soil Taxonomy.
  • Soil profile A vertical cross section from Earth’s surface down through the soil layers into the parent material beneath.
  • Soil Taxonomy The system of soil classification currently in use in the United States. It is genetic in nature and focuses on the existing properties of the soil rather than on environment, genesis, or the properties it would possess under virgin conditions.
  • Soil–water balance The relationship between gain, loss, and storage of soil water.
  • Soil–water budget An accounting that demonstrates the variation of the soil–water balance over a period of time.
  • Solar altitude Angle of the Sun above the horizon.
  • Solifluction A special form of soil creep in tundra areas; associated with summer thawing of the near-surface portion of permafrost, causing the wet, heavy surface material to sag slowly downslope.
  • Solum The true soil that includes only the top four horizons: O, the organic surface layer; A, the topsoil; E, the eluvial layer; and B, the subsoil.
  • Southern Oscillation Periodic “seesaw” of high and low atmospheric pressure between northern Australia and Tahiti; first recognized by Gilbert Walking in the early twentieth century.
  • Specific heat The amount of energy required to raise the temperature of 1 gram of a substance by 1°C. Also called specific heat capacity.
  • Specific humidity A direct measure of water-vapor content expressed as the mass of water vapor in a given mass of air (grams of vapor/ kilograms of air).
  • Speleothem A feature formed by precipitated deposits of minerals on the wall, floor, or roof of a cave.
  • Spit A linear deposit of marine sediment that is attached to the land at one or both ends.
  • Spodosol A soil order characterized by the occurrence of a spodic subsurface horizon, which is an illuvial layer where organic matter and aluminum accumulate, and which has a dark, sometimes reddish, color.
  • Spring tide A time of maximum tide that occurs as a result of the alignment of Sun, Moon, and Earth.
  • Stable [air] Air that rises only if forced.
  • Stalactite A pendant structure hanging downward from a cavern’s roof.
  • Stalagmite A projecting structure growing upward from a cavern’s floor.
  • Star dune Pyramid-shaped sand dune with arms radiating out in three or more directions.
  • Stationary front The common boundary between two air masses in a situation in which neither air mass displaces the other.
  • Storm surge A surge of wind-driven water as much as 8 meters (25 feet) above normal tide level, which occurs when a hurricane advances onto a shoreline.
  • Storm warning Weather advisory issued when a severe thunderstorm or tornado has been observed in an area; people should seek safety immediately.
  • Storm watch Weather advisory issued when conditions are favorable for strong thunderstorms or tornadoes.
  • Strata Distinct layers of sediment or layers in sedimentary rock.
  • Stratified drift Drift that was sorted as it was carried along by the flowing glacial meltwater.
  • Stratosphere Atmospheric layer directly above the troposphere.
  • Stratus clouds Layered, horizontal clouds, often below altitudes of 2 kilometers (6500 feet), which sometimes occur as individual clouds but more often appear as a general overcast.
  • Stream Channeled flow of water, regardless of size.
  • Stream capacity The maximum load that a stream can transport under given conditions.
  • Stream capture (stream piracy) An event where a portion of the flow of one stream is diverted into that of another by natural processes.
  • Stream competence The size of the largest particle that can be transported by a stream.
  • Streamflow Channeled movement of water along a valley bottom.
  • Stream load Solid matter carried by a stream.
  • Stream order Concept that describes the hierarchy of a drainage network.
  • Stream rejuvenation When a stream gains downcutting ability, usually through regional tectonic uplift.
  • Stream terrace Remnant of a previous valley floodplain of a rejuvenated stream.
  • Strike-slip fault A fault produced by shearing, with adjacent blocks being displaced laterally with respect to one another. The movement is mostly or entirely horizontal.
  • Subarctic climate Severe mid-latitude climate found in high latitude continental interiors, characterized by very cold winters and an extreme annual temperature range.
  • Subduction Descent of the edge of an oceanic lithospheric plate under the edge of an adjoining plate.
  • Sublimation The process by which water vapor is converted directly to ice, or vice versa.
  • Subpolar low A zone of low pressure that is situated at about 50° to 60° of latitude in both Northern and Southern Hemispheres (also referred to as the polar front).
  • Subtropical gyres The closed-loop pattern of surface ocean currents around the margins of the major ocean basins; the flow is clockwise in the Northern Hemisphere and counterclockwise in the Southern Hemisphere.
  • Subtropical desert climate A hot desert climate; generally found in subtropical latitudes, especially on the western sides of continents.
  • Subtropical high (STH) Large, semipermanent, high-pressure cells centered at about 30° N and S over the oceans, which have average diameters of 3200 kilometers (2000 miles) and are usually elongated east–west.
  • Supersaturated [air] Air in which the relative humidity is greater than 100 percent but condensation is not taking place.
  • Surface tension Because of electrical polarity, liquid water molecules tend to stick together—a thin “skin” of molecules forms on the surface of liquid water causing it to “bead.”
  • Suspended load The very fine particles of clay and silt that are in suspension and move along with the flow of water without ever touching the streambed.
  • Swallow hole The distinct opening at the bottom of some sinkholes through which surface drainage can pour directly into an underground channel.
  • Swamp A flattish surface area that is submerged in water at least part of the time but is shallow enough to permit the growth of water-tolerant plants—predominantly trees.
  • Swash The cascading forward motion of a breaking wave that rushes up the beach.
  • Swell An ocean wave, usually produced by stormy conditions, that can travel enormous distances away from the source of the disturbance.
  • Symbiosis A mutually beneficial relationship between two organisms.
  • Syncline A simple downfold in the rock structure.

Geography terms and Definitions starting with U | UPSC – IAS

  • Ubac slope A slope oriented so that sunlight strikes it at a low angle and hence is much less effective in heating and evaporating than on the adret slope, thus producing more luxuriant vegetation of a richer diversity.
  • Ultisol A soil order similar to Alfisols, but more thoroughly weathered and more completely leached of bases.
  • Ultraviolet (UV) radiation Electromagnetic radiation in the wavelength range of 0.1 to 0.4 micrometers.
  • Uniformitarianism The concept that the “present is the key to the past” in geomorphic processes. The processes now operating have also operated in the past.
  • Universal Time Coordinated (UTC) or Coordinated Universal Time The world time standard reference; previously known as Greenwich mean time (GMT).
  • Unstable [air] Air that rises without being forced.
  • Upwelling Cold, deep ocean water that rises to the surface where wind patterns deflect surface water away from the coast; especially common along the west coasts of continents in the subtropics and midlatitudes.
  • Urban heat island (UHI) effect Observed higher temperatures measured in urban area compared with the surrounding rural area.
  • Uvala A compound sinkhole (doline) or chain of intersecting sinkholes.

Geography terms and Definitions starting with V | UPSC – IAS

  • Valley That portion of the total terrain in which a stream drainage system is clearly established.
  • Valley breeze Upslope breeze up a mountain due to heating of air on its slopes during the day.
  • Valley glacier A long, narrow feature resembling a river of ice, which spills out of its originating basins and flows down-valley.
  • Valley train A lengthy deposit of glaciofluvial alluvium confined to a valley bottom beyond the outwash plain.
  • Vapor pressure The pressure exerted by water vapor in the atmosphere.
  • Ventifact Rock that has been sandblasted by the wind.
  • Verbal map scale Scale of a map stated in words; also called a word scale.
  • Vertebrates Animals that have a backbone that protects their spinal cord—fishes, amphibians, reptiles, birds, and mammals.
  • Vertical zonation The horizontal layering of different plant associations on a mountainside or hillside.
  • Vertisol A soil order comprising a specialized type of soil that contains a large quantity of clay and has an exceptional capacity for absorbing water. An alternation of wetting and drying, expansion and contraction, produces a churning effect that mixes the soil constituents, inhibits the development of horizons, and may even cause minor irregularities in the surface of the land.
  • Visible light Waves in the electromagnetic spectrum in the narrow band between about 0.4 and 0.7 micrometers in length; wavelengths of electromagnetic radiation to which the human eye is sensitive.
  • Volcanic island arc Chain of volcanic islands associated with an oceanic plate–oceanic plate subduction zone; also simply island arc.
  • Volcanic mudflow A fast-moving, muddy flow of volcanic ash and rock fragments; also called a lahar.
  • Volcanic rock Igneous rock formed on the surface of Earth; also called extrusive rock.
  • Volcanism General term that refers to movement of magma from the interior of Earth to or near the surface.

Geography terms and Definitions starting with W | UPSC – IAS

  • Walker Circulation General circuit of air flow in the southern tropical Pacific Ocean; warm air rises in the western side of the basin (in the updrafts of the ITCZ), flows aloft to the east where it descends into the subtropical high off the west coast of South America; the air then flows back to the west in the surface trade winds. Named for the British meteorologist Gilbert Walker (1868–1958) who first described this circumstance.
  • warm front The leading edge of an advancing warm air mass.
  • waterspout A funnel cloud in contact with the ocean or a large lake; similar to a weak tornado over water.
  • watershed See drainage basin.
  • water table The top of the saturated zone within the ground.
  • water vapor Water in the form of a gas.
  • wave-cut platform Gently sloping, wave-eroded bedrock platform that develops just below sea level; common where coastal cliff is being worn back by wave action; also called wave-cut bench.
  • wave height The vertical distance from wave crest to trough.
  • wavelength The horizontal distance from wave crest to crest or from trough to trough.
  • wave of oscillation Motion of wave in which the individual particles of the medium (such as water) make a circular orbit as the wave form passes through.
  • wave of translation The horizontal motion produced when a wave reaches shallow water and finally “breaks” on the shore.
  • wave refraction Phenomenon whereby waves change their directional trend as they approach a shoreline; results in ocean waves generally breaking parallel with the shoreline.
  • weather The short-term atmospheric conditions for a given time and a specific area.
  • weathering The physical and chemical disintegration of rock that is exposed to the atmosphere.
  • westerlies The great wind system of the midlatitudes that flows basically from west to east around the world in the latitudinal zone between about 30° and 60° both north and south of the equator.
  • wetland Landscape characterized by shallow, standing water all or most of the year, with vegetation rising above the water level.
  • wilting point The point at which plants are no longer able to extract moisture from the soil because the capillary water is all used up or evaporated.
  • wind shear (vertical wind shear) Significant change in wind direction or speed in the vertical dimension.
  • woodland Tree-dominated plant association in which the trees are spaced more widely apart than those of forests and do not have interlacing canopies.

Geography terms and Definitions starting with X | UPSC – IAS

  • Xerophytic adaptations Plants that are structurally adapted to withstand protracted dry conditions.

Geography terms and Definitions starting with Y | UPSC – IAS

  • Yazoo stream A tributary unable to enter the mainstream because of natural levees along the mainstream.

Geography terms and Definitions starting with Z | UPSC – IAS

  • Zone of aeration (vadose zone) The topmost hydrologic zone within the ground, which contains a fluctuating amount of moisture (soil water) in the pore spaces of the soil (or soil and rock).
  • Zone of confined water The third hydrologic zone below the surface of the ground, which contains one or more permeable rock layers (aquifers) into which water can infiltrate and is separated from the zone of saturation by impermeable layers.
  • Zone of saturation (phreatic zone) The second hydrologic zone below the surface of the ground, whose uppermost boundary is the water table. The pore spaces and cracks in the bedrock and the regolith of this zone are fully saturated.
  • Zoogeographic regions Division of land areas of the world into major realms with characteristic fauna.

Golan Heights Dispute | U.S, Israel & Syria | Significance | UPSC – IAS

Golan Heights Issue | U.S and Israel Dispute | Significance | UPSC - IAS

Golan Heights Issue | U.S and Israel Dispute | Significance | UPSC - IAS

Golan Heights Dispute | U.S, Israel and Syria | Significance | UPSC – IAS

The Golan Heights, or simply the Golan, is a region in the Levant, spanning about 1,800 square kilometres. as a geopolitical region, the Golan Heights is the area captured from Syria and occupied by Israel during the Six-Day War, territory which Israel effectively annexed in 1981. This region includes the western two-thirds of the geological Golan Heights and the Israeli-occupied part of Mount Hermon.

Golan Heights Issue

Recently, United states of America, President Donald Trump has announced that the US may recognize Israeli sovereignty over the Golan Heights. The U.S. will be the first country to recognize Israeli sovereignty over the Golan and marks a dramatic shift in U.S. policy.

Timeline of the Golan Heights dispute | UPSC – IAS

  • The Golan Heights were part of Syria until 1967.
  • In 1967, Israel occupied the Golan Heights, West Bank, East Jerusalem, and the Gaza Strip in the 1967 (most of the area) in the Six Day War.
  • Syria tried to regain the Golan Heights during the 1973 Middle East war. Syria was defeated in its attempt and all the effort was thwarted.
  • Both countries signed an armistice in 1974 and a UN observer force has been in place on the ceasefire line since 1974 and the Golan had been relatively quiet since.
  • In 1981, Israel permanently acquired the territory of the Golan Heights and East Jerusalem (which was not recognized Internationally).  An armistice line was established and the region came under Israeli military control.
  • After annexing the Golan Heights, Israel gave the Druze population the option of citizenship, but most rejected it and still identify them as Syrians.
  • In 2000, Israel and Syria held their highest-level talks over a possible return of the Golan and a peace agreement. But the negotiations and subsequent talks failed.
  • The area remained under rebel control until the summer of 2018.
  • Assad’s forces are now back in control of the Syrian side of the Quneitra crossing which reopened in October 2018.

International Recognition of Golan Heights | UPSC – IAS

  • The European Union said its position on the status of the Golan Heights was unchanged and it did not recognize Israeli sovereignty over the area.
  • The Arab League, which suspended Syria in 2011 after the start of its civil war has said the move is “completely beyond international law”.
  • Egypt, which made peace with Israel in 1979, said it still considers the Golan as occupied Syrian territory.
  • India has also not recognized Golan heights as Israel territory and has called for the return of Golan Heights to Syria.
  • The international community regards as disputed territory occupied by Israel whose status should be determined by negotiations between Israel and Syria.
  • Attempts by the international community to bring Israel and Syria for negotiations have failed.

Significance of Golan Heights Dispute | UPSC – IAS

  • The Golan Heights topography provides a natural buffer (Protection against attack) against any military attack from Syria.
  • Golan Heights Natural resources – key source of water for an arid region. Rainwater from the Golan’s catchment feeds into the Jordan River.
  • Naturally fertile soil  and the volcanic soil is used to cultivate vineyards and orchards and raise cattle.

Analysis of Golan Heights Issue | U.S and Israel | UPSC – IAS

U.S. WILL BE THE FIRST COUNTRY TO RECOGNIZE ISRAELI SOVEREIGNTY OVER THE GOLAN

  • U.S. President Donald Trump’s has already recognised as Israel’s capital Jerusalem, a city it captured in parts in the 1948 and 1967 wars and which is claimed by both Israelis and Palestinians.
  • Israel captured Golan, a strategically important plateau beside the Sea of Galilee, from Syria in the 1967 war. Among the territories it captured in the war, Israel has returned only the Sinai Peninsula, to Egypt.
  • It annexed East Jerusalem and Golan Heights and continues to occupy the West Bank and the Gaza Strip.
  • In 1981, as it passed the Golan annexation legislation, the Security Council passed a resolution that said, “the Israeli decision to impose its laws, jurisdiction and administration in the occupied Syrian Golan Heights is null and void and without international legal effect
  • Unlike Egypt in the 1970s, Syria has had neither the military ability nor the international clout to launch a campaign to get its territory back.
  • President Bashar al­ Assad tried to kick­start a United states­ mediated peace process with Israel during the Obama presidency, but it failed to take off.
  • And now, the Syrian government, after fighting eight years of a civil war, is debilitated and isolated, and the United States move is unlikely to trigger any strong response, even from the Arab world.
  • But that is the least of the problems. Mr. Trump’s decision flouts international norms and consensus, and sets a dangerous precedent for nations involved in conflicts.
  • The decision also overlooks the wishes of the in­habitants of the territory. Most of the Druze population that has been living in Golan for generations has resist­ ed Israel’s offer of citizenship and remained loyal to Sy­ria.
  • Mr. Donald Trump is making the possibility of any future peaceful settlement difficult by recognising Israel’s sovereignty, just as he made any future Israeli­ Palestinian settlement complicated with his decision to move the U.S. embassy to Jerusalem from Tel Aviv.
  • The modern interna­tional system is built on sovereignty, and every nation­ state is supposed to be an equal player before interna­tional laws irrespective of its military or economic might.

Kelp Forests and Climate Change | UPSC – IAS

Kelp Forests and Climate Change Map Salinity deforestation UPSC - IAS

Kelp Forests and Climate Change Map Salinity deforestation UPSC - IAS

Kelp Forests and Climate Change | UPSC – IAS

Kelp forests are underwater areas with a high density of kelp. They are recognized as one of the most productive and dynamic ecosystems on Earth. Smaller areas of anchored kelp are called kelp beds. Kelp forests occur worldwide throughout temperate and polar coastal oceans. They are large brown algae seaweeds. They grow in “underwater forests”  in shallow oceans.

Generally speaking, kelps live further from the tropics than coral reefs, mangrove forests, and warm-water seagrass beds.

  • Although kelp forests are unknown in tropical surface waters, a few species have been known to occur exclusively in tropical deep waters.
  • Kelps and coral reefs are composed of algae that grow in the shallow parts of the ocean in warm and sunny waters.
  • However, kelp forest grows in nutrient-rich waters while corals can develop in low nutrient waters.

The environmental factors necessary for kelp to survive include hard substrate (usually rock), high nutrients, clear shallow coastal waters and light.

  • The productive kelp forests tend to be associated with areas of significant oceanographic upwelling.
  • They are known for their high growth rate. Some varieties grow as fast as half a metre a day, ultimately reaching 30 to 80 metres.

Kelp Forest Deforestation | UPSC – IAS

Some of the drivers shifting kelp forests into degraded turf reefs are:-

  • Marine heat waves,
  • Strong storms,
  • Expanding tropical herbivores,
  • Gradual warming temperatures,
  • Invasive species and nutrient pollution

Ocean warming and ocean acidification – can cause changes in the microbiome on the surface of Kelp, leading to disease symptoms like blistering, bleaching and eventually degradation of the kelp’s surface.

  • The proportion of kelp showing signs of bite marks increased from less than 10% in 2002 to more than 70% in 2008, before there was no kelp to measure. At the same time the proportion of tropical fish in the ecosystem increased from less than 10% to more than 30%.
  • This will affect the Kelp ability to photosynthesize and potentially survive.
  • This could impact kelp forests around the world and potentially putting the marine biodiversity at risk, which thrives on these forests.

Significance of Kelp Forests | UPSC – IAS

  • They are considered as Keystone Species and their removal is likely to result in a relatively significant shift in the composition of the community and perhaps in the physical structure of the environment.
  • It provides as an important source of food for many marine species. In some cases, up to 60% of carbon found in coastal invertebrates is attributable to kelp productivity. It may be consumed directly or colonised by bacteria that in turn are preyed upon by consumers. Also, the rich fauna of mobile invertebrates in kelp beds makes this an important habitat in the diet of fish species. They provide a foraging habitat for birds due to the associated and diverse invertebrate and fish communities present.
  • It increases productivity of the near shore ecosystem and dumps carbon into that ecosystem. Kelp primary production results in the production of new biomass, detrital material etc.
  • It slows down the flow of the water which is important in situations where animals are spawning and releasing their larvae.
  • They are natural breakwaters and prevent coastal erosion.
  • They can influence coastal oceanographic patterns and provide many ecosystem services.
  • It is an important source of potash and iodine. Many kelps produce algin, a complex carbohydrate useful in industries such as tire manufacturing, ice-cream industry.

Kelp Forest Salinity | UPSC – IAS

  • Kelp forests are found in cold, nutrient-rich water and are found in the shallow coast. Kelp forests have a very high salinity.
  • They are usually in a water temperature in the 50-65 degree range.
  • Kelp forests are not deeper than 80 feet and almost never shallower than 20 feet.
  • The kelp life can be shorter if winter is longer
  • These brown algae communities live in clear water conditions through which light penetrates easily.

National Mineral Policy 2019 | UPSC – IAS

national mineral policy 2019 upsc IAS

national mineral policy 2019 upsc IAS

National Mineral Policy 2019 | UPSC – IAS

National Mineral Policy 2019 replaces the extant National Mineral Policy 2008 in compliance with the directions of the Supreme Court. The aim of National Mineral Policy 2019 is to have a:- More effective, Meaningful and implementable policy that brings in further transparency, better regulation and enforcement, balanced social and economic growth as well as sustainable mining practices. 

The 2019 policy proposes to grant status of industry to mining activity to boost financing of mining for private sector and for acquisitions of mineral assets in other countries by private sector,

Need of the review of Policy | UPSC – IAS

  • Low rate of growth of Indian Mining sector- with just 1-2 per cent contribution to GDP over the last decade (as opposed to 5 to 6 per cent in major mining economies).
  • Lack of focus on exploration- the production vs import of minerals is in the ratio of 1:10 in India. High import is mainly because of non-availability of raw material for industries. Hence, exploration must be treated as a business and treating it as a startup giving tax holidays, tax benefits etc. to encourage investments for exploration.
  • Lack of incentives with private sector to invest- Companies fear investing in exploring minerals owing to various risks.
  • Need to address illegality in mining- Apparently 102 mining leases in the state of Orissa did not have requisite environmental clearances, approvals under the Forest Act, 1980.
  • Need to address environmental concerns- e.g. in Bellary due to mining operation. Also there is need for reclamation and restoring the mined land.
  • Need to address concerns of intergenerational rights

Salient features of National Mineral Policy 2019 | UPSC – IAS

  • Introduction of Right of First Refusal for reconnaissance permit and prospecting license (RP/PL) holders for encouraging the private sector to take up exploration.
  • Encouragement of merger and acquisition of mining entities and transfer of mining leases
  • Creation of dedicated mineral corridors to boost private sector mining areas.
  • Granting status of industry to mining activity to boost financing of mining for private sector and for acquisitions of mineral assets in other countries by private sector.
  • Long-term import export policy for mineral will help private sector in better planning and stability in business.
  • Rationalize reserved areas given to PSUs which have not been used and to put these areas to auction, which will give more opportunity to private sector for participation.
  • Efforts to harmonize taxes, levies & royalty with world benchmarks to help private sector.
  • Introduces the concept of Intergenerational Equity that deals with the well-being not only of the present generation but also of the generations to come.
  • Constitutes an inter-ministerial body to institutionalize the mechanism for ensuring sustainable development in mining.
  • Incorporation of e-governance- IT enabled systems, awareness and Information campaigns have been incorporate.
  • Focus on using waterways- coastal waterways and inland shipping for evacuation and transportation of minerals.
  • Utilization of the district mineral fund for equitable development of project affected persons and areas.

Cryosphere and Permafrost | Geography | UPSC – IAS

Cryosphere and Permafrost Geography optional The hindu UPSC - IAS PCS

Cryosphere and Permafrost Geography optional The hindu UPSC - IAS PCS

Cryosphere and Permafrost | Geography Optional | UPSC – IAS

The cryosphere is those portions of Earth’s surface where water is in solid form, including sea ice, lake ice, river ice, snow cover, glaciers, ice caps, ice sheets, and frozen ground. Thus, there is a wide overlap with the hydrosphere.

  • Second only to the world ocean as a storage reservoir for moisture is the solid portion of the hydrosphere – the ice of the world, or cryosphere, Although minuscule in comparison with the amount of water in the oceans, the moisture content of ice at any given time is more than twice as large as the combined total of all other types of storage (groundwater, surface waters, soil moisture, atmospheric moisture, and biological water).
  • The ice portion of the hydrosphere is divided between ice on land and ice floating in the ocean, with the land portion being the larger. Ice on land is found as mountain glaciers, ice sheets, and ice caps,
  • Approximately 10 percent of the land surface of Earth is covered by ice. It is estimated that enough water is locked up in this ice to feed all the rivers of the world at their present rate of flow for nearly 900 years.

Oceanic ice has various names, depending on size:

  • Ice pack: An extensive and cohesive mass of floating ice.
  • Ice shelf: A massive portion of a continental ice sheet that projects out over the sea.
  • Ice floe: A large, flattish mass of ice that breaks off from larger ice bodies and floats independently.
  • Iceberg: A chunk of floating ice that breaks off from an ice shelf or glacier.

Because ice has a lower density than that of liquid water, only about 14 percent of the mass of an iceberg is exposed above the water, with about 86 percent below. Despite the fact that some oceanic ice freezes directly from seawater, all forms of oceanic ice are composed almost entirely of freshwater because the salts present in the seawater in its liquid state are not incorporated into ice crystals when that water freezes. The largest ice pack covers most of the surface of the Arctic Ocean;

  • On the other side of the globe, an ice pack fringes most of the Antarctic continent. Both of these packs become greatly enlarged during their respective winters, their areas are essentially doubled by increased freezing around their margins.
  • Sea ice in the Arctic especially has been diminishing over the last 35 years (Because of Climate Change)
  • There are a few small ice shelves in the Arctic, mostly around Greenland, but several gigantic shelves are attached to the Antarctic ice sheet, most notably the Ross Ice Shelf of some 100,000 square kilometers (40,000 square miles). Some Antarctic ice floes are enormous; the largest ever observed was 10 times as large as the state of Rhode Island.

Cryosphere and Permafrost The Hindu

How does the cryosphere affect/impact global climate? | UPSC – IAS

Over the last two decades, because of increasing temperatures, formerly stable ice shelves in Antarctica have broken apart. Since the early 1990s as much as 8000 square kilometers (over 3000 square miles) of Antarctic ice shelves have disintegrated.

  • In 2002, the Larsen-B Ice Shelf on the Antarctic Peninsula disintegrated in less than a month, and the much larger Larsen-C shelf just to the south is showing signs that its mass is being reduced because of increasing water temperatures below it. In 2008, the Wilkins Ice Shelf in Antarctica also began to disintegrate.
  • Dut due to global warming, some of the ice-sheets are getting melt, Thus, presence or absence of snow and ice affects the heating and cooling of Earth’s surface. This influences the entire planet’s energy balance.
  • It plays important role in cooling the air which affects the climate of the regions of Iceland, Greenland, Russia etc
  • The polar region acts as carbon sink and trapped tonnes of carbon inside its soil. If the frozen water form like sea ice, lake ice, river ice, snow cover, glaciers, ice caps, ice sheets, and frozen ground melts then it will release in form of methane (greenhouse gas) – which will act as a catalyst for the global warming.

Permafrost and Thawing of Permafrost | UPSC – IAS

Permafrost is any ground that remains completely frozen – 32°F (0°C) or colder, for at least two years straight.  A relatively small proportion of the world’s ice occurs beneath the land surface as ground ice.

  • This type of ice occurs only in areas where the temperature is continuously below the freezing point, and so it is restricted to high-latitude and high-elevation regions. Most permanent ground ice is permafrost, which is permanently frozen subsoil.
  • It is widespread in northern Canada, Alaska, and Siberia and found in small patches in many high mountain areas. Some ground ice is aggregated as veins of frozen water, but most of it develops as ice crystals in the spaces between soil particles.

Thawing of Permafrost: Why is permafrost melting a problem? | UPSC – IAS

In locations such as the region around the city of Fairbanks in central Alaska, permafrost is widespread just below the surface. During the summer, only the upper 30 to 100 centimeters (12 to 40 inches) of soil thaws in what is called the active layer;

  • Below that is a layer of permanently frozen ground perhaps 50 meters (165 feet) thick. Much of the permafrost found in the high latitude areas of the world has been frozen for at least the last few thousands of years, but as a response to higher average temperatures, it is beginning to thaw.

In just the last 35 years, a warming trend has been observed, bringing the ground temperature in some areas above the melting point of the permafrost. Deep in the permafrost layer where ground still remains frozen, temperatures are rising also. For people accustomed to living in temperate environments, it might seem that having the ground thaw would not be a problem, but such is not the case.

  • As the ground thaws, buildings, roads, pipelines, and airport runways are increasingly destabilized, and transportation and business are likely to be disrupted as a consequence.
  • In areas with poor surface drainage, the degradation of permafrost can lead to what is called wet thermokarst conditions, where the surface subsides and the ground becomes oversaturated with water. In some cases, unpaved roads become impassible.

In the last three decades, the number of days that the Alaska Department of Natural Resources permits oil exploration activity in areas of tundra has been cut in half due to the increasingly soft ground. Along the Beaufort Sea, rising temperatures are thawing permafrost in the coastal bluffs and contributing to more rapid erosion of the coastline.

  • From an average rate of erosion of 6 meters (20 feet) per year between the mid- 1950s and 1970s, the rate jumped to nearly 14 meters (45 feet) per year between 2002 and 2007.
  • The thawing of frozen soils will likely lead to an increase in the activity of microorganisms in the soil. This could in turn increase the rate of decomposition of organic matter long sequestered in the frozen ground.
  • As this organic matter is decomposed by microorganisms, carbon dioxide or methane can be released, perhaps contributing to increasing greenhouse gas concentrations in the atmosphere.

Volcanism, Lava Flows and Volcanic Eruptions | UPSC – IAS

composite volcanoes UPSC IAS

Volcanism, Lava Flows and Volcanic Eruptions | UPSC – IAS

Volcanism or Volcanicity

Volcanism (or igneous processes) is a general term that refers to all the phenomena connected with the origin and movement of molten rock. These phenomena include the well-known explosive volcanic eruptions that are among the most spectacular and terrifying events in all nature, along with much more quiescent events, such as the slow solidification of molten material below the surface.

  • When magma is expelled onto Earth’s surface while still molten, the activity is extrusive and is called volcanism; when magma solidifies below the surface it is referred to as intrusive or plutonic activity and results in intrusive igneous features.

Distribution of Earthquakes and Volcanoes | UPSC – IAS

Areas of volcanism are widespread over the world, but their distribution is uneven. Volcanic activity is primarily associated with plate boundaries.

  • At a divergent boundary, magma wells up from the interior both by eruption from active volcanoes and by flooding out of fissures.
  • At convergent boundaries where subduction of oceanic lithosphere is taking place, volcanoes are formed in association with the generation of magma.

Hot spots are responsible for volcanic and hydrothermal activity in many places such as-

  • Yellowstone,
  • Hawaii, and
  • Galapagos Islands.

Distribution of Earthquakes and Volcanoes UPSC - IAS

Image Explanation:- Distribution of volcanoes known to have erupted at some time in the recent geological past. The Pacific Ring of Fire is quite conspicuous.

It is apparent from Figure that the most notable area of volcanism in the world is around the margin of the Pacific Ocean in the Pacific Ring of Fire also called the Andesite Line because the volcanoes consist primarily of the volcanic rock andesite. About 75 percent of the world’s volcanoes, both active and inactive, are associated with the Pacific Rim.

What is the Pacific Ring of Fire definition and Map | UPSC - IAS

Volcanic Activity and Eruptions | UPSC – IAS

A volcano is considered active if it has erupted at least once within historical times and is considered likely to do so again. There are about 550 active volcanoes in the world. On average, about 15 of them will erupt this week, 55 this year, and perhaps 160 this decade. Moreover, there will be one or two eruptions per year from volcanoes with no historic activity.

  • In addition to surface eruptions on continents and islands, there is a great deal of underwater volcanic activity; indeed, it is estimated that more than three-fourths of all volcanic activity is undersea activity such as at midocean ridge spreading centers. Within the conterminous 48 states prior to the 1980 eruption of Mount St. Helens, there was only one volcano classified as active – Lassen Peak in California, which last erupted in 1917 but still occasionally produces gas and steam.
  • A number of other volcanoes, notably California’s Mount Shasta and Long Valley Caldera, Washington’s Mount Baker and Mount Rainier, and the Yellowstone Caldera show signs of potential activity but have not erupted in recorded time, and there are hundreds of extinct volcanoes, primarily in the West Coast states. Alaska and Hawaii have many volcanoes, both active and inactive.
  • Active volcanoes are relatively temporary features of the landscape. Some may have an active life of only a few years, whereas others are sporadically active for thousands of years. At the other end of the scale, new volcanoes are spawned from time to time.

Three of the more spectacular recent events were :-

  • The birth of Surtsey, which rose out of the sea as a new island above a hot spot off the coast of Iceland in 1964,
  • The eruption of an undersea volcano near Tonga in 2009, and
  • A new island appearing in the Red Sea in December 2011.

Despite the destruction they cause, volcanoes do provide vital services to the planet. Much of the water on Earth today was originally released as water vapor during volcanic eruptions during the early history of our planet.

Magma also contains elements such as- phosphorus, potassium, calcium, magnesium, and sulfur required for plant growth. When this magma is extruded as lava that hardens into rock, the weathering that releases the nutrients into soil may require decades or centuries. When the magma is ejected as ash, however, nutrients can be leached into the soil within months. It is no coincidence that Java, one of the most volcanically active parts of the planet, is also one of the world’s most fertile areas.

Magma Chemistry and Styles of Eruption | UPSC – IAS

Magma (molten mineral material below the surface) extruded onto Earth’s surface is called lava. The ejection of lava into the open air is sometimes volatile and explosive, devastating the area for many kilometers around;  In other cases, it is gentle and quiet, affecting the landscape more gradually. All eruptions, however, alter the landscape because they add new material to Earth’s surface

  • During an explosive volcanic eruption, solid rock fragments, solidified lava blobs, cinders, and dust – collectively called pyroclastic material- as well as gas and steam, may be hurled upward in extraordinary quantities. In some cases, the volcano literally explodes, disintegrating in an enormous self-destructive blast.
  • The supreme  example of such self-destruction within historic times was the final eruption of Krakatau, a volcano that occupied a small island in Indonesia between Sumatra and Java. When it exploded in 1883, the noise was heard 2400 kilometers (1500 miles) away in Australia, and 9 cubic kilometers (2.2 cubic miles) of material was blasted into the air. The island disappeared, leaving only open sea where it had been.
  • The tsunamis (great seismic sea waves) it generated drowned more than 30,000 people, and sunsets in various parts of the world were colored by fine volcanic dust for many months afterward.

The nature of a volcanic eruption is determined largely by the chemistry of the magma that feeds it, although the relative strength of the surface crust and the degree of confining pressure to which the magma is subjected may also be important. The chemical relationships are complex, but the critical component seems to be the relative amount of silica (SiO2) in the magma.

Common magmas include :-

  • Relatively high-silica  felsic magma (which produces the volcanic rock rhyolite and the plutonic rock granite),
  • Intermediate-silica andesitic magma (which produces the volcanic rock andesite and the plutonic rock diorite), and
  • Relatively low-silica mafic magma (which produces the volcanic rock basalt and the plutonic rock gabbro).

Felsic Magmas | UPSC – IAS

In high-silica felsic magmas, long chains consisting of silicate structures can develop even before crystallization of minerals begins, greatly increasing the viscosity (thickness or “stickiness”) of the magma. A high silica content also usually indicates cooler magma in which some of the heavier minerals have already crystallized and a considerable amount of gas has already separated. Some of this gas is trapped in pockets in the magma under great pressure.

Unlike the more fluid lavas, gas bubbles can rise only slowly through viscous felsic magma. As the magma approaches the surface, the confining pressure is diminished and the pent-up gases are released explosively, generating an eruption in which large quantities of pyroclastic material are ejected from the volcano. Any lava flows are likely to be very thick and slow moving.

Mafic Magmas | UPSC – IAS

On the other hand, mafic magma is likely to be hotter and considerably more fluid because of its lower silica content. Dissolved gases can bubble out of very fluid mafic magma much more easily than from viscous felsic magma. The resulting eruptions usually yield a great outpouring of lava, quietly and without explosions or large quantities of pyroclastic material. (Quietly is a descriptive term that is relative and refers to the nonexplosive flow of fluid lava.) The highly active volcanoes of Hawaii erupt in this fashion.

Intermediate Magmas | UPSC – IAS

Volcanoes with intermediate silica content andesitic magmas erupt in a style somewhat between that of felsic and mafic magmas: periodically venting fairly fluid andesitic lava flows and periodically having explosive eruptions of pyroclastic material. Many of the major volcanoes associated with subduction zones are this type.

Lava Flows | UPSC – IAS

Whether originating from a volcanic crater or a crustal fissure, a lava flow spreads outward approximately parallel with the surface over which it is flowing, and this parallelism is maintained as the lava cools and solidifies. Although some viscous flows cling to relatively steep slopes,

  • The vast majority eventually solidify in a horizontal orientation that may resemble the stratification of sedimentary rock, particularly if several flows have accumulated on top of one another.
  • The topographic expression of a lava flow, then, is often a flat plain or plateau.
  • The strata of sequential flows may be exposed by erosion as streams usually incise very steep-sided gullies into lava flows.
  • The character of the flow surface varies with the nature of the lava and with the extent of erosion, but as a general rule the surface of relatively recent lava flows tends to be extremely irregular and fragmented.

Columnar Basalt | UPSC – IAS

One of the most distinctive of all volcanic landscape features commonly develops from flows of fluid lava such as basalt. When such a lava flow cools uniformly, it contracts and forms a distinctive pattern of vertical joints (cracks in the rock), leaving prominent hexagonal columns known as columnar basalt. Devils Postpile near Yosemite National Park in California, and the Giant’s Causeway- or Clochán an Aifir- in Northern Ireland are famous examples of columnar basalt.

Flood Basalt | UPSC – IAS

Many of the world’s most extensive lava flows were not extruded from volcanic peaks but rather issued from fissures associated with hot spots. The lava that flows out of these vents is nearly always basaltic and frequently comes forth in great volume. Many scientists think that the initial consequence of a large mantle plume reaching the surface can be a huge outpouring of lava.
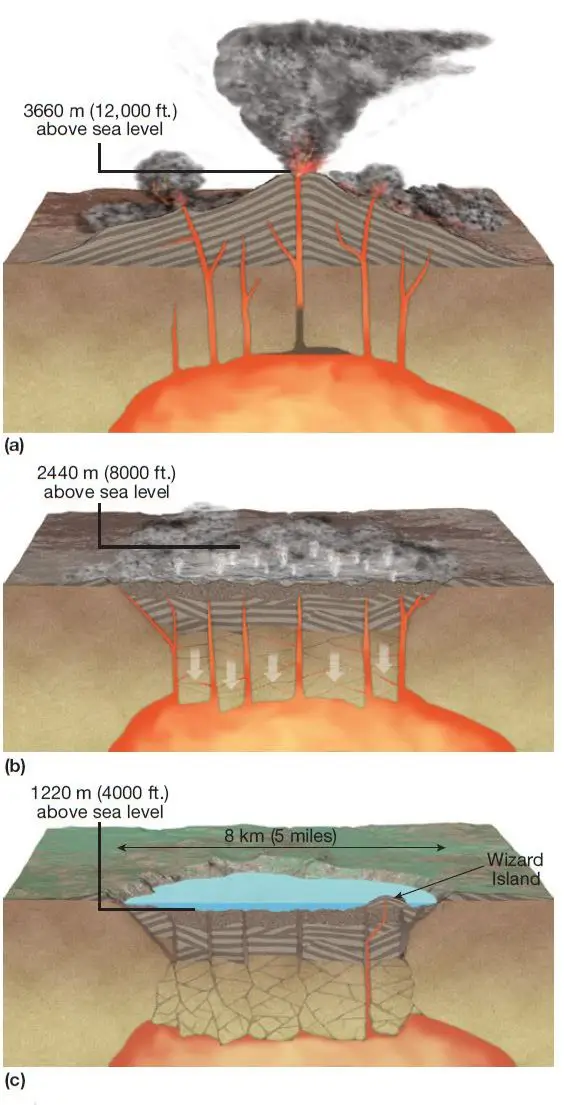
Volcanism, Lava Flows and Volcanic Eruptions: flood basalt deccan traps UPSC - IAS

  • The term flood basalt is applied to the vast accumulations of lava that build up, layer upon layer, sometimes covering tens of thousands of square kilometers to depths of many hundreds of meters.
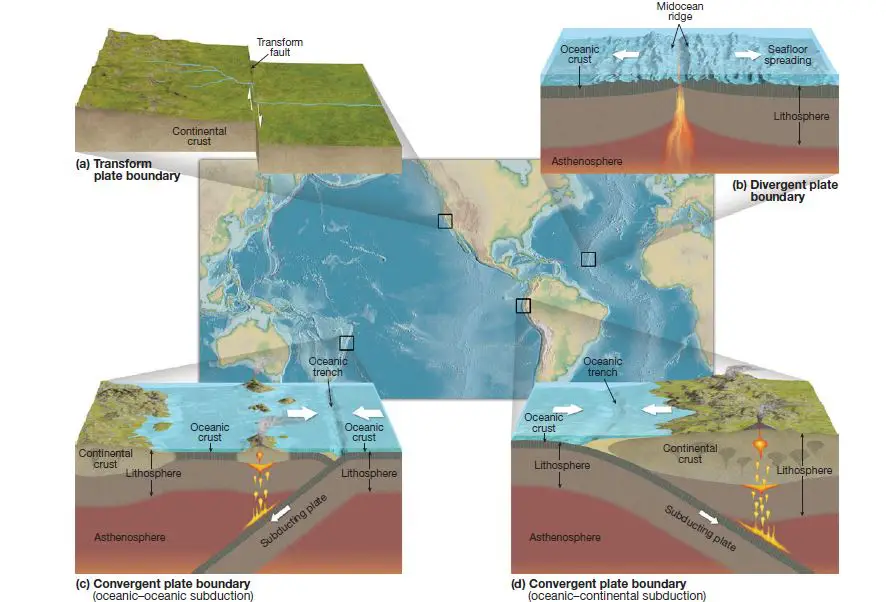
  • A prominent example of flood basalt in the United States is the Columbia Plateau, which covers 130,000 square kilometers (50,000 square miles) in Washington, Oregon, and Idaho.
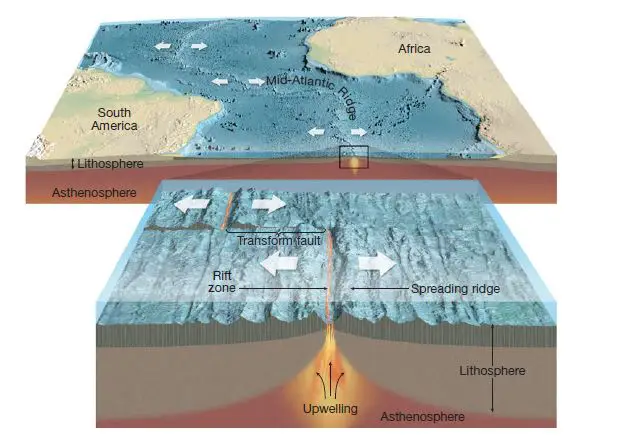
  • Larger outpourings are seen on other continents, most notably the Deccan Traps of India (520,000 square kilometers [200,000 square miles];
  • Trap is derived from the Sanskrit word for “step” in reference to the layers of lava flows found here. Over the world as a whole, more lava has issued quietly from fissures than from the combined outpourings of all volcanoes.

Research indicates that – the timing of several major flood basalt eruptions in the geologic past correlate with mass extinctions of plants and animals – perhaps caused by the environmental disruption brought by the massive lava flows and “out-gassing” (release of volcanic gases) from the eruptions.

For example, some scientists now think that the major extinctions about 65 million years ago that ended the reign of the dinosaurs were as much, or more, a consequence of the flood basalt eruptions of the Deccan Traps than of the asteroid impact that occurred at the same time.

Volcanic Peaks – (Volcanoes names and locations) | UPSC – IAS

Volcanoes are surface expressions of subsurface igneous activity. Often starting small, a volcano may grow into a conspicuous hill or a massive mountain. Many volcanic peaks take the form of a cone that has a symmetrical profile. A common denominator of nearly all volcanic peaks is a crater normally set conspicuously at the apex of the cone. Frequently, smaller subsidiary cones develop around the base or on the side of a principal peak, or even in the crater. Generally, differences in magma, and therefore eruption style, result in different types of volcanic peaks:-

Shield Volcanoes | UPSC – IAS

Basaltic lava tends to flow quite easily over the surrounding surface, forming broad, low-lying shield volcanoes, built up of layer upon layer of solidified lava flows with relatively little pyroclastic material.

  • Some shield volcanoes are massive and very high, but they are never steep-sided

The Hawaiian Islands are composed of numerous shield volcanoes. Produced by the Hawaiian “hot spot,” Mauna Loa on the Big Island of Hawaii is the world’s largest volcano. It is more than 9 kilometers (6 miles) high from its base on the floor of the ocean to the top of its summit. Kıˉlauea, currently the most active of the Hawaiian shield volcanoes, is on the southeast flank of Mauna Loa.


Shield Volcanoes UPSC IAS

Composite Volcanoes | UPSC – IAS

Volcanoes that emit higher silicaintermediate” lavas such as andesite often erupt explosively and tend to develop into symmetrical, steep-sided volcanoes known as composite volcanoes or stratovolcanoes.

  • These mountains build up steep sides by having layers of ejected pyroclastics (ash and cinders) from explosive eruptions alternate with lava flows from nonexplosive eruptions.
  • The pyroclastic material tends to produce the steep slopes, whereas the solidified lava flows hold the pyroclastics together. Famous examples of composite volcanoes include Mt. Fuji in Japan, Mt. Rainier in Washington, and Volcán Popocatépetl near Mexico City.

composite volcanoes UPSC IAS

Lava Domes | UPSC – IAS

Lava domes – also called plug domes – have masses of very viscous lava such as high-silica rhyolite that are too thick and pasty to flow very far. Instead, lava bulges up from the vent, and the dome grows largely by expansion from below and within.

  • The Mono Craters are a chain of young rhyolitic plug domes just to the east of the Sierra Nevada and Yosemite National Park in California – the most recent activity taking place just a few hundred years ago.
  • Lava domes may also develop within the craters of composite volcanoes when viscous lava moves up into the vent. Shortly after the large eruption of Mount St. Helens in 1980, such a lava dome began to develop.

lava domes UPSC IAS

Cinder Cones | UPSC – IAS

Cinder cones are the smallest of the volcanic peaks. Their magma chemistry varies, but basaltic magma is most common.

  • They are cone-shaped peaks built by the unconsolidated pyroclastic materials that are ejected from the volcanic ventThe size of the particles being ejected determines the steepness of the slopes.
  • Tiny particles (“ash”) can support slopes as steep as 35 degrees, whereas the larger ejecta (“cinders”) will produce slopes up to about 25 degrees.
  • Cinder cones are generally less than 450 meters (1500 feet) high and are often found in association with other volcanoes. Lava flows occasionally issue from the same vent that produces a cinder cone.

cinder cones UPSC IAS

Calderas | UPSC – IAS

Uncommon in occurrence but spectacular in result is the formation of a caldera, which is produced when a volcano explodes, collapses, or does both.

  • The result is an immense basin-shaped depression, generally circular, that has a diameter many times larger than that of the original volcanic vent or vents. Some calderas are tens of kilometers in diameter.
  • North America’s most famous caldera is Oregon’s misnamed Crater Lake. Mount Mazama was a composite volcano that reached an estimated elevation of 3660 meters (12,000 feet) above sea level. During a major eruption about 7700 years ago, the walls of Mount Mazama weakened and collapsed as enormous volumes of pyroclastic material were ejected from the volcano.

Formation of Crater Lake, The caldera partially filled with water to form a lake; a new fissure formed the volcano known as Wizard Island

The partial emptying of magma chamber below Mount Mazama may have contributed to this collapse. The final, cataclysmic eruption removed—by explosion and collapse— the upper 1220 meters (4000 feet) of the peak and produced a caldera whose bottom is 1220 meters (4000 feet) below the crest of the remaining rim. Later, half this depth filled with water, creating one of the deepest lakes in North America.

  • A subsidiary volcanic cone has subsequently built up from the bottom of the caldera and now breaks the surface of the lake as Wizard Island. Other major calderas in North America include California’s Long Valley Caldera, and the Yellowstone Caldera in Wyoming.
  • Shield volcanoes may develop summit calderas in a different way. When large quantities of fluid lava are vented from rift zones along the sides of a volcano, the magma chamber below the summit can empty and collapse, forming a relatively shallow caldera.
  • Both Mauna Loa and Kıˉlauea on the Big Island of Hawaii have calderas that formed in this way.

Plate boundaries and Plate movements | UPSC – IAS

Plate boundaries and Plate movements | UPSC - IAS

Plate boundaries and Plate movements | UPSC – IAS

Plates are relatively cold and rigid and therefore deformed significantly only at the edges and only where one plate interacts with another. Most of the “action” in plate tectonics takes place along such plate boundaries.

Three types of plate boundaries are possible:

  • Two plates may diverge from one another (divergent boundary),
  • Converge toward one another (convergent boundary), or
  • Slide laterally past one another (transform boundary).

Plate boundaries and Plate movements | UPSC - IAS

Image Explanation:- Three kinds of plate boundaries. The edges of lithospheric plates slide past each other along transform boundaries such as the San Andreas Fault system in California (a); move apart at divergent boundaries such as continental rift valleys and midocean ridges (b); and come together at convergent boundaries such as oceanic-oceanic plate subduction zones (c), oceanic continental plate subduction zones (d), and continental collision zones.

Divergent Boundaries

At a divergent boundary, magma from the asthenosphere wells up in the opening between plates. This upward flow of molten material produces a line of volcanic vents that spill out basaltic lava onto the ocean floor, with the plutonic rock gabbro solidifying deeper below.

Mid-ocean ridge

A divergent boundary is usually represented by a mid-ocean ridge. Most of the mid-ocean ridges of the world are either active or extinct spreading ridges. Such spreading centers are associated with shallow-focus earthquakes (meaning that the ruptures that generate the earthquakes are within about 70 kilometers [45 miles] of the surface), volcanic activity, and hydrothermal metamorphism—as well as the presence of remarkable marine life-forms thriving in the hostile environment of hydrothermal vents on the ocean floor. Divergent boundaries are “constructive” because material is being added to the crustal surface at such locations.

Plate boundaries and Plate movements | UPSC - IAS

Image Explanation:- Mid-ocean ridge spreading center. Seafloor spreading involves the rise of magma from within Earth and the lateral movement of new ocean floor away from the zone of upwelling. This gradual process moves the older material farther away from the spreading center as it is replaced by newer material from below. Transform faults are found along the short offsets associated with slight bends in the ridge system.

Continental Rift Valleys

Divergent boundaries can also develop within a continent, resulting in a continental rift valley such as the Great East African Rift Valley that extends from Ethiopia southward through Mozambique. The Red Sea is also the outcome of spreading taking place within a continent—in this case the spreading has been great enough to form a “proto-ocean.”

Plate boundaries and Plate movements | UPSC - IAS

Image Explanation:-  (a) A continental rift valley develops where divergence takes place within a continent. As spreading proceeds, blocks of crust drop down to form a rift valley. (b) Ol Doinyo Lengai volcano and the East African Rift Valley in Tanzania

Convergent Boundaries

At a convergent boundary, plates collide and as such are sometimes called “destructive” boundaries because they result in removal or compression of the surface crust. Convergent plate boundaries are responsible for some of the most massive and spectacular of earthly landforms: major mountain ranges, volcanoes, and oceanic trenches. The three types of convergent boundaries are: oceanic–continental convergence, oceanic–oceanic convergence, and continental–continental convergence.

Oceanic–continental Convergence

Because oceanic lithosphere includes dense basaltic crust, it is denser than continental lithosphere, and so oceanic lithosphere always underrides continental lithosphere when the two collide. The dense oceanic plate slowly and inexorably sinks into the asthenosphere in the process of subduction. The subducting slab pulls on the rest of the plate—such “slab pull” is probably the main cause of most plate movement, pulling the rest of the plate in after itself, as it were. Wherever such an oceanic–continental convergent boundary exists, a mountain range is formed on land (the Andes range of South America is one notable example; the Cascades in northwestern North America is another) and a parallel oceanic trench develops as the seafloor is pulled down by the subducting plate.Plate boundaries and Plate movements | UPSC - IAS

Image Explanation:- Idealized portrayals of three kinds of convergent plate boundaries: (a) Where an oceanic plate converges with a continental plate,the oceanic plate is subducted and an oceanic trench and coastal mountains with volcanoes are usually created. (b) Where an oceanic plate subducts beneath another oceanic plate, an oceanic trench and volcanic island arc result. (c) Where a continental plate collides with a continental plate subduction takes place, but mountains are generally thrust upward.

Earthquakes take place along the margin of a subducting plate. Shallow-focus earthquakes are common at the trench, but as the subducting plate descends into the asthenosphere, the earthquakes become progressively deeper, with some subduction zones generating earthquakes as deep as 600 kilometers (375 miles) below the surface. Volcanoes develop from magma generated in the subduction zone. Early researchers thought that a subducted plate would completely melt when pushed down into the hot asthenosphere. However, more recent research indicates that such a result is unlikely. Oceanic crust is relatively cold when it approaches a subduction zone and would take a long time to become hot enough to melt. A more likely explanation is that beginning at a depth of about 100 kilometers (about 60 miles) water is driven off from the oceanic crust as it is subducted, and this water reduces the melting temperature of the mantle rock above, causing it to melt. This magma rises through the overriding plate, producing both extrusive and intrusive igneous rocks. The chain of volcanoes that develops in association with an oceanic–continental plate subduction zone is sometimes referred to as a continental volcanic arc.

Such subduction zone volcanoes frequently erupt explosively. Metamorphic rocks often develop in association with subduction zones. The margin of a subducting oceanic plate is subjected to increasing pressure, although relatively modest heating, as it begins to descend—this can lead to the formation of high-pressure, low-temperature metamorphic rocks, such as blueschist. In addition, the magma generated in the subduction zone may cause contact metamorphism as it rises through the overlying continental rocks.

Plate boundaries and Plate movements | UPSC - IAS

Image explanation:- (a) The collision of the subcontinent of India with Eurasia began about 45 million years ago. (b and c) This collision and continental “suture” has uplifted the Himalayas and the Tibetan Plateau.

Oceanic–oceanic Convergence

If the convergent boundary is between two oceanic plates, subduction also takes place. As one of the oceanic plates subducts beneath the other, an oceanic trench is formed, shallow- and deep-focus earthquakes occur, and volcanic activity is initiated with volcanoes forming on the ocean floor. With time, a volcanic island arc (such as the Aleutian Islands and Mariana Islands) develops; such an arc may eventually become a more mature island arc system (such as Japan and the islands of Sumatra and Java in Indonesia are today).

Plate boundaries and Plate movements | UPSC - IAS

Image explanation:- Earthquake patterns associated with the Tonga Trench subduction zone (show in a map view on the left and a side view on the right). Shallow-focus earthquakes occur where the Pacific Plate begins to subduct at the trench. Intermediate- and deep-focus earthquakes occur as the subducting oceanic plate goes deeper into the asthenosphere below. The Wadati–Benioff Zone is named for seismologists Kigoo Wadati and Hugo Benioff, who were the first scientists to describe these inclined zones of earthquakes.

Continental–continental Convergence:

Where there is a convergent boundary between two continental plates, no subduction takes place because continental crust is too buoyant to subduct. Instead, huge mountain ranges, such as the Alps, are built up. The most dramatic present-day example of continental collision has resulted in the formation of the Himalayas.

The Himalayas began to form more than 45 million years ago, when the subcontinent of India started its collision with the rest of Eurasia. Under the conditions of continental collision, volcanoes are rare, but shallow-focus earthquakes and regional metamorphism are common.

Transform Boundaries

At a transform boundary, two plates slip past one another laterally. This slippage occurs along great vertical fractures called transform faults. Because the plate movement is basically parallel to a transform boundary, these boundaries neither create new crust nor destroy old. Transform faults are associated with a great deal of seismic activity, commonly producing shallow focus earthquakes.

Most transform faults are found along the mid-ocean ridge system, where they form short offsets in the ridge perpendicular to the spreading axis. However, in some places, transform faults extend for great distances, occasionally through continental lithosphere. For example, the most famous fault system in the United States, the San Andreas Fault in California, is on a transform boundary between the Pacific and North American plates 4 – 18

Plate Boundaries Over Geologic Time

Plate tectonics provides us with a grand framework for understanding the extensive lithospheric rearrangement that has taken place during the history of Earth. A brief summary of major events in Earth’s history might highlight the following:

  • Between about 1.1 billion and 800 million years ago—before Pangaea existed—there was an earlier supercontinent, called Rodinia by geologists.
  • By about 700 million years ago, Rodinia was rifting apart into continental pieces that would eventually “suture” (fuse) back together again—first into a large southern continent called Gondwana (which included present-day South America, Africa, India, Australia, and Antarctica), and later into a northern continent called Laurasia (comprised of present-day North America and Eurasia). By about 250 million years ago, Gondwana and Laurasia had joined to form Pangaea.
  • About 200 million years ago, when Pangaea was beginning to rift apart, there was only one largely uninterrupted ocean.
  • By 90 million years ago, continental fragmentation was well under way. The North Atlantic Ocean was beginning to open, and the South Atlantic began to separate South America from Africa. Antarctica is the only continent that has remained near its original position.
  • By 50 million years ago, the North and South Atlantic Oceans had both opened, and South America was a new and isolated continent that was rapidly moving westward. The Andes were growing as South America overrode the Pacific Ocean basin; the Rockies and the ancestral Sierra Nevada had risen in North America.
  • Today, South America has connected with North America. North America has separated from western Eurasia, Australia has split from Antarctica, and India has collided with Eurasia to thrust up the Himalayas. Africa is splitting along the Great Rift Valley and slowly rotating counterclockwise.

Plate boundaries and Plate movements | UPSC - IAS

Plate Motion into the Future

If current plate movement continues, 50 million years into the future Australia will straddle the equator as a huge tropical island. Africa may pinch shut the Mediterranean, and East Africa may become a new large island like Madagascar. The Atlantic will widen while the Pacific will shrink. Southern California—perhaps along with much of the rest of the state—will slide past the rest of North America en route to its ultimate destiny in the Aleutian Trench in the Gulf of Alaska.

One of the great triumphs of the theory of plate tectonics is that it explains broad topographic patterns. It can account for the formation of many cordilleras (groups of mountain ranges), mid-ocean ridges, oceanic trenches, island arcs, and the associated earthquake and volcanic zones. Where these features appear, there are usually plates either colliding or separating. Perhaps nowhere in the world are the consequences of tectonic and volcanic activity associated with plate boundaries more vividly displayed than around the rim of the Pacific Ocean.

Remaining Unanswered Questions 

Plate tectonic theory has advanced our understanding of the internal processes of Earth dramatically. However, a number of questions remain unanswered for the time being. For example, several major mountain ranges in North America and Eurasia are in the middle of plates rather than in boundary zones. Although the genesis of some midplate ranges, such as the Appalachians in North America and the Ural Mountains in Eurasia, can be traced to continental collisions in the geologic past, other midplate mountain ranges or regions of seismic activity are not yet fully understood.

Further, although convection of heated material within the mantle provides the general mechanism for plate movement, the details of heat flow within Earth and the possible relationships of mantle plumes to these overall patterns are still being worked out.

Our present state of knowledge about plate tectonics, however, is ample to provide a firm basis for understanding the patterns of most of the world’s major relief features:-

  • The size, shape, and  distribution of the continents,
  • Major mountain ranges, and
  • Ocean basins.

To understand more localized topographic features, however, we must now turn to less spectacular, but no less fundamental, internal processes that are often directly associated with tectonic movement.

Pacific Ring of Fire or Circum-Pacific Belt | UPSC – IAS

What is the Pacific Ring of Fire definition and Map | UPSC - IAS

Ring of fire world map and Volcanoes

Understanding the Earthquakes and Volcanoes | UPSC – IAS

In order to understand concept of ring of fire,  it is important to first conceptualize the overarching context within which various factors operate.

  • Both earthquakes and volcanoes can be explained by the theory of plate tectonics. The earth’s crust consists of a series of plates. There are seven main plates and many smaller ones. Some plates consist of continental crust others are made of largely oceanic crust.
  • Convectional activity causes the plates to move. The edges of plates are called plate margins. There are three types of plate margins. At a destructive boundary the plates move together, but at a constructive boundary the plates move apart. At a conservative boundary the plates move side by side.
  • At a constructive boundary molten rock or magma rises to the surface forming new crust. This forces the existing crust apart causing sea floor spreading. This causes continental drift. At destructive margins one plate is forced under another into the subduction zone
  • Volcanoes occur where there is a weakness in the earth’s crust. This allows magma to move to the surface where it forms lava. An active volcano is one that has erupted in living memory. A dormant volcano is one that last erupted in historical times. It can never be assumed that a volcano is extinct.
  • Seismic waves, as a result of plate movement, cause earthquakes. The focus of an earthquake is a fault deep in the earth’s crust. The shock waves move out from the focus and reach the earth’s surface at the epicentre. Most earthquakes occur along plate margins.

Read more in Detail –

Importance of Ring of Fire and its Map| UPSC – IAS

circum pacific belt upsc map and earthquakes | UPSC - IAS

The Pacific Ring of Fire is a major area in the basin of the Pacific Ocean where many earthquakes and volcanic eruptions occur. The Ring of Fire also known as the Rim of Fire or the Circum-Pacific belt. It is associated with a nearly continuous series of-:

  • Oceanic trenches,
  • Volcanic arcs,
  • volcanic belts and
  • Plate movements

Why is it called the ring of fire ?

For many decades, geologists noted the high number of earthquakes and active volcanoes occurring around the rim of the Pacific Ocean basin. About three-quarters of all active volcanoes in the world lie within the Pacific Rim, but it was only in the late 1960s that the theory of plate tectonics provided an explanation for this pattern. How many volcanoes are in the ring of fire? – It has 452 volcanoes (more than 75% of the world’s active and dormant volcanoes).

  • Plate boundaries are found all of the way around the Pacific basinprimarily subduction zones, along with segments of transform and divergent boundaries.
  • It is along these plate boundaries that the many volcanoes and earthquakes take place in what is now called the Pacific Ring of Fire.
  • The Pacific Rim is home to millions of people. Active or potentially active volcanoes and major faults systems are within sight of some of the largest metropolitan regions in the world, such as Mexico City, Los Angeles, and Tokyo.

What are the Causes ? | UPSC – IAS

Ring of Fire is a direct result of plate tectonics: the movement and collisions of lithospheric plates. (Ring of Fire is caused by the amount of movement of tectonic plates in the area.) The massive volcanic and seismic activity that characterizes the Ring of Fire results from the activity of the tectonic plates that make up the crust.

  • The eastern section of the ring is the result of the Nazca Plate and the Cocos Plate being subducted beneath the westward-moving South American Plate.
  • The Cocos Plate is being subducted beneath the Caribbean Plate, in Central America. A portion of the Pacific Plate and the small Juan de Fuca Plate are being subducted beneath the North American Plate. Along the northern portion, the northwestward-moving Pacific Plate is being subducted beneath the Aleutian Islands arc.
  • Farther west, the Pacific Plate is being subducted along the Kamchatka Peninsula arcs to the south past Japan. The southern portion is more complex, with a number of smaller tectonic plates in collision with the Pacific Plate from the Mariana Islands, the Philippines, Bougainville, Tonga, and New Zealand; this portion excludes Australia, since it lies in the center of its tectonic plate.
  • Indonesia lies between the Ring of Fire along the northeastern islands adjacent to and including New Guinea and the Alpide belt along the south and west from Sumatra, Java, Bali, Flores, and Timor.

In recent decades we have had many reminders of the ever-active Ring of Fire volcanoes:-

  • 1980 Mount St. Helens eruption;
  • 1985 Nevado del Ruiz volcano tragedy in Colombia;
  • 1991 eruption of Mount Pinatubo in the Philippines;
  • 1994 Northridge earthquake in California;
  • December 2004 Sumatra, Indonesia, earthquake and tsunami that killed more than 227,000 people; and
  • March 2011 earthquake and tsunami that killed 15,000 people in Japan.

Sociological Effects of Earthquakes  | UPSC – IAS

  • Less Economically Developed Country suffer the greatest loss of life from earthquakes. This is because buildings are not as strong and emergency services are not as efficient. The economic cost of earthquakes can be greater in MEDCs (MEDCs are countries which have a high standard of living and a large GDP) as the economic life of a MEDC suffers greater disruption.

Hotspots, Mantle Plumes and Accreted terranes | UPSC – IAS

Hotspots, Mantle Plumes and Accreted terranes | UPSC – IAS

(ADDITIONS TO PLATE TECTONIC THEORY)

With each passing year, we learn more about plate tectonics. Two examples of important additions to plate tectonic theory are hot spots and accreted terranes.

HotSpots and Mantle Plumes | UPSC – IAS

One augmentation to plate tectonic theory was introduced at the same time as the original model. The basic theory of plate tectonics can explain tectonic and volcanic activity along the margins of plates, however, there are many places on Earth where magma rising from the mantle comes either to or almost to the surface at locations that may not be anywhere near a plate boundary. These locations of volcanic activity in the interior of a plate are referred to as hot spots, more than 50 have thus far been identified.

Hotspots, Mantle Plumes and Accreted terranes | UPSC - IAS PCS Gk today

Image Explanation:- The idealized mantle plume model of hot spot origin. A plume of heated material rises from deep within the mantle. When the large head of the plume reaches the surface, an outpouring of flood basalt results. Plate motion carries the flood basalts off the stationary plume and a new volcano or volcanic island forms. As the moving plate carries each volcano off the hot spot, it becomes extinct, resulting in a straight-line “hot spot trail.” As volcanic islands move off the hot spot, the plate cools, becomes denser, and subsides; some islands may eventually sink below the surface to become seamounts.
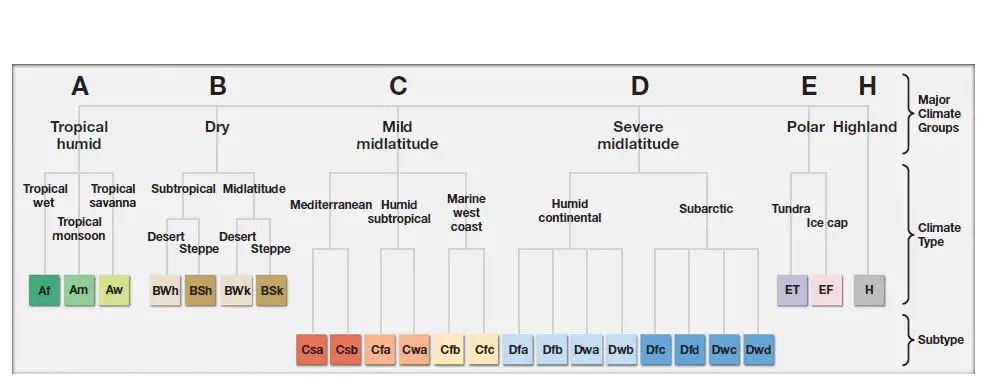
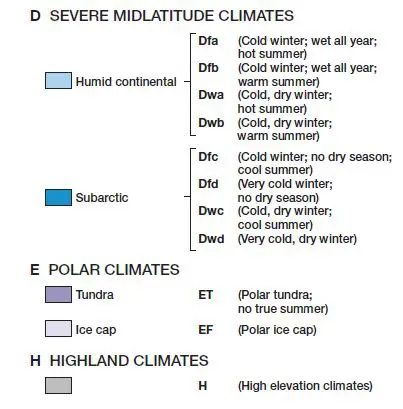
Explaining Hotspots | UPSC – IAS

To explain the existence of hot spots, the mantle plume model was proposed in the late 1960s. This explanation suggests that midplate volcanic activity develops over narrow plumes of heated material rising through the mantle – perhaps originating as deep as the core – mantle boundary. Such mantle plumes are believed to be relatively stationary over long periods of time (in some cases, as long as tens of millions of years). As the magma rises through the plate above, it creates hot spot volcanoes and/or hydrothermal (hot water) features on the surface – often after an initial large outpouring of lava known as flood basalt.

  • The plate above the hot spot is moving, so the volcanoes or other hot spot features are eventually carried off the plume and become inactive, while in turn new volcanic features develop over the plume, so generating a straight-line hot spot trail.
  • Volcanic islands carried off the hot spot may eventually subside to form underwater seamounts as the oceanic lithosphere cools and becomes denser.
  • Because many hot spots seem to be effectively fixed in position for long periods of time, the hot spot trails they produce can indicate both the direction and speed of plate motion with seamounts becoming progressively older in the direction of plate movement.

The Hawaiian Hotspot | UPSC – IAS

The most dramatic present day example of a hot spot is associated with the Hawaiian Islands. Although both developed over the same hot spot, the ancient volcanic remnants of Midway Island are now 2500 kilometers (1600 miles) northwest of the presently active volcanoes on the Big Island of Hawai‘i, separated in time by more than 27 million years.

The volcanoes of the Hawaiian chain are progressively younger from west to east; As the Pacific Plate drifts northwestward, new volcanoes are produced on an “assembly line” moving over the persistent hot spot .

Hotspots, Mantle Plumes and Accreted terranes | UPSC - IAS PCS UPPCS

Image Explanation:- The Hawaiian hot spot. A hot spot has persisted here for many millions of years. As the Pacific Plate moved northwest, a progression of volcanoes was created and then died as their source of magma was shut off. Among the oldest is Midway Island. Later volcanoes developed down the chain. The numbers on the main islands indicate the age of the basalt that formed the volcanoes, in millions of years before the present.

After the Big Island is carried off the hot spot by the movement of the plate, the next Hawaiian island will rise in its place – in fact, scientists are already studying the undersea volcano Lōʻihi (seamounts) it builds up on the ocean floor just southeast of the Big Island. Other well-known hot spot locations are

  • Yellowstone National Park,
  • Iceland, and
  • The Galapagos Islands.

Recent research indicates that the complete explanation of hot spots may turn out to be more complex than the original mantle plume model suggested. Seismic tomography —a technique that uses earthquake waves to produce a kind of “ultrasound” of Earth – suggests that the magma source of at least some hot spots is quite shallow, whereas the source for others are mantle plumes originating deep from within the mantle.

Further, some researchers cite evidence suggesting that several mantle plumes may have changed location in the geologic past. For example,

Emperor Seamounts—a chain of seamounts to the northwest of Midway Island—are part of the Hawaiian hot spot trail, but they appear to divert quite significantly in direction from the straight line of the rest of the Hawaiian chain.

This “bend” in the hot spot trail is due either to a significant change in direction of the Pacific Plate about 43 million years ago or to the migration of the hot spot itself—perhaps both. As additional information is gathered, a more complete understanding of hot spots, mantle plumes, and mid plate volcanic activity will likely emerge.

Accreted Terranes | UPSC – IAS

A more recent discovery has helped explain the often confusing juxtaposition of different types of rock seen along the margins of some continents.  A terrane is a small to- medium mass of lithosphere – bounded on all sides by faults – that may have been carried a long distance by a moving plate, eventually to converge with the edge of another plate.

  • The terrane is too buoyant to be subducted in the collision and instead is fused (“accreted”) to the other plate, often being fragmented in the process. In some cases, slices of oceanic lithosphere have accreted in terranes (including the accumulated sediment in what is called the accretionary wedge of a subduction zone); in other cases, it appears that entire old island arcs have fused with the margin of a continent.
  • Terranes are distinctive geologically because their lithologic complement (types of rock) is generally quite different from that of the plate to which they are accreted.
  • It is generally believed that every continent has grown outward by the accumulation of accreted terranes on one or more of its margins.
  • North America is a prominent example: most of Alaska and much of western Canada and the western United States consist of a mosaic of several dozen accreted terranes, some of which have been traced to origins south of the equator.
    Hotspots, Mantle Plumes and Accreted terranes | UPSC - IAS UPPCS PCS

Image Explanation:- The origin of an accreted terrane in a convergent boundary. (a) A moving oceanic plate carries along an old island arc. (b) The oceanic plate converges with a continental plate. (c) The oceanic plate begins to subduct under the continental plate, but the island arc is too buoyant for subduction and so is accreted to the continental plate.

Theory of Plate Tectonics and Seafloor Spreading Evidence | UPSC – IAS

Theory of Plate tectonics definition and evidence Quizlet UPSC IAS PCS Gk today

 Theory of Plate tectonics definition and evidence Quizlet UPSC IAS PCS Gk today

Theory of Plate tectonics Definition and Evidence | UPSC – IAS

Tectonic plates are massive, rigid pieces of the Earth’s crust; they form the majority of the geological foundation of the surface features of the earth. These plates slowly travel across the Earth, moving entire sections of continental and oceanic crust along with them.

Despite the questions about the validity of continental drift, throughout the middle of the twentieth century continuing research revealed more and more about our dynamic planet.

Theory of Plate tectonicsThe Evidence

Among the many gaps in scientific knowledge at the time of Alfred Wegener was an understanding of the dynamics of the ocean floors. By the 1950s, geologists, geophysicists, seismologists, oceanographers, and physicists had accumulated a large body of data about the ocean floor and the underlying crust.

One of the most intriguing early findings came when thousands of depth soundings from the oceans of the world were used to construct a detailed map of ocean floor topography. The result was remarkable: vast abyssal plains were seen dotted with chains of undersea volcanoes known as seamounts.

  • Narrow, deep  oceanic trenches occurred in many places, often around the margins of the ocean basins. Perhaps most stunning of all was a continuous ridge system running across the floors of all the oceans for 64,000 kilometers (40,000 miles), wrapping around the globe like the stitching on a baseball.
  • The mid-Atlantic segment of this mid ocean ridge system is especially striking, running exactly halfway between – and matching the shape of – the coastlines on both sides, almost as if a giant seam had opened up in the ocean floor between the continents.

By the 1960s a world network of seismographs was able to pinpoint the location of every significant earthquake in the world. When earthquake locations were mapped, it was clear that earthquakes do not occur randomly around the world; instead, most earthquakes occur in bands, often coinciding with the pattern of the mid ocean ridge system and oceanic trenches

Theory of Plate tectonics definition and evidence Quizlet UPSC IAS

Seafloor Spreading Theory | UPSC – IAS

In the early 1960s, a new theory was propounded, most notably by the American oceanographer Harry Hess and geologist Robert S. Dietz, that could explain:-

  • The significance of the mid-ocean ridges,
  • The oceanic trenches,
  • The pattern of earthquakes – and 
  • Could provide a possible mechanism for Wegener’s continental drift. Known as seafloor spreading,

This theory stated that mid-ocean ridges are formed by currents of magma rising up from the mantle; volcanic eruptions create new basaltic ocean floor that then spreads away laterally from the ridge.

Seafloor Spreading Theory Theory of Plate Tectonics and Seafloor Spreading Evidence UPSC - IAS Quizlet

Thus, the midocean ridges contain the newest crust formed on the planet. At other places in the ocean basin -at the oceanic trenches older lithosphere descends into the asthenosphere in a process called subduction, where it is ultimately “recycled.” The amount of new seafloor created is compensated for by the amount lost at subduction zones.

Verification of Seafloor Spreading | UPSC – IAS

The validity of seafloor spreading was confirmed most notably by two lines of evidence: paleomagnetism and ocean
floor core sampling. When any rock containing iron is formed—such as iron-rich ocean floor basalt—it is magnetized so that the magnetic field within its iron-rich grains become aligned with Earth’s magnetic field.

This orientation then becomes a permanent record of the polarity of Earth’s magnetic field at the time the rock solidified. Over the last 100 million years, for reasons that are not fully understood, the polarity of Earth’s magnetic field has reversed itself more than 170 times—with the north magnetic pole becoming the south magnetic pole.

Seafloor Spreading Theory the polarity of Earth’s magnetic field

In 1963, Fred Vine and D.H. Matthews used paleomagnetism to test the theory of seafloor spreading by studying paleomagnetic data from a portion of the midocean ridge system. If the seafloor has spread laterally by the addition of new crust at the oceanic ridges, there should be a relatively symmetrical pattern of magnetic orientationnormal polarity, reversed polarity, normal polarity, and so on—on both sides of the ridges. Such was found to be the case. Final confirmation of seafloor spreading was obtained from core holes drilled into the ocean floor by the research ship, the Glomar Challenger in the late 1960s. Several thousand ocean floor cores of sea-bottom sediments were analyzed, and it was evident from this work that, almost invariably,

  • Sediment thickness and the age of fossils in the sediment increase with increasing distance from the midocean ridges, indicating that sediments farthest from the ridges are oldest.
  • At the ridges, ocean floor material is almost all igneous, with little accumulation of sediment—any sediment near the ridges is thin and young.

age of ocean floor Verification of Seafloor Spreading: Seafloor Spreading Theory

Thus, the seafloors can be likened to gigantic conveyor belts, moving ever outward from the midocean ridges toward the trenches. Oceanic lithosphere has a relatively short life at Earth’s surface.

New crust is formed at the oceanic ridges, and within 200 million years is returned to the mantle by subduction. Because lower density continental lithosphere cannot be subducted, once it forms it is virtually permanent.

The continual recycling of oceanic crust means that its average age is only about 100 million years, whereas the average age of continental crust is 20 times that. Indeed, some fragments of continental crust have been discovered that are more than 4 billion years old— nearly nine-tenths of the age of Earth! So, as it turns out, Alfred Wegener was wrong about one important detail in his theory of continental drift:

It is not just the continents that are drifting. The continents are embedded in the thicker lithospheric plates, carried along by the action of seafloor spreading.

Theory of Plate tectonics | UPSC – IAS

By 1968, on the basis of these details and a variety of other evidence, the theory of plate tectonics, as it had become
known, was being accepted by the scientific community Plate tectonics provides a framework with which we can understand and relate a wide range of internal processes and topographic patterns around the world. The lithosphere is a mosaic of rigid plates floating over the underlying plastic asthenosphere.

These lithospheric plates, consisting of the crust together with the upper mantle, vary considerably in area; some are almost hemispheric in size, whereas others are much smaller. The exact number of plates and some of their boundaries are not completely clear. Seven major plates, an equal number of intermediate-sized plates, and perhaps a dozen smaller plates, are recognized. Many of the smaller plates are remnants of once-larger plates that are now being subducted. These plates are about 65 to 100 kilometers (40 to 60 miles) thick, and most consist of both oceanic and continental crust.

Theory of Plate Tectonics and Seafloor Spreading Evidence | UPSC - IAS UPPCS Quizlet

Mechanism for Plate Tectonics

  • The driving mechanism for plate tectonics is thought to be convection within Earth’s mantle. A very sluggish thermal convection system appears to be operating within the planet, bringing deep-seated hot, lower density rock slowly to the surface.
  • Plates may be “pushed” away from midocean ridges to a certain extent, but it appears that much of the motion is a result of the plates being “pulled” along by the subduction of colder, dense oceanic lithosphere down into the asthenosphere.
  • The complete details of thermal convection within the mantle and the ultimate fate of subducted plates remain to be confirmed. These plates move slowly over the asthenosphere. The rates of seafloor spreading vary from less than 1 cm (0.4 in.) per year in parts of the Mid-Atlantic Ridge to as much as 10 cm (4 in.) per year in the Pacific–Antarctic Ridge.

Alfred Wegener’s theory of continental drift and Evidence

Wegener's theory of continental drift and Evidence pangea | UPSC - IAS

4 pieces of evidence for continental drift by Alfred Wegener

(An Analysis of – Evidence and Rejection of the Theory)

During the second and third decades of the twentieth century, the notion of continental drift was revived, most notably by the German meteorologist and geophysicist Alfred Wegener.

  • Wegener put together the first comprehensive theory to describe and partially explain the phenomenon, publishing his landmark book Die Entstehung der Kontinente und Ozeane (The Origin of Continents and Oceans) in 1915.
  • Wegener postulated a massive supercontinent, which he called Pangaea (Greek for “whole land”), as existing about 225 million years ago and then breaking apart into several large sections – the present-day continents—that have continued to move away from one another to this day.

Wegener’s Evidence for Continental Drift Theory | UPSC – IAS

Wegener accumulated a great deal of evidence to support his hypothesis, most notably the remarkable number of close affinities of geologic features on both sides of the Atlantic Ocean.

He found the continental margins of the subequatorial portions of Africa and South America fit together with jigsaw- puzzle-like precision.

Wegener’s Evidence for Continental Drift Theory UPSC IAS

He also determined that the petrologic (rock) records on both sides of the Atlantic show many distributions—such as ancient coal depositsthat would be continuous if the ocean did not intervene. Moreover, when the continents are placed back in their Pangaean configuration, mountain belts in Scandinavia and the British Isles match up with the Appalachian Mountains in eastern North America

Supporting evidence came from paleontology: the fossils of some dinosaur and other reptile species, such as the freshwater swimming reptile the Mesosaurus, are found on both sides of the southern Atlantic Ocean, but nowhere else in the world. Fossilized plants, such as the fernlike Glossopteris, are found in similar- aged rocks in South America, South Africa, Australia, India, and Antarctica – its seeds too large and heavy to have been carried across the expanse of the present-day oceans by wind.Wegener’s Evidence for Continental Drift Theory Alfred Wegener's theory of continental drift and Evidence | UPSC - IASWegener worked with climatologist Wladimir Köppen to study the past climate patterns of Earth. For example, they studied glacial deposits that indicated that large portions of the southern continents and India were extensively glaciated about 300 million years ago. The pattern of deposits made sense if the continents had been together in Pangaea when this glaciation took place.

Alfred Wegener's theory of continental drift and Evidence | UPSC - IAS UPPCS

Rejection of Continental Drift Theory | UPSC – IAS

Wegener’s accumulated evidence could be most logically explained by continental drift. His ideas attracted much attention in the 1920s—and generated much controversy.

Some Southern Hemisphere geologists, particularly in South Africa, responded with enthusiasm. The general response to Wegener’s hypothesis, however, was disbelief. Despite the vast amount of evidence Wegener presented, most scientists felt that two difficulties made the theory improbable if not impossible:

  • (1) Earth’s crust was believed to be too rigid to permit such large-scale motions—after all, how could solid rock plow through solid rock?
  • (2) Further, Wegener did not offer a suitable mechanism that could displace such large masses for a long journey.

For these reasons, most Earth scientists ignored or even debunked the idea of continental drift for the better part of half a century after Wegener’s theory was presented.

  • Although certainly discouraged that his ideas on continental drift were rejected by most scientists, Wegener continued his other scientific work—most notably in meteorology and polar research, where his contributions are widely acknowledged.
  • In 1930, Wegener was leading a meteorological expedition to the ice cap of Greenland. After delivering supplies to scientists stationed in the remote research outpost of Eismitte in the middle of the ice cap, on November 1 Wegener and a fellow expedition member, Rasmus Villumsen, set out by skis and dogsled to return to their base camp near the coast, but neither arrived. Wegener’s body was found six months later buried in the snow—he died decades before his ideas on continental drift would receive serious attention by the majority of Earth scientists.

Endogenetic Forces – Internal Process of Earth System | UPSC – IAS

Endogenetic Forces - Internal Process of Earth System UPSC - IAS UPPCS gk today

Endogenetic Forces - Internal Process of Earth System UPSC - IAS UPPCS gk today

Internal Processes of Earth System: Endogenetic Forces | UPSC – IAS

The Earth is shaped by many different geological processes. The forces that cause these processes come from both above and beneath the Earth’s surface. Processes that are caused by forces from within the Earth are endogenetic processes.

It is in this Series we fully develop our discussion of the key Earth system operating within the planet also known as Endogenetic Forces or internal process of earth:

The processes and consequences of heat flow from the hot interior toward the cooler surface. As we’ll see, it is the slow movement of hot—but largely solid rock through the mantle that drives plate tectonics and is responsible for nearly all other internal processes and also main endogenetic process are – 

  • Volcanism,
  • Folding, and
  • Faulting.

The internal processes we describe and explain here are largely responsible for increasing the relief of the surface of Earth.

The Impact of Internal Processes on the Landscape | UPSC – IAS

In our endeavor to understand the development of Earth’s landscape, no pursuit is more rewarding than a consideration of the internal processes, for they are the supreme builders of terrain. Energized by forces within Earth, the internal processes actively reshape the crustal surface.

  • The crust is buckled and bent, land is raised and lowered, rocks are fractured and folded, solid material is melted, and molten material is solidified. These actions have been going on for billions of years and are fundamentally responsible for the gross shape of the lithospheric landscape at any given time.
  • The internal processes do not always act independently and separately from each other, but in this series we isolate them in order to simplify our analysis.

From Rigid earth to Plate Tectonics | UPSC – IAS

The shapes and positions of the continents may seem fixed at the time scale of human experience, but at the geologic time scale, measured in millions or tens of millions of years, continents are quite mobile. Continents Have:

  • Moved,
  • Collided and merged, and
  • Then been torn apart again;
  • Ocean basins have formed, widened;

These changes on the surface of Earth continue today, so that the contemporary configuration of the ocean basins and continents is by no means the ultimate one. It is only in the last half century, however,that Earth scientists have come to understand how all of this could actually happen.

Until the mid-twentieth century, most Earth scientists assumed that the planet’s crust was static, with continents and ocean basins fixed in position and significantly modified only by changes in sea level and periods of mountain building. The uneven shapes and irregular distribution of the continents were puzzling, but it was generally accepted that the present arrangement was emplaced in some ancient age when Earth’s crust cooled from its original molten state.
Although not widely accepted, the idea that the continents had changed position over time, or that a single“supercontinent” once existed before separating into large fragments, has been around for a long time. Various naturalists, physicists, astronomers, geologists, botanists, and geographers from a number of countries have been putting forth this idea since the days of geographer Abraham Ortelius In the 1590s and philosopher Francis Bacon in 1620.Until fairly recently, however, the idea was generally unacceptable to the scientific community at large

Climate Change and International Security Issue | UPSC

Climate Change and International Security Issue UPSC IAS PCS Gk today

Climate Change and International Security Issue  UPSC IAS PCS Gk today

Why Climate Change is a security issue? | UPSC IAS

Many Scholars declared Climate Change as Warming War which requires intervention of United Nation Security Council as per its mandate under article 39 of UN charter. The Warming War is a metaphor (like Cold War) which conveys how climate change acts as a driver of such conflict, as its impacts accumulate and multiply to threaten the security of human life on earth.

Article 39 of UN charter The Security Council shall determine the existence of any threat to the peace, breach of the peace, or act of aggression and shall make recommendations, or decide what measures shall be taken to maintain or restore international peace and security.

Climate Change as a Security Issue | UPSC IAS

  • Earth’s limited resources are under pressure as demand for food, water, and energy is increasing. Widespread unemployment, rapid urbanization, and environmental degradation can cause persistent inequality, political marginalization, and unresponsive governments leading to instability and conflict.
  • In above context United Nation Environment Program has identified seven factors where climate change acts as threat multiplier to security and peace of states and society.
  • Local resource competition: As pressure on local resources is increasing, competition can lead to instability and even violent conflict in absence for proper dispute resolution.
  • Livelihood insecurity and Migration
    • Climate change will increase the insecurity of farmers who depend on natural resources for livelihood. It could push them to migrate and turn to informal and illegal source of income.
    • As per World Bank estimates by 2050, about 140 million people will be forced to leave their place of origin in South Asia, Africa and Latin America.
  • Extreme weather events and disasters: Disasters will exacerbate fragile situation and can increase people vulnerabilities and grievances especially in countries affected by conflict.
  • Volatile food price
    • Climate change is likely to disrupt food production in many regions, increase prices, market volatility and heightening risk of protest, rioting and civil conflicts.
    • As per IPCC assessment by 2080 there will be 770 million undernourished people by 2080 due to climate change.
  • Transboundary water management
    • It is a frequent source of tension. As demand grows and climate impact affects availability and quality, competition over water use will likely exert pressure at local, regional and global level.
    • According to recently released Hindu Kush-Himalayan Assessment report with current emission level two-third of glaciers in the region will be lost by 2100 and cause water crisis for 2 billion people.
  • Sea level rise and coastal degradation
    • Rising sea level will threaten the viability of low lying areas even before they are submerged, leading to social disruption, displacement and migration. Also, disagreement over maritime boundaries and ocean resources may increase.
    • As per IPCC 5th assessment report sea level rise can be 52-98 cm by 2100.
  • Unintended effects of climate change: As the climate adaptation and mitigation policies are more broadly implemented, the risks of unintended negative effects-particularly in fragile regions will also increase. In countries with poor institutional capacity and governance, this may lead to immense political pressure and ultimately civil war.

Reason for support of UNSC intervention | UPSC IAS

  • If the UNSC declares the impacts of climate change an international threat then military and non-military sanctions could be invoked.
  • The sanctions would be available to the council in the event of states not meeting their Paris Agreement obligations. Economic sanctions could also be placed upon corporations that currently operate with relatively little international scrutiny.
  • Supporters of such declaration cites slow and ineffective progress of climate negotiations (under UNFCCC) and demand a rapid response to decreasing GHG emissions to stop temperature rise below 2°C. It’ll bring element of coercion in climate agreements.
  • These measures could include the deployment of peacekeeping forces and increased humanitarian assistance surrounding direct and indirect climate induced crises.

National Clean Air Programme (NCAP) | UPSC – IAS

National Clean Air Programme (NCAP) UPSC IAS Gk today UPPCS

National Clean Air Programme (NCAP) UPSC IAS Gk today UPPCS

What is National Clean Air Programme (NCAP) ? | UPSC – IAS

  • It is a pollution control initiative to cut the concentration of particles (PM10 & PM2.5) by 20-30% by 2024.
  • It will have 2017 as the base year for comparison and 2019 as the first year.
  • It is to be implemented in 102 non-attainment cities. These cities are chosen on the basis of Ambient Air Quality India (2011-2015) and WHO report 2014/2018.
  • National Clean Air Programme (NCAP) was recently launched by – Ministry of Environment, Forest and Climate Change (MoEFCC).

Its objectives include-

  • Stringent implementation of mitigation measures for prevention, control and abatement of air pollution;
  • Augment and strengthen air quality monitoring network across the country;
  • Augment public awareness and capacity building measures.

Significance of National Clean Air Programme (NCAP) | UPSC IAS

  • First such effort – Framing a national framework for air quality management with a time-bound reduction target. The biggest advantage of such targets is that it helps decide the level of severity of local and regional action needed for the plans to be effective enough to meet the reduction targets.
  • Multisectoral Collaboration and Participatory approach – covering all sources of pollution and coordination between relevant Central ministries, state governments, local bodies and other stakeholders.
  • All-inclusive approach – It has tried to incorporate measures for urban as well as rural areas. Further, NCAP identifies the trans-boundary nature of air pollution and thus specifically assigns transboundary strategies in managing the air pollution in the country.
  • Linking Health and Pollution: NCAP has now taken on board the National Health Environmental Profile of 20 cities that the MoEF&CC initiated along with the Indian Council of Medical Research with special focus on air pollution and health. It has asked the Ministry of Health and Family Welfare to maintain health database and integrate that with decision making.

Implementation of National Clean Air Programme (NCAP) | UPSC IAS

  • The Central Pollution Control Board (CPCB) shall execute the nation-wide programme for the prevention, control, and abatement of air pollution within the framework of the NCAP.
  • The NCAP will be institutionalized by respective ministries and will be organized through inter-sectoral groups, which include, Ministry of Road Transport and Highway, Ministry of Petroleum and Natural Gas, Ministry of New and Renewable Energy, Ministry of Heavy Industry, Ministry of Housing and Urban Affairs, Ministry of Agriculture, Ministry of Health, NITI Aayog, CPCB, experts from the industry, academia, and civil society.
  • The program will partner with multilateral and bilateral international organizations, philanthropic foundations and leading technical institutions to achieve its outcomes.
  • The Apex Committee in the MoEFCC will periodically review the progress. Annual performance will be periodically reported upon. Appropriate indicators will be evolved for assessing the emission reduction benefits of the actions.

National Clean Air Programme (NCAP) UPSC IAS

Components of National Clean Air Programme (NCAP) | UPSC IAS

(National Clean Air Programme (NCAP) has 3 components)

Mitigation Actions: NCAP details seven mitigation actions.

  • Web-based, three-tier mechanism – to review, monitor, assess and inspect to avoid any form of non-compliance. The system will work independently under the supervision of a single authority, which will ensure accreditation of three independently operating entities.
  • Extensive Plantation Drive: Plantation initiatives under NCAP at pollution hot spots in the cities/towns will be undertaken under the National Mission for Green India (GIM) with Compensatory Afforestation Fund (CAF) being managed by National Compensatory Afforestation Management and Planning Authority (CAMPA).
  • Technology Support: Clean Technologies with potential for air pollution prevention and mitigation will be supported for R&D, pilot scale demonstration and field scale implementation.
  • Regional and Transboundary Plan: These have major role for effective control of pollution more specifically with reference to the Indo-Gangetic plain. Air quality management at South-Asia regional level by activating the initiatives under ‘Male Declaration on Control and Prevention of Air Pollution and its Likely Transboundary Effects for South Asia’ and South Asia Cooperative Environment Programme (SACEP) to be explored.
  • Sectoral Interventions: This includes sectors such as e-mobility, power sector emissions, indoor air pollution, waste management, industrial and agricultural emissions and dust management.
  • City Specific Air Quality Management Plan for 102 Non-Attainment Cities: based on comprehensive science-based approach, involving meteorological conditions and source apportionment studies.
    • A separate emergency action plan in line with Graded Response Action Plan for Delhi will be formulated for each city for addressing the severe and emergency AQIs.
    • Further, the state capitals and cities with a population more than a million may be taken up on priority for implementation.
  • State Government’s participation is not limited for evolving an effective implementation strategy but also in exploring detailed funding mechanism.

Knowledge and Database Augmentation | UPSC IAS

  • Air Quality Monitoring Network which also includes setting rural monitoring network, 10 city super network (overall air quality dynamics of the nation, impact of interventions, trends, investigative measurements, etc)
  • Extending Source apportionment studies to all Non-Attainment cities: This will help in prioritising the sources of pollution and formulation and implementation of most appropriate action plans. A unified guideline for source apportionment study will be formulated and updated by the Centre.
  • Air Pollution Health and Economic Impact Studies: Under NCAP studies on health and economic impact of air pollution to be supported. Framework for monthly analysis of data w.r.t health to be created.
  • International Cooperation including Sharing of International Best Practices on Air Pollution.
  • Review of Ambient Air Quality Standards and Emission Standards: The existing standards need to be strengthened periodically and new standards need to be formulated for the sources where standards are not available.
  • National Emission Inventory: This will be formalized under the NCAP. Its significance is in tracking progress towards emission reduction targets and as inputs to air quality model.

Institutional Strengthening | UPSC IAS

  • Institutional Framework: It involves a National Apex Committee at the MoEF&CC and State-level Apex Committee under the chief secretaries in various states. There are various other institutions being envisaged such as Technical Expert Committee and National-level Project Monitoring Unit (PMU) at the MoEF&CC and National-level Project Implementation Unit (PIU) at the CPCB.
  • Public Awareness and Education: through national portals, media engagement, civil society involvement, etc.
  • Training and Capacity Building: NCAP identifies lack of capacity on air quality issues due to limited manpower and infrastructure in the CPCB and SPCBs, lack of formal training for various associated stakeholders etc. as one of the major hurdle in an effective implementation of air pollution management plans.
  • Setting up Air Information Centre: which will be responsible for creating a dashboard, data analysis, interpretation, dissemination. This may be set up with the assistance of the IITs, IIMs.
  • Operationalize the NPL-India Certification Scheme (NPL-ICS) for certification of monitoring instrument. It will help to cater to the country’s needs with respect to the online monitoring of air pollution. The proposed certification scheme will have three major components i.e. NPL-India Certification body (NICB), certification committee, and testing and calibration facility.
  • Air-Quality Forecasting System (AQFS): as a state-of-the-art modelling system, it will forecast the following day’s air quality. The satellite data available through ISRO to be integrated for monitoring and forecasting under the NCAP.
  • Network of Technical Institutions- Knowledge Partners: Dedicated air pollution units will be supported in the universities, organizations, and institutions and a network of highly qualified and experienced academicians, academic administrators, and technical institutions will be created.
  • Technology Assessment Cell (TAC): It will evaluate significant technologies with reference to prevention, control, and abatement of pollution. Technology induction/ transfer would be facilitated, where necessary, with time bound goals for indigenization and local manufacturing.o The TAC will be created involving the IITs, IIMs, the major universities, industries, and using the existing mechanisms and programme of the Department of Science & Technology, India Innovation Hub, etc.

Temperate and Extratropical Cyclones: Life Cycle and Stages | UPSC IAS

Temperate and Extratropical Cyclones: Life Cycle and Stages UPSC IAS Temperate Cyclones or Frontal cyclones or Mid-latitude or Wave cyclones or Extratropical Cyclone Geography optional

Temperate Cyclones or Frontal cyclones or Mid-latitude or Wave cyclones or Extratropical Cyclone 

Temperate or Extratropical cyclones are capable of producing anything from:- Cloudiness and mild showers to heavy gales, thunderstorms, blizzards, and tornadoes. Probably most significant of all atmospheric disturbances are mid latitude or temperate cyclones. Throughout the mid-latitudes, they dominate weather maps, are basically responsible for most day-to-day weather changes, and bring precipitation to much of the populated portions of the planet.

Consisting of large, migratory low-pressure cells, they are usually called depressions in Europe and lows or low pressure systems, wave cyclones, extra-tropical cyclones, or even simply (although not very precisely) as “storms” in the United States.

Mid-latitude or frontal cyclones are associated primarily with air mass convergence in regions between about 30° and 70° of latitude.  Thus, they are found almost entirely within the band of westerly winds. Their general path of movement is toward the east, which explains why weather forecasting in the mid-latitudes is essentially a west-facing vocation.

  • Because each mid-latitude cyclone or Temperate cyclones differs from all others in greater or lesser detail, any description must be a general one only. The discussions that follow, then, pertain to “typical” or idealized conditions.
  • Moreover, these conditions are presented as Northern Hemisphere phenomena. For the Southern Hemisphere, the patterns of isobars, fronts, and wind flow should be visualized as mirror images of the Northern Hemisphere patterns.

Characteristics of Temperate Cyclones | UPSC IAS

A typical mature mid-latitude cyclone or Temperate cyclones has a diameter of 1600 kilometers (1000 miles) or so. It is essentially a vast cell of low-pressure air, with ground-level pressure in the center typically between 990 and 1000 millibars. The system usually tends toward an oval shape, with the long axis trending northeast–southwest. Usually a clear-cut pressure trough extends southwesterly from the center.

Temperate and Extratropical Cyclones: diagram of temperate cyclone UPSC IAS

  • Formation of Fronts: Mid-latitude cyclones or Temperate cyclones have a converging counterclockwise circulation pattern in the Northern Hemisphere. This wind flow pattern brings together cool air from the north and warm air from the south. The convergence of these unlike air masses characteristically creates two fronts: a cold front that extends to the southwest from the center of the cyclone and runs along the pressure trough extending from the center of the storm, and a warm front extending eastward from the center and running along another, usually weaker, pressure trough.
  • Sectors: The two fronts divide the cyclone into a cool sector north and west of the center where the cold air mass is in contact with the ground, and a warm sector to the south and east where the warm air mass is in contact with the ground. At the surface, the cool sector is the larger of the two, but aloft the warm sector is more extensive. This size relationship exists because both fronts “lean” over the cool air. Thus, the cold front slopes upward toward the northwest and the warm front slopes upward toward the northeast.
  • Clouds and Precipitation: Clouds and precipitation develop in the zones within a midlatitude cyclone or Temperate cyclones where air is rising and cooling adiabatically. Because warm air rises along both fronts, the typical result is two zones of cloudiness and precipitation that overlap around the center of the storm (where air is rising in the center of the low pressure cell) and extend outward in the general direction of the fronts.

Along and immediately behind the ground-level position of the cold front (the steeper of the two fronts), a band of cumuliform clouds usually yields showery precipitation. The air rising more gently along the more gradual slope of the warm front produces a more extensive expanse of horizontally developed clouds, perhaps with widespread, protracted, low-intensity precipitation. In both cases, most of the precipitation originates in the warm air rising above the fronts and falls down through the front to reach the ground in the cool sector.

Temperate and Extratropical Cyclones: UPSC IAS temperate cyclone shape and size diagram

This precipitation pattern does not mean that the entire cool sector has unsettled weather and that the warm sector experiences clear conditions throughout. Although most frontal precipitation falls within the cool sector, the general area to the north, northwest, and west of the center of the cyclone is frequently cloudless as soon as the cold front has moved on.

Thus, much of the cool sector is typified by clear, cold, stable air. In contrast, the air of the warm sector is often moist and tending toward instability, and so thermal convection and surface-wind convergence may produce sporadic thunderstorms. Also, sometimes one or more squall lines of intense thunderstorms develop in the warm sector in advance of the cold front.

Movements of Temperate Cyclones | UPSC IAS |  Geography Optional

Midlatitude cyclones or Temperate cyclones are essentially transient features, on the move throughout their existence. Four kinds of movement are involved:

Temperate and Extratropical Cyclones: Life Cycle and Stages UPSC IAS Temperate Cyclones or Frontal cyclones or Mid-latitude or Wave cyclones or Extratropical Cyclone Geography optional

  1. The whole storm moves as a major disturbance in the westerlies, traversing the midlatitudes generally from west to east. The rate of movement averages 30 to 45 kilometers (about 20 to 30 miles) per hour, which means that the storm can cross North America in three to four days (often faster in winter than in summer).
  2. The route of a cyclone is likely to be undulating and erratic, although it moves generally from west to east, often in association with the path of the jet stream.
  3. The system has a cyclonic wind circulation, with wind generally converging counterclockwise (in the Northern Hemisphere) into the center of the storm from all sides.
  4. The cold front usually advances faster than the center of the storm (the advancing dense, cold air easily displaces the lighter, warm air ahead of the front).
  5. The warm front usually advances more slowly than the center of the storm, causing it to appear to lag behind. (This is only an apparent motion, however. The warm front is actually moving west to east, just like every other part of the system.)

Life Cycle of Temperate Cyclones: Cyclogenesis | Geography Optional

A typical midlatitude cyclone or Temperate cyclones progresses from origin to maturity, and then to dissipation, in about three to ten days. It is believed that the most common cause of cyclogenesis (the birth of cyclones) is upper troposphere conditions in the vicinity of the polar front jet stream. Most midlatitude cyclones begin as “waves” along the polar front.

  • Waves are undulations or curves that develop in the paths taken by upper level winds such as a jet stream, and that the polar front is the contact zone between the relatively cold polar easterlies and the relatively warm westerlies.
  • The opposing airflows normally have a relatively smooth linear motion on either side of the polar front. On occasion, however, the smooth frontal surface may be distorted into a wave shape.

Temperate and Extratropical Cyclones: Diagram UPSC IAS Temperate Cyclones or Frontal cyclones or Mid-latitude or Wave cyclones or Extratropical Cyclone Geography optional

There appears to be a close relationship between upper level airflow and ground-level disturbances. When the upper airflow is zonal—by which we mean relatively straight from west to east – ground-level cyclonic activity is unlikely. When winds aloft begin to meander north to south in a meridional airflow, large waves of alternating pressure troughs and ridges are formed and cyclonic activity at ground level is intensified. Most mid-latitude cyclones  or Temperate cyclones are centered below the polar front jet stream axis and downstream from an upper-level pressure trough.

A cyclone is unlikely to develop at ground level unless there is divergence above it. In other words, the convergence of air near the ground must be supported by divergence aloft. Such divergence can be related to changes in either speed or direction of the wind flow, but it nearly always involves broad north-to-south meanders in the Rossby waves and the jet stream.

  • Various ground factors: such as topographic irregularities, temperature contrasts between sea and land, or the influence of ocean currents – can apparently initiate a wave along the front. For example, cyclogenesis also occurs on the leeward side of mountains. A low-pressure area drifting with the westerlies becomes weaker when it crosses a mountain range. As it ascends the range, the column of air compresses and spreads, slowing down its counterclockwise spin. When descending the leeward side, the air column stretches vertically and contracts horizontally. This change in shape causes it to spin faster and may initiate cyclonic development even if it were not a full-fledged cyclone before. This chain of events happens with some frequency in winter on the eastern flanks of the Rocky Mountains, particularly in Colorado, and with lesser frequency on the eastern side of the Appalachian Mountains, in North Carolina and Virginia. Cyclones formed in this way typically move toward the east and northeast and often bring heavy rain or snowstorms to the northeastern United States and southeastern Canada.
  • Occlusion: Ultimately, the storm dissipates because the cold front overtakes the warm front. As the two fronts come closer and closer together, the warm sector at the ground is increasingly displaced, forcing more and more warm air aloft. When the cold front catches up with the warm front, warm air is no longer in contact with Earth’s surface and an occluded front is formed. This occlusion process usually results in a short period of intensified precipitation and wind until eventually all the warm sector is forced aloft and the ground-level low-pressure center is surrounded on all sides by cool air, a stable condition. This sequence of events weakens the pressure gradient and shuts off the storm’s energy and air lifting mechanism – and so its cloud-producing mechanism – and the storm dies out.

Conveyor Belt Model of Mid-latitude Cyclones | UPSC IAS

The description of mid-latitude cyclones we’ve just provided is sometimes called the “Norwegian” model because it was first presented by meteorologists in Norway in the 1920s. Although this explanation of midlatitude cyclones remains useful today, new data has provided a more complete explanation of these storms, especially air flow in the upper troposphere. A modern model, called the conveyor belt model, now offers a better explanation of the three dimensional aspects of these storms.

Weather Changes with the Passing of a Mid-latitude Cyclone | UPSC IAS

Although the exact details vary from storm to storm, basic structure and movements of a midlatitude cyclone or Temperate cyclones we just described can help us understand the often abrupt weather changes we experience on the ground with the passing of one of these storms. This is especially true when the cold front of a mid-latitude cyclone passes through in winter.

For example, imagine we’re in the warm sector of a mid-latitude cyclone or Temperate cyclones – the situation just before the cold front moves through. Remember, the whole storm is moving from west to east and so the cold front is moving closer to us hour by hour. When the cold front passes, all four elements of weather will likely change:

Temperate and Extratropical Cyclones: Life Cycle and Stages UPSC IAS Temperate Cyclones or Frontal cyclones or Mid-latitude or Wave cyclones or Extratropical Cyclone Geography optional

  • Temperature: As the cold front passes, temperature drops abruptly because the cold front is the boundary between the cold air mass and the warm air mass of the storm. Pressure: Because the cold front is associated with a trough (a linear band of low pressure) extending south from the heart of the storm, as the front approaches, pressure will be falling, reaching its lowest point at the front. Then, as the cold front passes and the trough moves away, pressure will begin to rise steadily.
  • Wind: Because of the overall converging counterclockwise wind pattern (in the Northern Hemisphere), winds in the warm sector come from the south (the situation before the cold front). Once the front passes, wind will tend to shift and come from the west or northwest.
  • Clouds and Precipitation: The generally clear skies ahead of the cold front are replaced by cloudiness and precipitation at the front generated by the adiabatic cooling of the warm air as it is lifted along the front—to be replaced again some hours later by clear skies in the cold air mass behind the cold front. Similar changes, although of lesser magnitude, occur with the passage of a warm front.

Occurrence and Distribution of Temperate Cyclones | UPSC IAS

  • At any given time, from 5 to 15 mid-latitude cyclones or Temperate cyclones exist in the Northern Hemisphere mid-latitudes, and an equal number in the Southern Hemisphere.
  • They occur at scattered but irregular intervals throughout the zone of the westerlies. In part because temperature contrasts are greater during the winter, these migratory disturbances are more numerous, better developed, and faster moving in winter than in summer. They also follow much more equatorward tracks in winter.
  • In the Southern Hemisphere, the Antarctic continent provides a prominent year-round source of cold air, and so vigorous cyclones are almost as numerous in summer as in winter. The summer storms are farther poleward than their winter cousins, however, and are mostly over the Southern Ocean. Thus, they have little effect on land areas.

Classification of Air masses and Fronts | Geography Optional | UPSC

Warm Fronts Classification of Air masses and types of Fronts Geography Optional UPSC IAS gk today

Classification of Air masses and Fronts | Geography Optional | UPSC – IAS

Air Masses

Although the troposphere is a continuous body of mixed gases that surrounds the planet, it is by no means a uniform blanket of air. Instead, it is composed of many large parcels of air that are distinct from one another. Such large parcels are referred to as air masses.

Characteristics Air Masses

To be recognized as a distinct air mass, a parcel of air must meet three requirements:

  • It must be large. A typical air mass is more than 1600 kilometers (1000 miles) across and several kilometers deep (from Earth’s surface to the top of the air mass).
  • It must have uniform properties in the horizontal dimension. This means that at any given altitude in the air mass, its physical characteristics:- primarily temperature, humidity, and stability; are relatively homogeneous.
  • It must travel as a unit. It must be distinct from the surrounding air, and when it moves it must retain its original characteristics and not be torn apart by differences in airflow.

Origin of Air Masses

  • An air mass develops its characteristics when it stagnates or remains over a uniform land or sea surface long enough to acquire the temperature/humidity/stability characteristics of the surface below.
  • This stagnation needs to last for only a few days if the underlying surface has prominent temperature and moisture characteristics. Stable air is more likely to remain stagnant for a few days than unstable air, so regions with anticyclonic (high pressure) conditions commonly form air masses.

Source Regions of Air Masses

The formation of air masses is usually associated with what are called source regions: regions of Earth’s surface that are particularly well suited to generate air masses. Such regions must be extensive, physically uniform, and associated with air that is stationary or anticyclonic.

  • Ideal source regions are – ocean surfaces and extensive flat land areas that have a uniform covering of snow, forest, or desert.
  • Air masses rarely form over the irregular terrain of mountain ranges.

Source Regions of Air Masses

Image portrays the principal recognized source regions for air masses that affect North America. Warm air masses can form in any season over the waters of the southern North Atlantic, the Gulf of Mexico/Caribbean Sea, and the southern North Pacific, and in summer, they can form over the deserts of the southwestern United States and northwestern Mexico. Cold air masses develop over the northern portions of the Atlantic and Pacific Oceans and over the snow-covered lands of north-central Canada.

It may well be that the concept of source regions is of more theoretical value than actual value. A broader view, one subscribed to by many atmospheric scientists, holds that air masses can originate almost anywhere in the low or high latitudes but rarely in the midlatitudes due to the prevailing westerlies where persistent wind would prevent air mass formation.

Classification of Air Masses

Air masses are classified on the basis of source region. The latitude of the source region correlates directly with the temperature of the air mass, and the nature of the surface strongly influences the humidity content of the air mass. Thus,

  • A low-latitude air mass is warm or hot
  • A high-latitude one is cool or cold.

If the air mass develops over a continental surface, it is likely to be dry; if it originates over an ocean, it is usually moist. A one- or two-letter code is generally used to identify air masses. Although some authorities recognize other categories, the basic classification is sixfold are as follows:-

Classification of Air masses and Fronts Geography Optional UPSC IAS Mains

Movement and Modification of Air Masses

Some air masses remain in their source region for long periods, even indefinitely. In such cases, the weather associated with the air mass persists with little variation. Our interest, however, is in masses that leave their source region and move into other regions, particularly into the midlatitudes. When an air mass departs from its source region, its structure begins to change. This change is due in part to thermal modification (warming or cooling from below), in part to dynamic modification (uplift, subsidence, convergence, turbulence), and perhaps also in part to addition or subtraction of moisture.

Once it leaves its source area, an air mass modifies the weather of the regions into which it moves: it takes source-region characteristics into other regions.

Classification of Air masses and Fronts Geography Optional UPSC IAS PCS SSC UPPCS

A midwinter outburst of continental polar (cP) air from northern Canada sweeps down across the central part of North America. With a source-region temperature of −46°C (−50°F) around Great Slave Lake, the air mass has warmed to −34°C (−30°F) by the time it reaches Winnipeg, Manitoba, and it continues to warm as it moves southward. Throughout its southward course, the air mass becomes warmer, but it also brings some of the coldest weather that each of these places will receive all winter. Thus, the air mass is modified, but it also modifies the weather in all regions it passes through. Temperature, of course, is only one of the characteristics modified by a moving air mass. There are also modifications in humidity and stability.

North American Air Masses

The North American continent is a prominent area of air mass interaction. The lack of mountains trending east to west permits polar air to sweep southward and tropical air to flow northward unhindered by terrain, particularly over the eastern two-thirds of the continent. In the western part of the continent, though, air masses moving off the Pacific are impeded by the prominent north– south trending mountain ranges.

Continental polar (cP) – Air masses develop in central and northern Canada, and Arctic (A) air masses originate farther north and so are colder and drier than cP air masses – both are dominant features in winter with their cold, dry, stable nature. Maritime polar (mP) air from the Pacific in winter can bring cloudiness and heavy precipitation to the mountainous west coastal regions. In summer, cool Pacific mP air produces fog and low stratus clouds along the coast. North Atlantic mP air masses are also cool, moist, and unstable, but except for occasional incursions into the mid-Atlantic coastal region, Atlantic mP air does not affect North America because the prevailing circulation of the atmosphere  is westerly.

Maritime tropical (mT) air from the Atlantic/Caribbean/ Gulf of Mexico is warm, moist, and unstable. It strongly influences weather and climate east of the Rockies in the United States, southern Canada, and much of Mexico, serving as the principal precipitation source in this broad region. It is more prevalent in summer than in winter, bringing periods of uncomfortable humid heat. Pacific mT air originates over water in areas of anticyclonic subsidence, and so it tends to be cooler, drier, and more stable than Atlantic mT air; it is felt only in the southwestern United States and northwestern Mexico, where it may produce coastal fog and moderate orographic rainfall where forced to ascend mountain slopes. It is also the source of some summer rains in the southwestern interior.

Continental tropical (cT) air is relatively unimportant in North America because its source region is not extensive. In summer, hot, very dry, unstable cT air surges into the southern Great Plains area on occasion, bringing heat waves and dry conditions.

Equatorial (E) air affects North America only in association with hurricanes. It is similar to mT air except that E air provides an even more copious source of rain than does mT air because of high humidity and instability.

FRONTS

When unlike air masses meet, they do not mix readily; instead, a boundary zone called a front develops between them. A front is not a simple two-dimensional boundary. A typical front is a narrow three-dimensional transition zone several kilometers or even tens of kilometers wide. Within this zone, the properties of the air change rapidly.

The frontal concept was developed by Norwegian meteorologists during World War I, and the term front was coined because these scientists considered the clash between unlike air masses to be analogous to a confrontation between opposing armies along a battle front. As the more “aggressive” air mass advances at the expense of the other, some mixing of the two occurs within the frontal zone, but for the most part the air masses retain their separate identities as one is displaced by the other.

Types of Fronts

(Cold, Warm, Stationary, and Occluded)

  • The most conspicuous difference between air masses is usually temperature. A cold front forms where an advancing cold air mass meets and displaces warmer air (see image), whereas a warm front forms where an advancing warm air mass meets colder air (see image).
  • In both cases, there is warm air on one side of the front and cool air on the other, with a fairly abrupt temperature gradient between.
  • Air masses may also have different densities, humidity levels, wind patterns, and stability, and so these factors can have a steep gradient through the front as well. In some cases, a front may remain stationary for a few hours or even a few days.
  • More commonly, however, a front is in more or less constant motion. Usually one air mass is displacing the other; thus, the front advances in the direction dictated by the movement of the more active air mass. Regardless of which air mass is advancing, it is always the warmer air that rises over the cooler.
  • The warmer, lighter air is inevitably forced aloft, and the cooler, denser air mass functions as a wedge over which the lifting occurs. As you can see in both the images fronts “lean” or slope upward from the surface, and it is along this slope that the warmer air rises and cools adiabatically to form clouds and often precipitation.
  • Indeed, fronts lean so much that they are much closer to horizontal features than vertical ones. The slope of a typical front averages about 1:150, meaning that 150 kilometers away from the surface position of the front, the height of the front is only 1 kilometer above the ground.
  • Because of this very low angle of slope (less than 1°), the steepness shown in most diagrams of fronts is greatly exaggerated. Notice that the “leading edge” of a cold front precedes its higher altitude “trailing edge,” whereas a warm front leans “forward” so that the higher altitude part of the front is ahead of its lower altitude “trailing edge.”

Cold Fronts

Cold Fronts Classification of Air masses and types of Fronts Geography Optional UPSC IAS gk todayImage Explanation: A cold front forms when a cold air mass is actively underriding a warm air mass. As a cold front advances, the warm air ahead of it is forced upward. This displacement often creates cloudiness and relatively heavy precipitation along and immediately behind the groundlevel position of the front. (In this diagram, the vertical scale has been exaggerated.)

Because of friction with the ground, the advance of the lower portion of a cold air mass is slowed relative to the upper portion. As a result, a cold front tends to become steeper as it moves forward and usually develops a protruding “nose” a few hundred meters above the ground.

  • The average cold front is twice as steep as the average warm front. Moreover, cold fronts normally move faster than warm fronts because the dense, cold air mass easily displaces the lighter, warm air.

This combination of steeper slope and faster advance leads to rapid lifting and adiabatic cooling of the warm air ahead of the cold front. The rapid lifting often makes the warm air very unstable, and the result is blustery and violent weather along the cold front.

  • Vertically developed clouds, such as cumulonimbus clouds, are common, with considerable turbulence and showery precipitation.
  • Both clouds and precipitation tend to be concentrated along and immediately behind the ground-level position of the front. Precipitation is usually of higher intensity but shorter duration than that associated with a warm front.
  • On a weather map, the ground-level position of a cold front is shown either by a blue line or a solid line studded at intervals with solid triangles that extend in the direction toward which the front is moving.

Warm Fronts

Warm Fronts Classification of Air masses and types of Fronts Geography Optional UPSC IAS gk todayImage Explanation – A warm front forms when a warm air mass is actively overriding a cold air mass. As warm air rises above cooler air, widespread cloudiness and precipitation develop along and in advance of the ground-level position of the front. Higher and less dense clouds are often dozens or hundreds of kilometers ahead of the ground-level position of the front. (In this diagram, the vertical scale has been exaggerated.)

The slope of a typical warm front is more gentle than that of a cold front, averaging about 1:200. As the warm air pushes against and rises over the retreating cold air, it cools adiabatically, usually resulting in clouds and precipitation.

Because the frontal uplift is very gradual, clouds form slowly and turbulence is limited. High-flying cirrus clouds may signal the approaching front many hours before it arrives. As the front comes closer, the clouds become lower, thicker, and more extensive, typically developing into altocumulus or altostratus. Precipitation usually occurs broadly;

  • It is likely to be protracted and gentle, without much convective activity. If the rising air is inherently unstable, however, precipitation can be showery and even violent. Most precipitation falls ahead of the ground-level position of the moving front.
  • The ground-level position of a warm front is portrayed on a weather map either by a red line or by a solid line along which solid semicircles are located at regular intervals, with the semicircles extending in the direction toward which the front is moving

Stationary Fronts

When neither air mass displaces the other or if a cold front or warm front “stalls” their common boundary is called a stationary front. It is difficult to generalize about the weather along such a front, but often gently rising warm air produces limited precipitation similar to that along a warm front.

  • As Image shows, stationary fronts are portrayed on a weather map by a combination of warm and cold front symbols, alternating on opposite sides of the line—cold air is opposite the triangles, and warm air opposite the half circles.

Occluded Fronts

A fourth type of front, called an occluded front, is formed when a cold front overtakes a warm front. Occluded fronts are shown on a weather map by a combination of warm and cold front symbols, alternating on the same side of the line.

Air Masses, Fronts, and Major Atmospheric Disturbances

We will now turn our attention to the major kinds of atmospheric disturbances that occur within the general circulation. Most of these disturbances involve unsettled and sometimes violent atmospheric conditions and are referred to as storms.

Some, however, produce calm, clear, quiet weather that is quite the opposite of stormy. Some of these disturbances involve air mass contrasts or fronts, and many are associated with migrating pressure cells. The following are common characteristics of atmospheric disturbances in general:-

  • They are smaller than the components of the general circulation, although they are extremely variable in size.
  • They are migratory.
  • They have a relatively brief duration, persisting for only a few minutes, a few hours, or a few days.
  • They produce characteristic and relatively predictable weather conditions.

Midlatitude DisturbancesThe midlatitudes are the principal “battleground” of tropospheric phenomena: where polar and tropical air masses meet, where most fronts occur, and where weather is most dynamic and changeable from season to season and from day to day. Many kinds of atmospheric disturbances are associated with the midlatitudes, but two of these – midlatitude cyclones and mid latitude anticyclones – are much more important than the others because of their size and prevalence.

Tropical Disturbances: The low latitudes are characterized by monotony – the same weather day after day, week after week, month after month. Almost the only breaks are provided by transient atmospheric disturbances, of which by far the most significant are tropical cyclones (locally known as hurricanes when they intensify), but also less dramatic disturbances known as easterly waves.

Localized Severe Weather Other localized atmospheric disturbances occur in many parts of the world. Short-lived but sometimes severe atmospheric disturbances such as thunderstorms and tornadoes often develop in conjunction with other kinds of storms.

Global Distribution of Soil in World UPSC | Geography Optional | IAS – PCS

Global Distribution of Major Soils in the World | Geography Optional | UPSC - IAS

Global Distribution of Major Soil Types in the World | Geography Optional | UPSC

There are twelve (12) orders of soils, which are distinguished largely on the basis of properties that reflect a major course of development, with considerable emphasis on the presence or absence of notable diagnostic horizons. We consider each of the twelve (12) orders, beginning with those characterized by little profile development and progressing to those with the most highly weathered profiles.

  • Alfisols – “al” for aluminum, “f” for iron (chemical symbol Fe), two prominent elements in these soils
  • Andisols –  Rock formed from type of magma in Andes Mountains volcanoes; soils high in volcanic ash
  • Aridisols –  Dry soils
  • Entisols – These are recently formed soils
  • Gelisols –  Soils in areas of permafrost
  • Histosols – These soils contain mostly organic matter
  • Inceptisols – Young soils at the beginning of their “life”
  • Mollisols – Soft soils
  • Oxisols – Soils with large amounts of oxygen containing compounds
  • Spodosols – Ashy soils
  • Ultisols – Soils that have had the last of their nutrient bases leached out
  • Vertisols – Soils in which material from O and A horizons falls through surface cracks and ends up below deeper horizons.

Global Distribution of Major Soils in the World | Geography Optional | UPSC - IASImage – Theoretical soil order development pathways. Soils evolve along “pathways” in which different factors—such as parent material, climate, local site conditions, or length of time – may dominate.

Entisols (Very Little Profile Development)

The least well developed of all soils, Entisols have experienced little mineral alteration and are virtually without pedogenic horizons. Their undeveloped state is usually a function of time (the very name of the order connotes recency).

  • Most Entisols are surface deposits that have not been in place long enough for pedogenetic processes to have had much effect. Some, however, are very old, and in these soils the lack of horizon development is due to a mineral content that does not alter readily, to a very cold climate, or to some other factor totally unrelated to time.
  • The distribution of Entisols is therefore very widespread and cannot be specifically correlated with particular moisture or temperature conditions or with certain types of vegetation or parent materials.
  • In the United States, Entisols are most prominent in the dry lands of the West but are found in most other parts of the country as well. They are commonly thin and/ or sandy and have limited productivity, although those developed on recent alluvial deposits tend to be quite fertile.

entisols Global Distribution of Soil types in World UPSC | Geography Optional | IAS - PCS

Inceptisols (Few Diagnostic Features)

Another immature order of soils is the Inceptisols. Their distinctive characteristics are relatively faint, not yet prominent enough to produce diagnostic horizons. If the Entisols can be called “youthful,” the Inceptisols might be classified “adolescent.”

  • They are primarily eluvial soils and lack illuvial layers. Like Entisols, Inceptisols are widespread over the world in various environments. Also like Entisols, they include a variety of fairly dissimilar soils whose common characteristic is lack of maturity.
  • They are most common in tundra and mountain areas but are also notable in older valley floodplains. Their world distribution pattern is very irregular. This is also true in the United States, where they are most typical of the Appalachian Mountains, the Pacific Northwest, and the lower Mississippi Valley.

inceptisols Global Distribution of Soil Types in World UPSC | Geography Optional | IAS - PCS

Andisols (Volcanic Ash Soils)

Having developed from volcanic ash, Andisols have been deposited in relatively recent geological time. They are not highly weathered, therefore, and there has been little downward translocation of their colloids.

  • There is minimum profile development, and the upper layers are dark.  Their inherent fertility is relatively high.
  • Andisols are found primarily in volcanic regions of Japan, Indonesia, and South America, as well as in the very productive wheat lands of Washington, Oregon, and Idaho.

andisols Global Distribution of Major Soil Types in the World | Geography Optional | UPSC - IAS

Gelisols (Cold Soils with Permafrost)

Gelisols are young soils with minimal profile development. They develop only slowly because of cold temperatures and frozen conditions. These soils typically have a permafrost layer that is a defining characteristic. Also commonly found in Gelisols is cryoturbation or frost churning, which is the physical disruption and displacement of soil material by freeze–thaw action in the soil.

  • Most of the soil forming processes in Gelisols take place above the permafrost in the active layer that thaws every year or so. Gelisols are the dominant soils of Arctic and subarctic regions. They occur in association with boreal forest and tundra vegetation.
  • Thus, they are primarily found in Russia, Canada, and Alaska and are prominent in the Himalaya Mountain country of central Asia. Altogether nearly 9 percent of Earth’s land area has a Gelisol soil cover.

Gelisols Global Distribution of Soil types in World UPSC | Geography Optional | IAS - PCS

Histosols (Organic Soils on Very Wet Sites)

Least important among the soil orders are the Histosols, which occupy only a small fraction of Earth’s land surface, a much smaller area than any other order. These are organic rather than mineral soils, and they are invariably saturated with water all or most of the time. They may occur in any waterlogged environment but are most characteristic in mid- and high-latitude regions that experienced Pleistocene glaciation.

  • In the United States, they are most common around the Great Lakes, but they also occur in southern Florida and Louisiana. Nowhere, however, is their occurrence extensive.
  • Some Histosols are composed largely of undecayed or only partly decayed plant material, whereas others consist of a thoroughly decomposed mass of muck.
  • The lack of oxygen in the waterlogged soil slows down the rate of bacterial action, and the soil becomes deeper mostly by growing upward, that is, by more organic material being added from above.
  • Histosols are usually black, acidic, and fertile only for water-tolerant plants. If drained, they can be very productive agriculturally for a short while. Before long, however, they are likely to dry out, shrink, and oxidize, a series of steps that leads to compaction, susceptibility to wind erosion, and danger of fire.

Histosols Global Distribution of Soil types in World UPSC | Geography Optional | IAS - PCS

Aridisols (Soils of Dry Climates)

  • Nearly one-eighth of Earth’s land surface is covered with Aridisols, one of the most extensive spreads of any soil order. They are preeminently soils of the dry lands, occupying environments that do not have enough water to remove soluble minerals from the soil. Thus, their distribution pattern is largely correlated with that of desert and semi-desert climates.
  • Aridisols are typified by a thin profile that is sandy and lacking in organic matter, characteristics clearly associated with a dry climate and a scarcity of penetrating moisture. The epipedon is almost invariably light in color. There are various kinds of diagnostic subsurface horizons, nearly all distinctly alkaline.
  • Most Aridisols are unproductive, particularly because of lack of moisture; if irrigated, however, some display remarkable fertility. The threat of salt accumulation is nonetheless ever present.

Aridisols Global Distribution of Soil types in World UPSC | Geography Optional | IAS - PCS

Vertisols (Swelling and Cracking Clays)

Vertisols contain a large quantity of clay that becomes a dominant factor in the soil’s development. The clay of Vertisols is described as “swelling” or “cracking” clay. This clay-type soil has an exceptional capacity for absorbing water: when moistened, it swells and expands; as it dries, deep, wide cracks form, sometimes 2.5 centimeters (an inch) wide and as much as 1 meter (3 feet) deep.

  • Some surface material falls into the cracks, and more is washed in when it rains. When the soil is wetted again, more swelling takes place and the cracks close. This alternation of wetting and drying and expansion and contraction produces a churning effect that mixes the soil constituents (the name Vertisol connotes an inverted condition), inhibits the development of horizons, and may even cause minor irregularities in the land surface.
  • An alternating wet and dry climate is needed for Vertisol formation because the sequence of swelling and contraction is necessary. Thus, the wet–dry climate of tropical and subtropical savannas is ideal, but there must also be the proper parent material to yield the clay minerals. Consequently, Vertisols are widespread in distribution but are very limited in extent.
  • The principal occurrences are in eastern Australia, India, and a small part of East Africa. They are uncommon in the United States, although prominent in some parts of Texas and California. The fertility of Vertisols is relatively high, as they tend to be rich in nutrient bases. They are difficult to till, however, because of their sticky plasticity, and so they are often left uncultivated.

Vertisols Global Distribution of Soil types in World UPSC Geography Optional IAS PCS

Mollisols (Dark, Soft Soils of Grasslands)

The distinctive characteristic of Mollisols is the presence of a mollic epipedon, which is a mineral surface horizon that is dark and thick, contains abundant humus and basic cations, and retains a soft character (rather than becoming hard and crusty) when it dries out.  Mollisols can be thought of as transition soils that evolve in regions not dominated by either humid or arid conditions.

  • They are typical of the mid-latitude grasslands and are thus most common in central Eurasia, the North American Great Plains, and the pampas of Argentina.
  • The grassland environment generally maintains a rich clay–humus content in a Mollisol soil. The dense, fibrous mass of grass roots permeates uniformly through the epipedon and to a lesser extent into the subsurface layers.
  • There is almost continuous decay of plant parts to produce a nutrient-rich humus for the living grass. Mollisols on the whole are probably the most productive soil order.
  • They are generally derived from loose parent material rather than from bedrock and tend to have favorable structure and texture for cultivation. Because they are not overly leached, nutrients are generally retained within reach of plant roots. Moreover, Mollisols provide a favored habitat for earthworms, which contribute to softening and mixing of the soil.

Mollisols Vertisols Global Distribution of Soil types in World UPSC Geography Optional IAS PCS

Alfisols (Clay-Rich B Horizons, High Base Status)

The most wide ranging of the mature soils, Alfisols occur extensively in low and middle latitudes. They are found in a variety of temperature and moisture conditions and under diverse vegetation associations.

  • By and large, they tend to be associated with transitional environments and are less characteristic of regions that are particularly hot or cold or wet or dry.
  • Their global distribution is extremely varied. They are also widespread in the United States, with particular concentrations in the Midwest.
  • Alfisols are distinguished by a subsurface clay horizon and a medium to generous supply of basic cations, plant nutrients, and water. The epipedon is ochric (light-colored), but beyond that, it has no characteristics that are particularly diagnostic and can be considered an ordinary eluviated horizon.
  • The relatively moderate conditions under which Alfisols develop tend to produce balanced soils that are reasonably fertile. Alfisols rank second only to Mollisols in agricultural productivity.

Alfisols Vertisols Global Distribution of Soil types in World UPSC Geography Optional IAS PCS

Ultisols (Clay-Rich B Horizons, Low Base Status)

  • Ultisols are roughly similar to Alfisols except that Ultisols are more thoroughly weathered and more completely leached of nutrient bases. They have experienced greater mineral alteration than any other soil in the mid-latitudes, although they also occur in the low latitudes.
  • Many pedologists believe that the ultimate fate of Alfisols is to degenerate into Ultisols. Typically, Ultisols are reddish as a result of the significant proportion of iron and aluminum in the A horizon. They usually have a fairly distinct layer of subsurface clay accumulation.
  • The principal properties of Ultisols have been imparted by a great deal of weathering and leaching. Indeed, the connotation of the name (derived from the Latin ultimos) is that these soils represent the ultimate stage of weathering.
  • The result is a fairly deep soil that is acidic, lacks humus, and has a relatively low fertility due to the lack of bases. Ultisols have a fairly simple world distribution pattern.
  • They are mostly confined to humid subtropical climates and to some relatively youthful tropical land surfaces.
  • In the United States, they are restricted largely to the southeastern quarter of the country and to a narrow strip along the northern Pacific Coast.

Utisols Vertisols Global Distribution of Soil types in World UPSC Geography Optional IAS PCS

Spodosols (Soils of Cool, Forested Zones)

The key diagnostic feature of a Spodosol is a spodic subsurface horizon, an illuvial dark or reddish layer where organic matter, iron, and aluminum accumulate. The upper layers are light-colored and heavily leached.  At the top of the profile is usually an O horizon of organic litter. Such a soil is a typical result of podzolization.

  • Spodosols are notoriously infertile. They have been leached of useful nutrients and are acidic throughout. They do not retain moisture well and are lacking in humus and often in clay.
  • Spodosols are most widespread in areas of coniferous forest where there is a subarctic climate. Alfisols, Histosols, and Inceptisols also occupy these regions, however, and Spodosols are sometimes found in other environments, such as poorly drained portions of Florida.

Spodosols Vertisols Global Distribution of Soil types in World UPSC Geography Optional IAS PCS

Oxisols (Highly Weathered and Leached)

The most thoroughly weathered and leached of all soils are the Oxisols, which invariably display a high degree of mineral alteration and profile development.

  • They occur mostly on ancient landscapes in the humid tropics, particularly in Brazil and equatorial Africa, and to a lesser extent in Southeast Asia. The distribution pattern is often spotty, with Oxisols mixed with less developed Entisols, Vertisols, and Ultisols. Oxisols’ are totally absent from the United States, except for Hawai‘i, where they are common.
  • Oxisols are essentially the products of laterization (and in fact were called Latosols in older classification systems). They have evolved in warm, moist climates, although some are now found in drier regions, an indication of climatic change since the soils developed.
  • The diagnostic horizon for Oxisols is a subsurface dominated by oxides of iron and aluminum and with a minimal supply of nutrient bases (this is called an oxic horizon).
  • These are deep soils but not inherently fertile. The natural vegetation is efficient in cycling the limited nutrient supply.

Oxisols Vertisols Global Distribution of Soil types in World UPSC Geography Optional IAS PCS

Soil Profile and its Horizons | Diagram and Layers

Soil Profile UPSC Diagram and Layers Geography Optional IAS PCS Gk today UPPCS

Soil Profile | Diagram, Horizons and Layers  | UPSC – IAS

Soil Profile UPSC Diagram and Layers Geography Optional IAS PCS Gk today UPPCSImage – Idealized soil profile. The true soil, or solum, consists of the O, A, E, and B horizons.

The vertical variation of soil properties is not random but rather an ordered layering with depth. Soil tends to have more or less distinctly recognizable layers, called horizons, each with different characteristics.  The horizons are positioned approximately parallel with the land surface, one above the other, normally, but not always, separated by a transition zone rather than a sharp line.

  • A vertical cross section (as might be seen in a road cut or the side of a trench dug in a field) from the Earth’s surface down through the soil layers and into the parent material is referred to as a soil profile. The almost infinite variety of soils in the world are usually grouped and classified on the basis of differences exhibited in their profiles.

Soil Horizons Explanation | UPSC – IAS

  • The O horizon is sometimes the surface layer, and in it organic matter, both fresh and decaying, makes up most of the volume. This horizon results essentially from litter derived from dead plants and animals. It is common in forests and generally absent in grasslands. It is actually more typical for soils not to possess an O horizon; the surface horizon of most soils is the A horizon.
  • The A horizon, colloquially referred to as topsoil, is a mineral horizon that also contains considerable organic matter. It is formed either at the surface or immediately below an O horizon. A horizons generally contain enough partially decomposed organic matter to give the soil a darker color than underlying horizons. They are also normally coarser in texture, having lost some of the finer materials by erosion and eluviation. Seeds germinate mostly in the A horizon.
  • The E horizon is normally lighter in color than either the overlying A or the underlying B horizon. It is essentially an eluvial layer from which clay, iron, and aluminum have been removed, leaving a concentration of abrasion-resistant sand or silt particles.
  • The B horizon, usually called subsoil, is a mineral horizon of illuviation where most of the materials removed from above have been deposited. A collecting zone for clay, iron, and aluminum, this horizon is usually of heavier texture, greater density, and relatively greater clay content than the A horizon.
  • The C horizon is unconsolidated parent material (regolith) beyond the reach of plant roots and most soil-forming processes except weathering. It is lacking in organic matter.
  • The R horizon is bedrock, with little evidence of weathering. True soil, which is called solum, only extends down through the B horizon.

Soil-forming Processes | UPSC – IAS

 soil-forming factors Soil Profile UPSC Diagram and Layers Geography Optional UPSC IAS PCS UPPCS Gk today

Image Explanation -Image Explanation – four soil-forming processes: addition, loss, translocation, transformation. Geologic, climatic, topographic, biological, and chronological (time) soil-forming factors influence the rate at which these four processes occur and therefore the rate at which soil is formed.

The development of any soil is expressed in two dimensions: Depth and time. There is no straight-line relationship between depth and age, however; some soils deepen and develop much more rapidly than others. Four processes deepen and age soils:

  • Addition (ingredients added to the soil),
  • Loss (ingredients lost from the soil),
  • Translocation (ingredients moved within the soil), and
  • Transformation (ingredients altered within the soil).

The five soil-forming factors discussed earlier – Read it from Here –  Soil forming factors Which are responsible for soil development.

  • Geologic,
  • Climatic,
  • Topographic,
  • Biological, and
  • Time – 

These factors influence the rate of these four processes, the result being the development of various soil horizons and the soil profile.

Leaching of Soil upsc | Geography Optional | IAS

eluviation, Leaching of soil upsc IAS geography optional PCS

Leaching of Soil | UPSC – IAS | Geography Optional

For plants, capillary water is the most important and gravitational water is largely superfluous. After gravitational water has drained away, the remaining volume of water represents the field capacity of the soil.

  • If drought conditions prevail and the capillary water is all used up by plants or evaporated, the plants are no longer able to extract moisture from the soil; then, the wilting point is reached.

What is Leaching of Soil ? | UPSC – IAS

  • leaching is the loss of water from water-soluble plant nutrients from the soil, due to rain and irrigation.
  • Water performs a number of important functions in the soil. It is an effective solvent, dissolving essential soil nutrients and making them available to plant roots.
  • These dissolved nutrients are carried downward in solution, to be partly redeposited at lower levels. This process, called leaching, tends to deplete the topsoil of soluble nutrients. Water is also required for many of the chemical reactions of clay and for the actions of the microorganisms that produce humus.
  • In addition, it can have considerable influence on the physical characteristics of soil by moving particles.

What is Eluviation and Illuviation ? | UPSC – IAS

Water can have considerable influence on the physical characteristics of soil by moving particles around and depositing them elsewhere in the soil.

  • For example, as water percolates into the soil, it picks up fine particles of mineral matter from the upper layers and carries them downward in a process called eluviation. These particles are eventually deposited at a lower level, and this deposition process is known as illuviation.

eluviation, Leaching of soil upsc IAS geography optional PCS Image Explanation – In the process of eluviation, fine particles in upper soil layers are picked up by percolating water and carried deeper into the soil. In the process of illuviation, these particles are deposited in a lower soil layer.

Genesis of Soil Structure | Geography Optional | UPSC

genesis of soil structure UPSC IAS

Genesis of Soil Structure | Geography Optional | UPSC IAS

Although the lithosphere encompasses the entire planet, from surface to core, the part that holds our attention here is soil, the topmost layer. Soil is the essential medium in which most terrestrial life is nurtured. Almost all land plants sprout from this precious medium, spread so thinly across the continental surfaces that it has an average worldwide depth of only about 15 centimeters (6 inches).

Despite the implication of the well-known simile “as common as dirt,” soil is remarkably diverse. It is a nearly infinitely varying mixture of weathered mineral particles, decaying organic matter, living organisms, gases, and liquid solutions.

  • Preeminently, however, soil is a zone of plant growth. Soil is a relatively thin surface layer of mineral matter that normally contains a considerable amount of organic material and is capable of supporting living plants.
  • It occupies that part of the outer skin of Earth that extends from the surface down to the maximum depth to which living organisms penetrate, which means basically the area occupied by plant roots. Soil is characterized by its ability to produce and store plant nutrients, an ability made possible by the interactions of such diverse factors as water, air, sunlight, rocks, plants, and animals.
  • Although thinly distributed over the land surface, soil functions as a fundamental interface where atmosphere, lithosphere, hydrosphere, and biosphere meet. The bulk of most soil is inorganic material, so soil is usually classified as part of the lithosphere, but it is intimately related to the other three Earth spheres.

soil genesis and classification UPSC IAS Geography and geology optional PCS UPPCS UPPSC

Image – Vertical cross section from surface to bedrock, showing the relationship between soil and regolith

Genesis of Soil Structure | UPSC IAS

Soil development (Genesis of Soil Structure) begins with the physical and chemical disintegration of rock exposed to the atmosphere and to the action of water percolating down from the surface. This disintegration is called weathering. The basic result of weathering is the weakening and breakdown of solid rock, the fragmentation of coherent rock masses, and the making of little rocks from big ones.

  • The principal product is a layer of loose inorganic material called regolith (“blanket rock”) because it lies like a blanket over the unfragmented rock below. Typically then, the regolith consists of material that has weathered from the underlying rock and that has a crude gradation of particle sizes, with the largest and least fragmented pieces at the bottom, immediately adjacent to the bedrock.
  • Sometimes, however, the regolith consists of material that was transported from elsewhere by the action of wind, water, or ice. Thus, the regolith may vary significantly in composition from place to place.
  • The upper half meter or so of the regolith normally differs from the material below in several ways, most notably in the intensity of biological and chemical processes taking place.
  • This upper portion is soil. It is composed largely of finely fragmented mineral particles, and is the ultimate product of weathering.  It normally also contains an abundance of living plant roots, dead and rotting plant parts, microscopic plants and animals both living and dead, and a variable amount of air and water. Soil is not the end product of a process, but rather a stage in a neverending continuum of physical – chemical–biological processes.

genesis of soil structure UPSC Geography optional IAS UPPCS

Image explanation – Soil develops through a complex interaction of physical, chemical, and biological processes. Parent-material bedrock weathers to regolith, and then plant litter combines with the regolith to form soil. Some of that soil washes to the ocean floor, where, over the expanse of geologic time, it is transformed to sedimentary rock. Someday that ocean floor may be uplifted above sea level and the exposed sedimentary rock will again be weathered into soil.

Genesis of Soil Structure – Principal Soil Forming Factors | UPSC IAS

Soil is an ever-evolving material. Metaphorically, soil acts like a sponge – taking in inputs and being acted upon by the local environment – changing over time and when the inputs or local environment change. Five principal soil forming factors are responsible for soil development:

  • Geology,
  • Climate,
  • Topography,
  • Biology, and
  • Time

Genesis of Soil Structure – The Geologic Factor | UPSC IAS

The source of the rock fragments that make up soil is parent material, which may be either bedrock or loose sediments transported from elsewhere by water, wind, or ice. Whatever the parent material, it is sooner or later disintegrated and decomposed at and near Earth’s surface, providing the raw material for soil formation. The nature of the parent material often influences the characteristics of the soil that develop from it; this factor sometimes dominates all others, particularly in the early stages of soil formation.

  • The chemical composition of parent material is obviously reflected in the resulting soil, and parentmaterial physical characteristics may also be influential in soil development, particularly in terms of texture and structure.
  • Bedrock that weathers into large particles (as does sandstone, for example) normally produces a coarse-textured soil, one easily penetrated by air and water to some depth. Bedrock that weathers into minute particles (shale, for example) yields fine-textured soils with a great number of pores but of very small size, which inhibits air and water from easily penetrating the surface.
  • Young soils are likely to be very reflective of the rocks or sediments from which they were derived. With the passage of time, however, other soil-forming factors become increasingly important, and the significance of the parent material diminishes.
  • Eventually the influence of the parent material may be completely obliterated, so that it is sometimes impossible to ascertain the nature of the rock from which the soil evolved.

Genesis of Soil Structure – The Climatic Factor | UPSC IAS

Temperature and moisture are the climatic variables of greatest significance to soil formation. As a basic generalization, both the chemical and biological processes in soil are usually accelerated by high temperatures and abundant moisture and are slowed by low temperatures and lack of moisture.

  • One predictable result is that soils tend to be deepest in warm, humid regions and shallowest in cold, dry regions. It is difficult to overemphasize the role of moisture moving through the soil.
  • The flow is mostly downward because of the pull of gravity, but it is sometimes sideways in response to drainage opportunities and sometimes, in special circumstances, even upward. Wherever and however water moves, it always carries dissolved chemicals in solution and usually also carries tiny particles of matter in suspension. Thus, moving water is ever engaged in rearranging the chemical and physical components of the soil, as well as contributing to the variety and availability of plant nutrients.
  • In terms of general soil characteristics, climate is likely to be the most influential factor in the long run. This generalization has many exceptions, however, and when soils are considered on a local scale, climate is likely to be less prominent as a determinant.

Genesis of Soil Structure – The Topographic Factor | UPSC IAS

Slope and drainage are the two main features of topography that influence soil characteristics. Wherever soil develops, its vertical extent undergoes continuous, if usually very slow, change. This change comes about through a lowering of both the bottom and top of the soil layer.  The bottom slowly gets deeper as weathering penetrates into the regolith and parent material and as plant roots extend to greater depths. At the same time, the soil surface is being lowered by sporadic removal of its uppermost layer through normal erosion, which is the removal of individual soil particles by running water, wind, and gravity.

  • Where the land is flat, soil tends to develop at the bottom more rapidly than it is eroded away at the top. This does not mean that the downward development is speedy; rather it means that surface erosion is extraordinarily slow.  Thus, the deepest soils are usually on flat land. Where slopes are relatively steep, surface erosion is more rapid than soil deepening, with the result that such soils are nearly always thin and immaturely developed. If soils are well drained, moisture relationships may be relatively unimportant factors in soil development. If soils have poor natural drainage,
  • However, significantly different characteristics may develop. For example, a waterlogged soil tends to contain a high proportion of organic matter, and the biological and chemical processes that require free oxygen are impeded (because air is the source of the needed oxygen and a waterlogged soil contains essentially no air).
  • Most poorly drained soils are in valley bottoms or in some other flat locale because soil drainage is usually related to slope. In some cases, such subsurface factors as permeability and the presence or absence of impermeable layers are more influential than slope.

Genesis of Soil Structure – The Biological Factor | UPSC IAS

From a volume standpoint, soil is about half mineral matter and about half air and water, with only a small fraction of organic matter. However, the organic fraction, consisting of both living and dead plants and animals, is of utmost importance.  The biological factor in particular gives life to the soil and makes it more than just “dirt.” Every soil contains a quantity (sometimes an enormous quantity) of living organisms, and every soil incorporates some (sometimes a vast amount of) dead and decaying organic matter.

  • Vegetation of various kinds growing in soil performs certain vital functions. Plant roots, for instance, work their way down and around, providing passageways for drainage and aeration, as well as being the vital link between soil nutrients and the growing plants.
  • Many kinds of animals contribute to soil development as well. Even such large surface-dwelling creatures as elephants and bison affect soil formation by compaction with their hooves, rolling in the dirt, grazing the vegetation, and dropping excreta. Ants, worms, and all other land animals fertilize the soil with their waste products and contribute their carcasses for eventual decomposition and incorporation into the soil. Many small animals spend most or all of their lives in the soil layer, tunneling here and there, moving soil particles upward and downward, and providing passageways for water and air.
  • Mixing and plowing by soil fauna is sometimes remarkably extensive. Ants and termites, as they build mounds, also transport soil materials from one layer to another. The mixing activities of animals in the soil, generalized under the term bioturbation, tend to counteract the tendency of other soil-forming processes to accentuate the vertical differences among soil layers.
  • The abundance and variety of animal life connected with the soil are quite surprising. Such organisms vary in size from the gigantic to the microscopic, and in numbers from a few per hectare to billions per gram. The organic life of the soil ranges from microscopic protozoans to larger animals that may accidentally alter certain soil characteristics. Of all creatures, however, it is probable that the earthworm is the most important to soil formation and development.

The Biological Factor – (i) – Earthworms | UPSC IAS

The cultivating and mixing activities of earthworms are of great value in improving the structure, increasing the fertility, lessening the danger of accelerated erosion, and deepening the profile of the soil.  The distinctive evidence of this value is that the presence of many well- nourished earthworms is almost always a sign of productive, or potentially productive, soil.

  • The mere presence of earthworms, however, does not guarantee that a soil will be highly productive, as there may be other kinds of inhibiting factors such as a high water table.
  • Nevertheless, an earthworm-rich soil has a higher potential productivity than similar soils lacking earthworms. In various controlled experiments, the addition of earthworms to wormless soil has enhanced plant productivity by several hundred percent.

genesis of soil structure UPSC Geography optional IAS UPPCS UPPSC PCS Gk today

At least seven beneficial functions have been attributed to earthworms:

  • Their innumerable tunnels facilitate drainage and aeration and the deepening of the soil  profile.
  • The continual movement of the creatures beneath the surface tends to bring about the formation  of a crumbly structure, which is generally favorable for plant growth.
  • The soil is further mixed by material being carried and washed downward into their holes from  the surface. This is notably in the form of leaf litter dragged downward by the worms, which  fertilizes the subsoil.
  • The digestive actions and tunneling of earthworms form aggregate soil particles that increase  porosity and resist the impact of raindrops, helping to deter erosion.
  • Nutrients in the soil are increased by the addition of casts excreted by earthworms (casts are  expelled by earthworms and consist of mineral material bound together with decomposed organic  material), which have been shown to be 5 times richer in available nitrogen, 7 times richer in  available phosphates, and 11 times richer in available potash than the surrounding soil.
  • They rearrange material in the soil, especially by bringing deeper matter to the surface, where  it can be weathered more rapidly. Where earthworms are numerous, they may deposit as much as 9000  kg/ hectare (25 tons/acre) of casts on the surface in a year.
  • Nitrification is also promoted by the presence of earthworms, due to increased aeration,  alkaline fluids in their digestive tracts, and the decomposition of earthworm carcasses. In many parts of the world, of course, earthworms are lacking. They are, for example almost totally  absent from arid and semiarid regions. In these dry lands, some of the earthworm’s soil-enhancing  functions are carried out by ants and earth-dwelling termites, but much less effectively.

The Biological Factor – (ii) – Microorganisms in the Soil | UPSC IAS

  • Another important component of the biological factor is microorganisms, both plant and animal, that occur in uncountable billions. An estimated three-quarters of a soil’s metabolic activity is generated by microorganisms.
  • These microbes help release nutrients from dead organisms for use by live ones by decomposing organic matter and by converting nutrients to forms usable by plants. Algae, fungi, protozoans, actinomycetes, and other minuscule organisms all play a role in soil development, but bacteria probably make the greatest contribution overall. This is because certain types of bacteria are responsible for the decomposition and decay of dead plant and animal material and the consequent release of nutrients into the soil.

Genesis of Soil Structure – The Time Factor | UPSC IAS

  • For soil to develop on a newly exposed land surface requires time, with the length of time needed varying according to the nature of the exposed parent material and the characteristics of the environment.
  • Soil-forming processes are generally very slow, and many centuries may be required for a thin layer of soil to form on a newly exposed surface. A warm, moist environment is conducive to soil development. Normally of much greater importance, however, are the attributes of the parent material. For example, soil develops from sediments relatively quickly and from bedrock relatively slowly.

The Time Factor – Soil Erosion | UPSC IAS

Most soil develops with geologic slowness – so slowly that changes are almost imperceptible within a human life span. It is possible, however, for a soil to be degraded, either through the physical removal associated with accelerated erosion or through depletion of nutrients, in only a few years.

  • Soils that have fine textures – especially those with low rates of rainwater infiltration – tend to be those that are most easily eroded by rainwater runoff and wind;
  • Steep slopes and lack of a vegetation cover also increase the likelihood of erosion. In regions where single-crop agriculture (“monoculture”) is practiced, fields are often left bare and unplanted for several months each year, increasing the likelihood of erosion.
  • Estimates of the amount of agricultural land lost to soil erosion vary greatly. In the United States, some researchers estimate that nearly 40 percent of the productive soil in the wheat growing Palouse region of Washington and Idaho, and as much as 50 percent of the topsoil of Iowa, has been lost to erosion over the last 150 years.
  • Globally, perhaps 10 million hectares of cropland are lost each year to soil erosion – a rate that is 10 to 40 times faster than productive soil can develop. It is important to realize that in the grand scale of geologic time, soil can be formed and reformed, but in the dimension of human time, it is a mostly nonrenewable resource.

Köppen Climate Classification System | Geography Optional | UPSC – IAS

The modified Köppen climatic classification. There are 5 major climate groups (and the special category of Highland) and 15 individual climate types.

The Köppen Climate Classification System | UPSC – IAS 

To cope with the great diversity of information encompassed by the study of global climate distribution, we need a classification scheme to simplify, organize, and generalize a vast array of data.

The Koppen climate classification system is by far the most widely used modern climate classification system. Wladimir Köppen (1846–1940; pronounced like “kur-pin” with a silent r) was a Russian-born German climatologist who was also an amateur botanist.

  • The first version of his climate classification scheme appeared in 1918, and he continued to modify and refine it for the rest of his life, the last version being published in 1936.
  • The system uses as a database only the average annual and average monthly values of temperature and precipitation, combined and compared in a variety of ways. Consequently, the necessary statistics are commonly tabulated and easily acquired.
  • Data for any location (called a station) on Earth can be used to determine the precise classification of that place, and the geographical extent of any recognized climatic type can be determined and mapped. This means that the classification system is functional at both the local and the global scale.
  • Koppen defined four of his five major climatic groups primarily by temperature characteristics, the fifth (the B group) on the basis of moisture. He then subdivided each group into climate types according to various temperature and precipitation relationships.
koppen climate classification system code letters

Image Explanation – The modified Köppen climatic classification. There are 5 major climate groups (and the special category of Highland) and 15 individual climate types.

Modified Köppen system | UPSC IAS | Geography Optional

Köppen was unsatisfied with his last version and did not consider it a finished product. Thus, many geographers and climatologists have used the Köppen system as a springboard to devise systems of their own or to modify Koppen’s classifications.

Modified Köppen system encompasses the basic design of the Koppen system but with a variety of minor modifications. Some of these modifications follow the lead of Glen Trewartha, who was a geographer and climatologist at the University special category of highland (H) climate.

Climatic regions over land areas (modified Köppen system). UPSC IAS PCS Gk TODAYClimatic regions over land areas UPSC IAS

Image: Climatic regions over land areas (modified Koppen system).

Köppen Letter Code System | UPSC IAS | Geography Optional 

In the modified Koppen system, each climate type is designated by a descriptive name and by a series of letters defined by specific temperature and/or precipitation values (image).

  • The first letter designates the major climate group,
  • The second letter usually describes precipitation patterns, and
  • The third letter (if any) describes temperature patterns.

Although the letter code system seems complicated at first, it provides a shorthand method for summarizing key characteristics of each climate.

For example,  If we look for the definitions of the letters in Csa, one of the letter code combinations for a mediterranean climate, we see that:

C = Mild mid latitude climate
s = Summer dry season
a = Hot summers

Time zones and International date line | UPSC – IAS

24 time zones of the world IAS UPSC gk Today PCS UPPCS UPPSC

Time zones and International date line | UPSC – IAS

Comprehending time around the world depends on an understanding of both the geographic grid of latitude and longitude, and of Earth–Sun relations. As Malcolm Thomson, a Canadian authority on the physics of time has noted, there are really only three natural units of time:

  • The tropical year, marked by the return of the seasons;
  • The lunar month, marked by the return of the new moon; and
  • The day, marked by passage of the Sun.

All other units of time measurement – such as a second, an hour, or a century—are human-made to meet the needs of society.

24 time zones of the world IAS UPSC gk Today PCS UPPCS UPPSC

Image Explanation – The 24 time zones of the world, each based on central meridians spaced 15° apart. Especially over land areas, these boundaries have been significantly adjusted.

International Date Line | UPSC – IAS

In 1519, Ferdinand Magellan set out westward from Spain, sailing for East Asia with 241 men in five ships. Three years later, the remnants of his crew (18 men in one ship) successfully completed the first circumnavigation of the globe. Although a careful log had been kept, the crew found that their calendar was one day short of the correct date. This was the first human experience with time change on a global scale, the realization of which eventually led to the establishment of the International Date Line.

  • One advantage of establishing the Greenwich meridian as the prime meridian is that its opposite arc is in the Pacific Ocean. The 180th meridian, transiting the sparsely populated mid-Pacific, was chosen as the meridian at which new days begin and old days exit from the surface of Earth.
  • The International Date Line deviates from the 180th meridian in the Bering Sea to include all of the Aleutian Islands of Alaska within the same day and again in the South Pacific to keep islands of the same group (Fiji, Tonga) within the same day.
  • The extensive eastern displacement of the date line in the central Pacific is due to the widely scattered locations of the many islands of the country of Kiribati. The International Date Line is in the middle of the time zone defined by the 180° meridian. Consequently, there is no time (i.e., hourly) change when crossing the International Date Line – only the calendar changes, not the clock. When you cross the International Date Line going from west to east, it becomes one day earlier (e.g., from January 2 to January 1); when you move across the line from east to west, it becomes one day later (e.g., from January 1 to January 2).

Standard Time | UPSC – IAS

At the 1884 International Prime Meridian Conference in Washington, D.C., countries agreed to divide the world into 24 standard time zones, each extending over 15° of longitude. The mean local solar time of the Greenwich (prime) meridian was chosen as the standard for the entire system. The prime meridian became the center of a time zone that extends 7.5° of longitude to the west and 7.5° to the east of the prime meridian. Similarly, the meridians that are multiples of 15° both east and west of the prime meridian, were set as the central meridians for the 23 other time zones

Although Greenwich Mean Time (GMT) is now referred to as Universal Time Coordinated (UTC), the prime meridian is still the reference for standard time. Because it is always the same number of minutes after the hour in all standard time zones (keeping in mind that a few countries, such as India, do not adhere to standard one-hour-interval time zones).

  • To know the exact local time, we usually need to know only how many hours later or earlier our local time zone is compared to the time in Greenwich. Figure 1-31 shows the number of hours later or earlier than UTC it is in each time zone of the world.
  • Most of the countries of the world are sufficiently small in their east–west direction so as to lie totally within a single time zone. However, large countries may encompass several zones: Russia occupies nine time zones; including Alaska and Hawai‘i, the United States spreads over six, Canada, six; and Australia, three.
  • In international waters, time zones are defined to be exactly 7°30´ to the east and 7°30´ to the west of the central meridians. Over land areas, however, zone boundaries vary to coincide with appropriate political and economic boundaries. For example, continental Europe from Portugal to Poland shares one time zone, although longitudinally covering about 30°.
  • At the extreme, China extends across four 15° zones, but the entire nation, at least officially, observes the time of the 120° east meridian, which is the one closest to Beijing.

Times zones for Canada, the United States, and northern Mexico. UPSC IAS PCS UPPCS UPPSC

Image Explanation – Times zones for Canada, the United States, and northern Mexico. The number in each time zone refers to the number of hours earlier than UTC (GMT).

In each time zone, the central meridian marks the location where clock time is the same as mean Sun time  (i.e., the Sun reaches its highest point in the sky at 12:00 noon). On either side of that meridian, of course, clock time does not coincide with Sun time. The deviation between the two is shown for one U.S. zone in Figure 1-33. From the map of time zones of the United States (Figure 1-32), we can recognize a great deal of manipulation of the time zone boundaries for economic and political convenience. For example, the Central Standard Time Zone, centered on 90° W extends all the way to 105° W (which is the central meridian of the Mountain Standard Time Zone) in Texas to keep most of that state within the same zone. By contrast, El Paso, Texas, is officially within the Mountain Standard Time Zone in accord with its role as a major market center for southern New Mexico, which observes Mountain Standard Time. In the same vein, northwestern Indiana is in the Central Standard Time Zone with Chicago.

Daylight-Saving Time | UPSC – IAS

To conserve energy during World War I, Germany ordered all clocks set forward by an hour. This practice allowed the citizenry to “save an hour of daylight by shifting the daylight period into the usual evening hours, thus reducing the consumption of electricity for lighting.

The United States began a similar policy in 1918, but many localities declined to observe “summer time” until the Uniform Time Act made the practice mandatory in all states that had not deliberately exempted themselves. Hawai‘i, and parts of Indiana and Arizona, have exempted themselves from observance of daylight-saving time under this act.

Standard clock time versus Sun time. The Sun reaches its highest point in the sky at 12:00 noon in St. Louis and New Orleans because these two cities lie on the central meridian. For places east of the central meridian, the Sun is highest in the sky a few minutes before standard time noon; for locations west, local solar noon is a few minutes after. In Chicago, for instance, the Sun is highest in the sky at 11:50 A.M. and in Dallas it is highest in the sky at 12:28 P.M. UPSC IAS PCS

Image Explanation – Standard clock time versus Sun time. The Sun reaches its highest point in the sky at 12:00 noon in St. Louis and New Orleans because these two cities lie on the central meridian. For places east of the central meridian, the Sun is highest in the sky a few minutes before standard time noon; for locations west, local solar noon is a few minutes after. In Chicago, for instance, the Sun is highest in the sky at 11:50 A.M. and in Dallas it is highest in the sky at 12:28 P.M.

  • Russia has adopted permanent daylight-saving time (and double daylight-saving time – two hours ahead of Sun time – in the summer).
  • In recent years, Canada, Australia, New Zealand, and most of the nations of western Europe have also adopted daylight-saving time.
  • In the Northern Hemisphere, many nations, like the United States, begin daylight-saving time on the second Sunday in March (in the spring we “spring forward” one hour) and resume standard time on the first Sunday in November (in the fall we “fall back” one hour).
  • In the tropics, the lengths of day and night change little seasonally, and there is not much twilight. Consequently, daylight-saving time would offer little or no savings for tropical areas.

Origin and Interior of the earth and Age of Earth | UPSC IAS

UPSC IAS Geology Optional

Origin and Interior of the earth and Age of Earth | UPSC – IAS

Origin of Earth and Universe

The origin of Earth, and indeed of the universe, is incompletely understood. It is generally accepted that the universe began with a cosmic event called the big bang. The most widely held view is that the big bang took place some 13.7 billion years ago – similar to the age of the oldest known stars.

  • The big bang began in a fraction of a second as an infinitely dense and infinitesimally small bundle of energy containing all of space and time started to expand away in all directions at extraordinary speeds, pushing out the fabric of space and filling the universe with the energy and matter we see today.
  • Origin of Our solar system originated between 4.5 and 5 billion years ago when a nebula – a huge, cold, diffuse cloud of gas and dust – began to contract inward, owing to its own gravitational collapse, forming a hot, dense protostar.
  • This hot center “our Sun” was surrounded by a cold, revolving disk of gas and dust that eventually condensed and coalesced to form the planets.

birth of the solar system. UPSC IAS PCS UPPCS gk today

Image ExplanationThe origin of the solar system. (1) Diffuse gas cloud, or nebula, begins to contract inward. (2) Cloud flattens into nebular disk as it spins faster around a central axis. (3) Particles in the outer parts of the disk collide with each other to form protoplanets. (4) Protoplanets coalesce into planets and settle into orbits around the hot center. (5) The final product: a central Sun surrounded by eight orbiting planets (solar system not shown in correct scale). The original nebular disk was much larger than our final solar system.

All of the planets revolve around the Sun in elliptical orbits, with the Sun located at one focus (looking “down” on the solar system from a vantage point high above the North Pole of Earth, the planets appear to orbit in a counterclockwise direction around the Sun).

  • All the planetary orbits are in nearly the same plane, perhaps revealing their relationship to the original spinning direction of the nebular disk. The Sun rotates on its axis from west to east.
  • Moreover, most of the planets rotate from west to east on their own axes (Uranus rotates “sideways” with its rotational axis almost parallel to its orbital plane; Venus rotates from east to west). The planets revolve more slowly and generally have a lower temperature as their distance from the Sun increases.

The structure of the Milky Way Galaxy UPSC IAS Gk today PCS UPPCSImage Explanation – The structure of the Milky Way Galaxy showing the approximate location of our Sun on one of the spiral arms.

The Planets – Inner and Outer | UPSC – IAS

Inner Planets

  • The four inner terrestrial planets  Mercury, Venus, Earth, and Mars  – are generally smaller, denser, and less oblate (more nearly spherical), and
  • They rotate more slowly on their axes than the four outer Jovian planets – Jupiter, Saturn, Uranus, and Neptune. Also, the inner planets are composed principally of mineral matter and, except for airless Mercury, have diverse but relatively shallow atmospheres.

Outer planets or Jovian Planets or Giant Planets 

By contrast, the four Jovian planets tend to be much larger, more massive (although they are less dense), and much more oblate (less perfectly spherical) because they rotate more rapidly. The Jovian planets are mostly composed of elements such as hydrogen and helium – liquid near the surface, but frozen toward the interior – as well as ices of compounds such as methane and ammonia.

The Jovian planets generally have atmospheres that are dense, turbulent, and relatively deep. It was long thought that tiny Pluto was the ninth and outermost planet in the solar system.

  • In recent years, however, astronomers have discovered other icy bodies, such as distant Eris, Makemake, and Haumea that are similar to Pluto and orbiting the Sun beyond Neptune in what is referred to as the Kuiper Belt or trans-Neptunian region.
  • In June 2008 the International Astronomical Union reclassified Pluto as a special type of dwarf planet known as a plutoid. Some astronomers speculate that there may be several dozen yet-to-be-discovered plutoids and other dwarf planets in the outer reaches of the solar system.

The Size and Shape of Earth | UPSC – IAS

Is Earth large or small? The answer to this question depends on one’s frame of reference. If the frame of reference is the universe, Earth is almost infinitely small.

The diameter of our planet is only about 13,000 kilometers (7900 miles), a tiny distance at the scale of the universe – For instance – The Moon is 385,000 kilometers (239,000 miles) from Earth, The Sun is 150,000,000 kilometers (93,000,000 miles) away, and the nearest star is 40,000,000,000,000 kilometers (25,000,000,000,000 miles) distant.

Size of the earth UPSC IAS PCS UPPCS UPPSC Gk today

Image Explanation: Earth is large relative to the size of its surface features. Earth’s maximum relief (the difference in elevation between the highest and lowest points) is 19,883 meters (65,233 feet) or about 20 kilometers (12 miles) from the top of Mount Everest to the bottom of the Mariana Trench in the Pacific Ocean.

The Size of Earth | UPSC – IAS

In a human frame of reference, however, Earth is impressive in size. Its surface varies in elevation from the highest mountain peak, Mount Everest, at 8850 meters (29,035 feet) above sea level, to the deepest oceanic trench, the Mariana Trench of the Pacific Ocean, at 11,033 meters (36,198 feet) below sea level, a total difference in elevation of 19,883 meters (65,233 feet).

Although prominent on a human scale of perception, this difference is minor on a planetary scale. If Earth were the size of a basketball, Mount Everest would be an imperceptible pimple no greater than 0.17 millimeter (about 7 thousandths of an inch) high.

Similarly, the Mariana Trench would be a tiny crease only 0.21 millimeter (about 8 thousandths of an inch) deep— this represents a depression smaller than the thickness of a sheet of paper.

  • Our perception of the relative size of topographic irregularities on Earth is often distorted by three-dimensional wall maps and globes that emphasize such landforms.  To portray any noticeable appearance of topographic variation, the vertical distances on such maps are usually exaggerated 8 to 20 times their actual proportional dimensions – as are many diagrams used in this book. Further, many diagrams illustrating features of the atmosphere also exaggerate relative sizes to convey important concepts.
  • More than 2600 years ago Greek scholars correctly reasoned Earth to have a spherical shape. About 2200 years ago, Eratosthenes, the director of the Greek library at Alexandria, calculated the circumference of Earth trigonometrically. He determined the angle of the noon Sun rays at Alexandria and at the city of Syene, 960 kilometers (600 miles) away. From these angular and linear distances he was able to estimate an Earth circumference of almost 43,000 kilometers (26,700 miles) which is reasonably close to the actual figure of 40,000 kilometers (24,900 miles).

The Shape of Earth | UPSC – IAS 

  • Earth is almost, but not quite, spherical. The cross section revealed by a cut through the equator would be circular, but a similar cut from pole to pole would be an ellipse rather than a circle. Any rotating body has a tendency to bulge around its equator and flatten at the polar ends of its rotational axis.  Although the rocks of Earth may seem quite rigid and immovable to us, they are sufficiently pliable to allow Earth to develop a bulge around its middle.
  • The slightly flattened polar diameter of Earth is 12,714 kilometers (7900 miles), whereas the slightly bulging equatorial diameter is 12,756 kilometers (7926 miles), a difference of only about 0.3 percent. Thus, our planet is properly described as an oblate spheroid rather than a true sphere. However, because this variation from true sphericity is exceedingly small, in most cases in this book we will treat Earth as if it were a perfect sphere.

Read – Earth’s Interior- Crust, Mantle and Core 

Physical conditions of the Earth’s Interior- Crust, Mantle and Core | UPSC

Physical conditions of the Earth’s Interior- Crust, Mantle and Core | UPSC IAS PCS Gk today

THE STRUCTURE OF EARTH | UPSC – IAS | Geography Optional

Physical conditions of the Earth’s Interior | UPSC – IAS

Our knowledge of the Earth’s Interior is based largely on indirect evidence. No human activity has explored more than a minute fraction of the vastness beneath the surface. No one has penetrated as much as one-thousandth of the radial distance from the surface to the center of Earth;

  • The deepest existing mine shaft extends a mere 3.8 kilometers (2.4 miles). Nor have probes extended much deeper;
  • The deepest drill holes from which sample cores have been brought up have penetrated only a modest 12 kilometers (8 miles) into Earth.

Physical conditions of the Earth’s Interior- Crust, Mantle and Core | UPSC IAS PCS Gk today

Image Explanation – The vertical structure of Earth’s interior. (a) Below the thin outer crust of Earth is the broad zone of the mantle, and below the mantle are the liquid outer core and the solid inner core. (b) Idealized cross section through Earth’s crust and part of the mantle. The crust and uppermost mantle, both rigid zones, are together called the lithosphere—the “plates” of plate tectonics. In the asthenosphere, the mantle is hot and therefore weak and easily deformed. In the lower mantle, the rock is generally rigid again.

Earth scientists, in the colorful imagery of writer John McPhee, “are like dermatologists: they study, for the most part, the outermost two per cent of the earth. They crawl around like fleas on the world’s tough hide, exploring every wrinkle and crease, and try to figure out what makes the animal move.

  • Even so, a considerable body of inferential knowledge concerning Earth’s interior has been amassed by geophysical means, primarily by monitoring patterns of vibrations transmitted through Earth from earthquakes or from human made explosions.
  • Such seismic waves change their speed and direction whenever they cross a boundary from one type of material to another. Analysis of these changes, augmented by related data on Earth’s magnetism and gravitational attraction, has enabled Earth scientists to develop a model of Earth’s internal structure.

Earth’s Hot Interior | UPSC – IAS

In general, temperature and pressure increase with depth inside Earth, with the highest temperatures and pressures at the center.

  • The source of this warmth is largely from the release of energy from the decay of radioactive elements (in much the same way as the decay of radioactive material supplies the warmth to power a nuclear power plant).
  • As we will see, it is the transfer of heat from Earth’s interior that drives many Earth processes such as plate tectonics and volcanism

 Earth’s Interior – The Crust | UPSC – IAS

The crust, the outermost shell, consists of a broad mixture of rock types. Beneath the oceans the crust has an average thickness of only about 7 kilometers (4 miles), whereas beneath the continents the thickness averages more than five times as much, and in places exceeds 70 kilometers (40 miles).

  • Oceanic crust is thinner but is comprised of denser (“heavier”) rocks than continental crust. In general within the crust there is a gradual increase in density with depth. Altogether, the crust makes up less than 1 percent of Earth’s volume and about 0.4 percent of Earth’s mass.
  • At the base of the crust there is a significant change in mineral composition. This relatively narrow zone of change is called the Mohorovicˇic´ discontinuity, or simply the Moho for short, named for the Yugoslavian seismologist Andrija Mohorovicˇic´ (1857–1936) who discovered it.

 Earth’s Interior – The Mantle | UPSC – IAS

Beneath the Moho is the mantle, which extends downward to a depth of approximately 2900 kilometers (1800 miles). In terms of volume, the mantle is by far the largest of the four layers. Although its depth is only about one half the distance from the surface to the center of Earth, its location on the periphery of the sphere gives it a vast breadth. It makes up 84 percent of the total volume of Earth and about two-thirds of Earth’s total mass. There are three sublayers within the mantle, as Image shows.

  • The uppermost zone is relatively thin but hard and rigid, extending down to a depth of 65 to 100 kilometers (40 to 60 miles)—somewhat deeper under the continents than under the ocean floors. This uppermost mantle zone together with the overlying oceanic or continental crust is called the lithosphere.  “lithosphere” refers specifically to the combination of the crust and upper rigid mantle—and as we’ll see shortly, it is large pieces of the lithosphere that are the “plates” of plate tectonics. Beneath the rigid layer of the lithosphere, and extending downward to a depth of as much as 350 kilometers (200 miles), is a mantle zone in which the rocks are hot enough that they lose much of their strength and become “plastic”—they are easily deformed, somewhat like tar. This is called the asthenosphere (“weak sphere”). Below the asthenosphere is the lower mantle, where the rocks are very hot, but largely rigid again because of higher pressures.

 Earth’s Interior – The Inner and Outer Cores | UPSC – IAS

  • Beneath the mantle is the outer core (Image), thought to be molten (liquid) and extending to a depth of about 5000 kilometers (3100 miles). The innermost portion of Earth is the inner core, an evidently solid (because of extremely high pressure) and very dense mass having a radius of about 1450 kilometers (900 miles). Both the inner and outer cores are thought to be made of iron/nickel or iron/silicate.
  • These two zones together make up about 15 percent of Earth’s volume and 32 percent of its mass. A common misconception is that the liquid outer core of Earth is the source of molten rock (“magma” and “lava”) that is expelled by volcanoes, but this is not the case.
  • Instead, the near-surface mantle is the source for magma, while Earth’s cores are the source of energy that drives the slow movement of hot rock through the mantle toward the surface (through the process of convection).
  • This rising hot rock in the mantle is under so much pressure that it remains essentially solid— only when this rising mantle material is very close to the surface is pressure low enough for it to melt.

 Earth’s Interior – Earth’s Magnetic Field | UPSC – IAS

Earth’s magnetic field is generated in the outer core: convective circulation within the conductive liquid iron and nickel outer core, spiraling in line with Earth’s rotational axis, induces the magnetic field of our planet through what is sometimes called a geodynamo.

  • Interestingly, the strength and orientation of the magnetic field changes over time, and the location of the north magnetic pole does not exactly match the true geographic North Pole.
  • The position of the north magnetic pole slowly but continually drifts several tens of kilometers each year—it is currently located at about 86° N, 147° W – but the position of the north magnetic pole can even change significantly during a single day!
  • In addition, for reasons that are not completely understood, at irregular intervals of thousands to millions of years, the polarity of Earth’s magnetic field reverses, with the north magnetic pole becoming the south. A record of these magnetic polarity reversals has been recorded in the iron rich rocks of the ocean floor.

Sunspot Cycle – Help Understanding Aditya L1 Mission | UPSC IAS

Sunspot Cycle UPSC IAS PCS the Hindu Gk today

Sunspot Cycle UPSC IAS PCS the Hindu Gk today

These two images of the Sun show how the number of sunspots varies over the course of a sunspot cycle. The image on the left, with many sunspots, was taken near solar max in March 2001. The right hand image, in which no spots are evident, was taken near solar min in January 2005. 
Images courtesy SOHO (NASA/ESA).

Recently, scientists from Indian Institute of Science Education and Research have developed a way of predicting the intensity of activity in the next solar cycle (from 2020 to 2031).

What is Sunspot Cycle?

  • The amount of magnetic flux that rises up to the Sun’s surface varies with time in a cycle called the solar cycle. This cycle lasts 11 years on average. This cycle is referred to as the sunspot cycle.
  • They are darker, magnetically strong, cooler areas on the surface of the sun in a region called the photosphere.

What is the Significance of this ?

  • It will help in understanding of the long-term variations of the Sun and its impact on earth climate which is one of the objectives of India’s first solar probe – ‘Aditya L1 Mission’.
  • The forecast will be also useful for scientific operational planning of the Aditya mission

How does Sunspot Cycle affect the Earth?

  • An important reason to understand sunspots is that they affect space weather.
  • During extreme events, space weather can affect electronics-driven satellite controls, communications systems, air traffic over polar routes and even power grids.
  • Some believe that they are correlated with climate on earth. For instance, during past periods of low sunspot activity, some parts of Europe and North America experienced lower-than-average temperatures.

Great Indian bustard (Ardeotis Nigriceps) – Population Fall | UPSC IAS

Great Indian bustard (Ardeotis Nigriceps) - Population Fall UPSC IAS

Great Indian bustard (Ardeotis Nigriceps) - Population Fall  UPSC IAS

Great Indian bustard (Ardeotis Nigriceps) – Population Fall | UPSC – IAS

A recent study suggests that, Great Indian Bustard population has been falling continuously, from around 1,260 in 1969 to less than 200 in 2018.

About Great Indian bustard (Ardeotis Nigriceps)

  • It’s among the heaviest bird with a horizontal body and long bare legs giving it an ostrich like appearance.
  • Habitat: Arid and semi-arid grasslands, open country with thorn scrub, tall grass interspersed with cultivation. It avoids irrigated areas.
  • Currently, it is found in only six states in the country –
    • Madhya Pradesh,
    • Gujarat,
    • Maharashtra,
    • Andhra Pradesh,
    • Rajasthan and
    • Karnataka.
  • It is endemic to Indian Sub-continent, found in central India, western India and eastern Pakistan.
  • Protection: Listed in Schedule I of the Wildlife (Protection) Act, 1972 and Critically Endangered on the IUCN Red List
  • It is also listed in Appendix I of CITES and covered under CMS or Bonn Convention.
  • Bustard Species Found In India: Great Indian Bustard, the Lesser Florican and the Bengal Florican; Houbara also belong to Bustard family but it’s a migratory species.
  • Importance to Ecosystem: GIB is an indicator species for grassland habitats and its gradual disappearance from such environments shows their deterioration.
  • Once the species is lost, there will be no other species to replace it, and that will destabilise the ecosystem of the grassland and affect critical bio-diversities, as well as blackbucks and wolves, who share their habitat with the GIB.
  • Threat: Hunting, poaching, habitat erosion, ‘greening’ projects that transform arid grasslands to wooded areas, change of land use from grassland to farmland, collisions with high tension electric wires, fast moving vehicles and free-ranging dogs in villages

Great Indian bustard (Ardeotis Nigriceps) - Population Fall | UPSC IAS PIB PCS UPPCS UPPSC the Hindu

Conservation Steps:

Great Indian Bustard, popularly known as ‘Godawan’, is Rajasthan’s state bird. The state government has started “Project Godawan” for its conservation at Desert National Park (DNP) in Jaisalmer. It’s one of the Species for The Recovery Programme under the Integrated Development of Wildlife Habitats of the Ministry of Environment and Forests.

Integrated Development of Wildlife Habitats | UPSC – IAS

It is a Centrally Sponsored Scheme where GoI provides financial and technical assistance to the State/UT Governments for activities aimed at wildlife conservation. The scheme has three components viz- Support to Protected Areas (National Parks, Wildlife Sanctuaries, Conservation Reserves and Community Reserves), Protection of Wildlife Outside Protected Area and Recovery programmes for saving critically endangered species and habitats.

Great Indian bustard (Ardeotis Nigriceps) Recovery Programme

  • It recommends linking local livelihoods with bustard conservation
  • A profitable and equitable mechanism to share revenues generated from ecotourism with local communities should be developed
  • For effective conservation, the guidelines direct state governments to identify the core breeding areas for bustards and keep them inviolate from human disturbances
  • The guidelines suggest restriction on infrastructure development and land use diversion for roads, high tension electric poles, intensive agriculture, wind power generators and construction
  • Only low intensity, traditional pastoral activities should be allowed, that too, not during the breeding season, say the guidelines

Convention on the Conservation of Migratory Species of Wild Animals (CMS) or Bonn convention

  • It is the only convention under UNEP which provides a global platform for the conservation and sustainable use of migratory animals and their habitats ( and their migration routes). India is a member of the convention.
  • Migratory species threatened with extinction are listed on Appendix I of the Convention.

Blue Economy its Significance and Challenges | UPSC – IAS

Blue Economy upsc

Blue Economy upsc

Blue Economy and its Components | UPSC – IAS

As per the World Bank, Blue Economy is the sustainable use of ocean resources for economic growth, improved livelihoods, and jobs while preserving the health of ocean ecosystem. It covers several sectors linked directly or indirectly to the oceans such as –

  • Fishing, minerals, shipping and port infrastructure,
  • Marine biotechnology,
  • Marine renewable energy,
  • Marine tourism,
  • Ocean governance and education.

Blue Economy its Significance and Challenges | UPSC - IAS

Significance of Blue economy | UPSC – IAS

Economic Benefits:

  • Oceans provide 30 percent of oil and gas resources.
  • 90% of goods trade takes place through Oceans Sea of Line Communication.
  • Ocean contributes $2.5 trillion to world economy with around 60 million people are employed in fisheries and aquaculture.
  • Seabed Mining of polymetallic nodules and polymetallic sulphides to extract nickel, cobalt, manganese and rare earth metals.

Environmental Benefits:

  • Mangroves and other vegetated ocean habitats sequester 25 percent of the extra CO2 from fossil fuels, i.e., Blue Carbon.
  • Protection of coastal communities from disasters like floods and storms.
  • A Sustainable Blue Economy can help to achieve commitments under UN’s Sustainable Development Goals 2030, Paris climate agreement 2015 and the UN Ocean Conference 2017.

Challenges to Blue Economy | UPSC – IAS

  • Unsustainable development near marine areas: Physical alterations and destruction of marine and coastal habitats & landscapes largely due to coastal development, deforestation, & mining.
  • FAO estimates that approximately 57 percent of fish stocks are fully exploited and another 30 percent are over-exploited, depleted, or recovering.
  • Marine pollution: It is in the form of excess nutrients from untreated sewerage, agricultural
    runoff, and marine debris such as plastics. Deep sea mining can cause long term irreversible ecological damage to marine ecosystem.
  • Impacts of climate change: Threats of both slow-onset events like sea-level rise and more intense and frequent weather events like cyclones. Long-term climate change impacts on ocean systems like changes in sea temperature, acidity, and major oceanic currents.
  • Geopolitical issues: Geopolitical tussle between in various regions like South China Sea, Indian Ocean Region etc. and undermining International Laws like UNCLOS limits the countries from achieving the full potential of Blue Economy.
  • Unfair trade practices: Many times fishing agreements allow access to an EEZ of country to foreign operators. These operators restrict transfer of specific fishing knowledge to national stakeholders leading to low appropriation of fisheries export revenues by national operators. So the potential for national exploitation of those resources is reduced in the long run.
  • Other non-conventional threats: Defense and security related threats like piracy and terrorism combined with natural disasters (Small Island Developing States are particularly vulnerable).

Blue economy and India  | UPSC – IAS

India is trying to achieve the potential of Blue Economy by promoting the spirit of ‘SAGAR-Security and Growth for All in the Region’ in Indian Ocean Region. Some initiatives by India are:  (important for UPSC)

Sagarmala Project: Sagarmala initiative focus on three pillars of development

  • Supporting and enabling Port-led Development through appropriate policy and institutional interventions.
    • Port Infrastructure Enhancement, including modernization and setting up of new ports.
    • Efficient Evacuation to and from hinterland by developing new lines/linkages for transport (including roads, rail, inland waterways and coastal routes).
  • Coastal Economic Zones: 14 CEZs are being developed under Sagarmala initiative covering all the Maritime States.
    • CEZs are spatial economic regions comprising of a group of coastal districts or districts with a strong linkage to the ports in that region.
    • CEZ will help to tap synergies of planned economic corridors.
  • Resource exploration: India in recent times has shifted its focus towards Indian Ocean resource exploration. E.g. India has explored 75000 sq km of Indian Ocean Seabed and is developing technologies (like remotely operated vehicles) for mining the resources
  • International relations and security: India is cooperating with Indian Ocean littoral countries and projecting itself as ‘net security provider’ to ensure a safe, secure and stable Indian Ocean Region (IOR). India is also cooperating with extra regional powers like US, Japan in IOR. E.g. Asia-Africa growth corridor, QUAD etc.

Sustainable Blue Economy Conference

  • It’s the first global conference on the sustainable blue economy.
  •  It was convened by Kenya and co-hosted Canada and Japan.