

Overview
Global warming is the long-term rise in the average temperature of the Earth's surface and lower atmosphere, driven mainly by human activities that add greenhouse gases such as carbon dioxide and methane to the air. These gases trap more of the heat that the Earth radiates, so the planet warms and its climate shifts. The latest assessment of the Intergovernmental Panel on Climate Change (IPCC) puts the average global surface temperature of 2011 to 2020 at 1.09 °C above the 1850 to 1900 level, and the World Meteorological Organization (WMO) reports that the eleven years from 2015 to 2025 were the eleven warmest on record.
Defining Global Warming: Weather, Climate and Natural Variability
Global Warming Versus Climate Change
Global warming sits at the meeting point of physical geography (heat balance and atmosphere), environment (pollution, biodiversity and sinks), international relations (treaties and negotiations) and economy (energy and development). A full answer therefore has four parts, namely the science of the greenhouse effect, the causes and effects, the control measures, and the international and Indian response.
Global warming and climate change are related but not identical terms. Global warming names one change, the rise in average temperature near the surface. Climate change is the wider term. It covers the temperature rise and every alteration that follows from it, including shifts in rainfall, melting ice, sea level, ocean chemistry and the frequency of extreme events. Climate change can also have natural causes, while the present global warming is overwhelmingly human-caused. The IPCC concludes that human activities, principally through greenhouse gas emissions, have unequivocally caused global warming.
Natural Climate Variability and Why It Does Not Explain Today's Warming
Climate has always changed. Geological records show glacial and inter-glacial periods, and Europe passed through a Little Ice Age from 1550 to about 1850. The causes of such natural change fall into two groups, astronomical and terrestrial.
- Sunspot activity: Sunspots are dark, cooler patches on the Sun that rise and fall in number in a cycle, and changes in solar output linked to them were once proposed as a cause of climatic swings.
- Milankovitch oscillations: Cyclical variations in the shape of the Earth's orbit, the wobble of its axis and the tilt of that axis alter the insolation received from the Sun over long periods.
- Volcanism: An eruption throws aerosols into the atmosphere, and these reduce the radiation reaching the surface, so the average temperature falls for some years after a large eruption.
The human cause is different in kind. The most important human effect on climate is the rising concentration of greenhouse gases. The IPCC attributes a best-estimate warming of 1.07 °C between 1850 to 1900 and 2010 to 2019 to human causes, against a contribution of only minus 0.1 °C to plus 0.1 °C from natural drivers. That is why the rise since the Industrial Revolution is treated as a separate phenomenon from natural variability.
Greenhouse Effect and Enhanced Greenhouse Effect
Natural Greenhouse Effect: Short-Wave Radiation In, Long-Wave Radiation Trapped
The atmosphere is largely transparent to the incoming short-wave radiation of the Sun, so sunlight reaches and heats the Earth's surface. The warm surface then radiates energy upward as long-wave (terrestrial) radiation. The atmosphere absorbs the vast majority of this long-wave radiation, and the gases that absorb it are called greenhouse gases. This means the atmosphere is heated mainly from below, by the Earth's own radiation, rather than directly by the Sun. The set of processes that warm the atmosphere in this way is the greenhouse effect.
The name comes from the glass greenhouse used in cold regions to keep plants warm. Glass is transparent to short-wave sunlight but opaque to outgoing long-wave radiation, so the heat stays inside. A car with its windows shut in summer shows the same effect.
The natural greenhouse effect is essential to life. Without it the average surface temperature would be about minus 18 °C, whereas the actual average is about 15 °C, a difference of 33 °C. The problem begins when human activity strengthens the effect.
Enhanced Greenhouse Effect, Radiative Forcing and Earth's Energy Imbalance
The enhanced greenhouse effect is the extra warming produced by the additional greenhouse gases that humans have added since about 1750. The scientific measure of the push is radiative forcing, the change in the net downward minus upward radiation flux, expressed in watts per square metre (W per square metre), caused by a change in an external driver of climate such as a greenhouse gas. The IPCC assesses human-caused radiative forcing at 2.72 W per square metre in 2019 relative to 1750, with a likely range of 1.96 to 3.48. This forcing is mainly due to increased greenhouse gas concentrations, partly reduced by the cooling effect of aerosols.
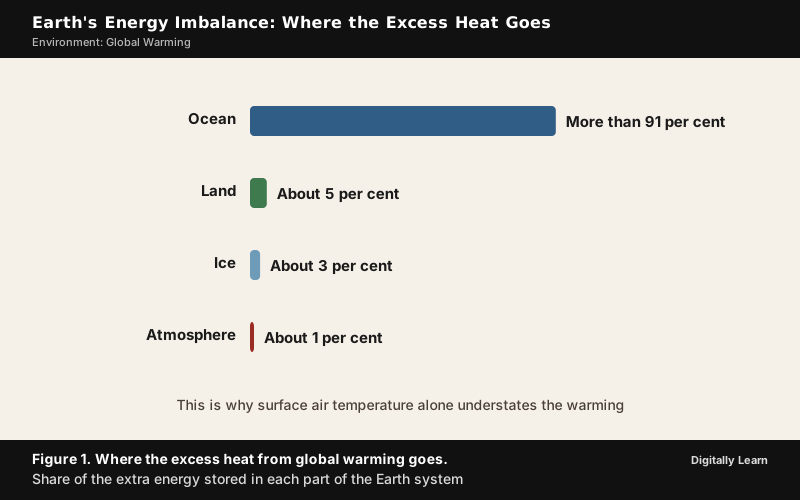
A forcing leaves the Earth with an energy imbalance, more energy arriving than leaving. The WMO's State of the Global Climate report for 2025 includes the Earth's energy imbalance as a key indicator for the first time, and reports that it reached a new high in 2025. More than 91 per cent of the excess heat is stored in the ocean, about 5 per cent warms the land, about 3 per cent melts ice and only about 1 per cent warms the atmosphere. This is why surface air temperature alone understates what is happening to the planet.
Greenhouse Gases, Sources and Global Warming Potential
Main Greenhouse Gases and Their Sources
The primary greenhouse gases of concern are carbon dioxide (CO2), methane (CH4), nitrous oxide (N2O), the chlorofluorocarbons (CFCs) and ozone (O3), together with the hydrofluorocarbons (HFCs), perfluorocarbons (PFCs) and other fluorinated gases. How much a molecule of a gas matters depends on three things, the size of the rise in its concentration, its lifetime in the atmosphere, and the wavelengths of radiation it absorbs.
Concentrations in 2019 were higher than at any time in at least 2 million years for CO2, and higher than at any time in at least 800,000 years for CH4 and N2O. Since 1750, CO2 has risen by 47 per cent, CH4 by 156 per cent and N2O by 23 per cent. Total net human-caused greenhouse gas emissions were estimated at 59 gigatonnes of carbon dioxide equivalent in 2019, about 12 per cent higher than in 2010 and 54 per cent higher than in 1990. The monthly average concentration of CO2 measured at Mauna Loa was 426.07 ppm in September 2026.
| Gas | Main human sources | Atmospheric lifetime | GWP over 100 years (IPCC AR6) |
|---|---|---|---|
| Carbon dioxide (CO2) | Burning coal, oil and gas; deforestation; cement and steel making | Persists for centuries (reference gas) | 1 |
| Methane (CH4) | Rice fields, livestock and manure, wetlands, landfills, coal mining, oil and gas leaks | 11.8 years | 29.8 for fossil methane; 27.0 for non-fossil methane |
| Nitrous oxide (N2O) | Fertilizer production and use, burning of fossil fuels and vegetation | 109 years | 273 |
| HFC-134a (a refrigerant) | Air conditioning and refrigeration | 14.0 years | 1,526 |
| CFC‑11 | Old refrigerants and aerosol propellants | 52.0 years | 6,226 |
| PFC‑14 (an industrial gas) | Industrial processes | 50,000 years | 7,380 |
Two more gases complete the picture. Water vapour is the most abundant greenhouse gas, but it acts as a feedback and not as an independent cause, because a warmer ocean puts more of it into the air, which warms the planet further. Ozone shields life from ultraviolet radiation in the stratosphere, but in the lower troposphere it absorbs terrestrial radiation very effectively and acts as a greenhouse gas. CFCs are entirely of industrial origin; they are strong greenhouse gases and also destroy stratospheric ozone.
Global Warming Potential: Time Horizon and Limits
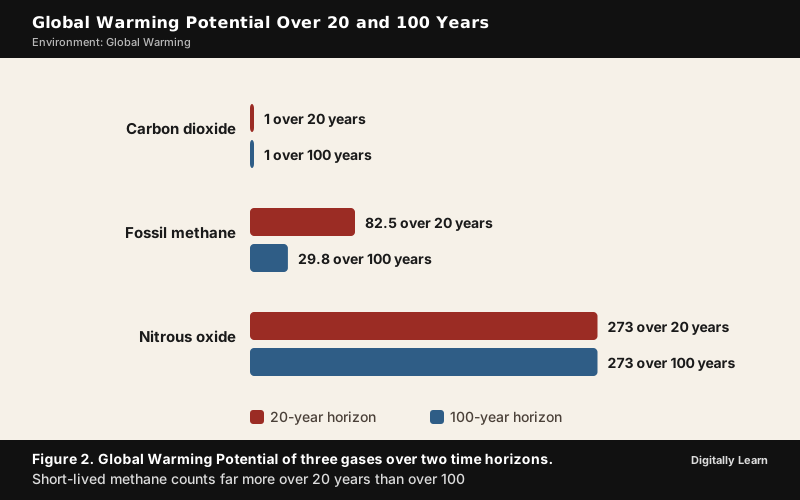
The Global Warming Potential (GWP) compares gases by the warming a unit mass produces over a chosen time horizon relative to the same mass of carbon dioxide. A GWP always needs a stated horizon, because a gas that disappears quickly counts for more over a short horizon than over a long one. Methane shows this clearly. Its lifetime is only 11.8 years, so over 20 years fossil methane has a GWP of 82.5, but over 100 years the figure falls to 29.8. Nitrous oxide, which lasts 109 years, has a GWP of 273 over 100 years. The 100-year GWP is the standard used to convert emissions into "carbon dioxide equivalent".
Methane is therefore far more potent than carbon dioxide molecule for molecule, yet it is not the larger problem in tonnage because it leaves the air in about a decade. Carbon dioxide is the opposite. A single tonne of it does little by comparison, but it persists for centuries and its total quantity is far larger, which is why net warming ends only when carbon dioxide emissions fall to net zero.
Causes of Global Warming
Causes of Global Warming: Fossil Fuels, Industry and Land Use
Burning fossil fuels is the largest cause. Coal, oil and gas burned for electricity, heat, transport and industry release carbon dioxide, and this is why CO2 from fossil fuels and industry grew most in absolute terms by 2019. Several sectors stand out.
- Electricity and heat: Power stations burning coal, oil and gas produce the biggest single share of carbon dioxide.
- Transport: Petrol and diesel vehicles, shipping and aviation burn liquid fuels.
- Industrial processes: Energy use plus process emissions, since the chemistry of making cement, steel and fertilizer releases carbon dioxide directly.
- Fossil fuel extraction: Coal mining and oil and gas operations leak methane.
- Deforestation and land-use change: Forests use carbon dioxide in their growth, so when they are cleared the stored carbon is released and the sink that would have absorbed more is lost.
Forests and oceans are the main sinks of carbon dioxide. The land and ocean sinks together have taken up a near-constant share, about 56 per cent a year, of human CO2 emissions, and the ocean alone absorbed around 29 per cent of the CO2 released by human activity between 2015 and 2024.
Agriculture, Waste and Fluorinated Gases
Not all warming gases come from fuel. Methane and nitrous oxide are mainly farm and waste gases.
- Rice paddies: Flooded fields starve the soil of oxygen, and microbes called methanogens that work without oxygen produce methane.
- Livestock: Cattle and other ruminants release methane in digestion, and manure adds more.
- Wetlands: Wetlands are the largest natural source of methane, producing it when plant matter breaks down; the world's wetlands supply about three-quarters of the enduring natural sources.
- Landfills and wastewater: Decaying organic waste releases methane.
- Fertilizers: Nitrous oxide is released during the production and use of commercial and organic fertilizer, and from burning vegetation.
- Refrigerants and industrial gases: CFCs, HFCs, PFCs and sulphur hexafluoride are made only by industry and have very high GWPs.
Human Versus Natural Causes: What the Attribution Shows
Attribution is done by adding up each driver. The IPCC finds that well-mixed greenhouse gases contributed a warming of 1.0 °C to 2.0 °C between 1850 to 1900 and 2010 to 2019, other human drivers, principally aerosols, a cooling of 0.0 °C to 0.8 °C, natural drivers a change of minus 0.1 °C to plus 0.1 °C, and internal variability a change of minus 0.2 °C to plus 0.2 °C. Greenhouse gases are therefore the dominant driver, and aerosol pollution has been masking part of the warming. The same pollutants that cause smog are partly cooling the planet, so cleaning the air without cutting greenhouse gases would reveal more warming.
Observed Warming, Feedbacks and Tipping Points
How Much the Earth Has Warmed
The IPCC finds that global surface temperature was 1.09 °C higher in 2011 to 2020 than in 1850 to 1900, with larger increases over land (1.59 °C) than over the ocean (0.88 °C). Each of the last four decades was warmer than any decade before it since 1850, and temperature has risen faster since 1970 than in any other 50-year period in at least 2,000 years.
The WMO's State of the Global Climate report 2025, released on 23 March 2026, gives the latest single-year picture. The year 2025 was the second or third warmest on record at about 1.43 °C above the 1850 to 1900 average, and 2024, which began with a strong El Niño, remains the warmest at about 1.55 °C. The past eleven years, 2015 to 2025, were the eleven warmest. A single year above 1.5 °C does not mean the Paris goal is broken, since the goal is defined over a twenty-year average. The IPCC finds that, across the modelled pathways it assesses, the median five-year interval in which warming reaches 1.5 °C is 2030 to 2035.
Feedbacks: Water Vapour, Ice-Albedo and Permafrost
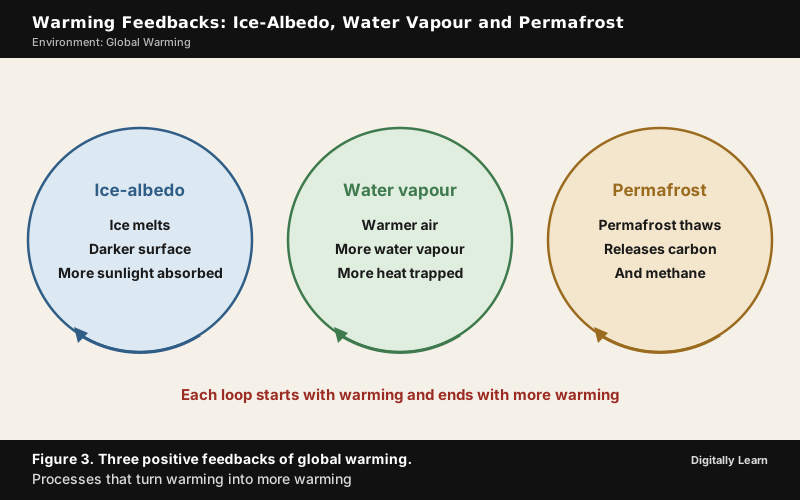
A feedback is a process that amplifies or reduces an initial change. Three positive feedbacks make warming self-reinforcing.
- Water vapour feedback: Warmer air and ocean hold more water vapour, itself a greenhouse gas, which adds to the warming.
- Ice-albedo feedback: Ice is highly reflective, so when ice caps, glaciers and sea ice shrink, more sunlight is absorbed by darker land or open water, which warms the surface further and melts more ice. Albedo is the reflectivity of a surface.
- Permafrost feedback: Thawing permafrost releases stored carbon and methane. The loss of permafrost carbon after thaw is irreversible on timescales of centuries. Methane held in ice-like hydrate deposits under the ocean floor and in cold Arctic regions is another store that warming could release.
Sinks may also weaken. In scenarios with rising CO2 emissions, the land and ocean carbon sinks are projected to become less effective at slowing the build-up of CO2 in the air. The increase in CO2 in 2024 was the largest annual rise since modern measurements began in 1957, driven by continued fossil emissions and the reduced effectiveness of the land and ocean sinks.
Tipping Points and Committed Change
A tipping point is a threshold beyond which part of the climate system changes abruptly or irreversibly. The IPCC states that the likelihood of abrupt and irreversible change rises with the warming level. At sustained warming of 2 °C to 3 °C the Greenland and West Antarctic ice sheets would be lost almost completely and irreversibly over multiple millennia, and mountain and polar glaciers are committed to melt for decades or centuries. Warm-water coral reefs, some coastal wetlands, some rainforests and some polar and mountain ecosystems are already reaching the limits of adaptation. The ocean has also been committed to future warming by past emissions, so ocean warming and sea level rise will continue for centuries even if emissions stop.
Effects of Global Warming
Temperature Extremes, Heatwaves and Rainfall
It is virtually certain that hot extremes, including heatwaves, have become more frequent and more intense across most land regions since the 1950s, while cold extremes have become less frequent and less severe. Marine heatwaves have roughly doubled in frequency since the 1980s, and in 2025, even with La Niña conditions, around 90 per cent of the ocean surface area experienced at least one marine heatwave. Heavy rainfall events have become more frequent and intense over most land areas with enough data, and human-induced climate change has contributed to agricultural and ecological droughts in some regions. Warming therefore intensifies both ends of the water cycle, floods and droughts.
For the end of the century, the IPCC finds that global surface temperature in 2081 to 2100 is very likely to be 1.0 °C to 1.8 °C higher than 1850 to 1900 under the very low emissions scenario (SSP1-1.9), 2.1 °C to 3.5 °C under the intermediate scenario (SSP2-4.5) and 3.3 °C to 5.7 °C under the very high scenario (SSP5-8.5). The gap between these paths is decided by the emission choices of the coming years.
Melting Ice, Glaciers and Sea Level Rise
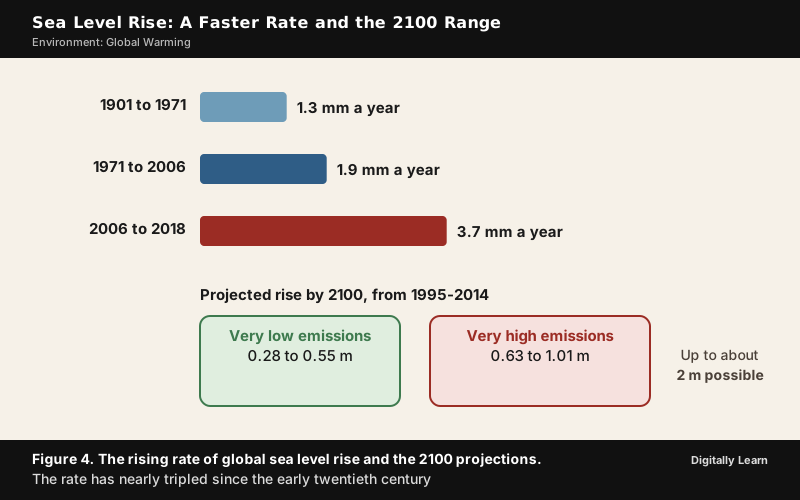
Arctic sea ice area in 2011 to 2020 was at its lowest level since at least 1850, and almost all of the world's glaciers have been retreating since the 1950s. Global mean sea level rose by 0.20 m between 1901 and 2018. The rate of rise has itself increased, from 1.3 mm a year between 1901 and 1971 to 1.9 mm a year between 1971 and 2006 and 3.7 mm a year between 2006 and 2018. In 2025 global mean sea level was around 11 cm higher than at the start of the satellite record in 1993.
Sea level rises for two reasons. Melting glaciers and ice sheets add water to the ocean, and warming water expands, which is called thermal expansion. Because the ocean holds more than 91 per cent of the excess heat, expansion will continue for centuries.
| Scenario | Likely rise by 2100 | Note |
|---|---|---|
| Very low emissions (SSP1-1.9) | 0.28 to 0.55 m | Strong mitigation |
| Very high emissions (SSP5-8.5) | 0.63 to 1.01 m | About one metre sits at the top of this range |
| Very high emissions, low-likelihood ice-sheet outcomes | Approaching 2 m | Cannot be ruled out because ice-sheet processes are deeply uncertain |
Some effects of sea level rise reach well beyond the coast. Extreme sea level events that occurred once a century in the recent past are projected to happen at least annually at more than half of all tide-gauge locations by 2100. Low-lying coasts and small island states face flooding, erosion, loss of land and salinisation of groundwater. Coastal communities may be displaced, which turns the problem into one of migration and security as well as environment. Small island states are among the most exposed, because their land and their freshwater lie close to the sea.
Warming Oceans, Acidification and Coral Bleaching
The ocean absorbs most of the excess heat. In 2025 ocean heat content to a depth of 2,000 metres reached the highest level since records began in 1960, and the rate of ocean warming over 2005 to 2025 is more than twice that of 1960 to 2005. The ocean also absorbs CO2, which makes surface water more acidic. It is virtually certain that human-caused CO2 emissions are the main driver of present-day acidification of the surface open ocean, and the largest regional pH declines are in the Indian Ocean, the Southern Ocean and parts of the Pacific. Oxygen levels have also dropped in many upper ocean regions since the mid-20th century.
Reef-building corals depend on a partnership with zooxanthellae, algae-like single-celled organisms that live in their tissues, give the coral its colour and supply it with nutrients through photosynthesis.
When the water becomes too warm, the coral expels the zooxanthellae and turns white, an event called coral bleaching. A coral can survive a short bleaching, but prolonged bleaching kills it. Between 2014 and 2016 global bleaching events killed coral on an unprecedented scale, and in 2016 bleaching killed 29 to 50 per cent of the coral on the Great Barrier Reef. Acidification adds a second stress, since it harms corals and other shell-forming life, and warm-water coral reefs are among the ecosystems that are already reaching hard adaptation limits. The loss of reefs endangers fisheries, tourism and protection against storm surges for coastal communities.
Agriculture, Food Security and Health
Warming reaches people through food, water and health. Climate change has slowed the growth in agricultural productivity over the past 50 years globally, and warming, extremes of heat, drought and flood hit crop yields, livestock, fisheries and the incomes of farmers. Tropical countries, where large areas depend on rainfed farming, feel the effects first. The four pillars of food security show where the damage falls.
- Availability: Lower yields, shifting crop zones, reduced livestock productivity and damaged fisheries cut the supply of food.
- Access: Floods and droughts disrupt supply chains and the incomes of farmers, and food prices become more volatile.
- Utilisation and nutrition: Heat stress, spread of diseases and unsafe water reduce the body's ability to use the food it gets.
- Stability: Repeated shocks of heat, flood and drought make supply and incomes unstable from year to year.
Climate-driven food insecurity now cascades into social stability, migration and the spread of plant pests and animal diseases. For health, rising temperatures, changing rainfall and extremes alter where and when disease risks appear, with dengue and heat stress as leading examples.
Effects of Global Warming on India
The Ministry of Earth Sciences (MoES) published an assessment of climate change over the Indian region in 2020, prepared by the Centre for Climate Change Research at the Indian Institute of Tropical Meteorology, Pune. Its findings give the national picture.
- Temperature: India's average surface air temperature rose by about 0.7 °C during 1901 to 2018, with an increase in atmospheric moisture.
- Rainfall extremes: The frequency of daily rainfall extremes (above 150 mm a day) rose by about 75 per cent during 1950 to 2015, and the frequency and spatial extent of droughts increased significantly during 1951 to 2015.
- Ocean and cyclones: Sea surface temperatures in the tropical Indian Ocean rose by about 1 °C during 1951 to 2015, and severe cyclonic storms over the Arabian Sea increased in the post-monsoon seasons of 1998 to 2018.
- Sea level: The sea level in the Indian Ocean rose at about 1.7 mm a year in the last century, and faster in the north Indian Ocean at about 3.3 mm a year over 1993 to 2017.
- Himalayas: The Himalayan region has shown elevation-dependent warming, changes in western disturbances and snowfall, and retreating glaciers.
The Himalayan glaciers feed the Ganga, Brahmaputra and Yamuna, so their retreat threatens river flow.
The relationship between shrinking glaciers and the symptoms of climate change is therefore a causal chain. Rising temperature on the Tibetan Plateau and the Himalaya melts snow and ice, changes western disturbances and the snowfall pattern, raises the risk of landslides, floods and glacial lake outburst floods, and over the long run threatens the flow of the rivers. Himalayan states face glacier retreat, landslides and floods, while coastal states face sea level rise, coastal erosion, stronger cyclones and saltwater intrusion. Mumbai and Kolkata are assessed to face the highest flood risks, and sea level rise has submerged low-lying islands in the Sundarbans and displaced thousands of people.
Mitigation, Adaptation and Carbon Sinks
Mitigation Measures and the Carbon Budget
Mitigation cuts the emissions that cause warming or removes carbon dioxide from the air. The IPCC finds that reaching net zero anthropogenic CO2 emissions is a requirement to stabilise human-induced temperature increase at any level. Global net zero CO2 emissions are reached in the early 2050s in pathways that limit warming to 1.5 °C with no or limited overshoot, and around the early 2070s in pathways that limit warming to 2 °C. The remaining carbon budget from the beginning of 2020 is estimated at 500 gigatonnes of CO2 for a 50 per cent chance of limiting warming to 1.5 °C, and 1,150 gigatonnes for a 67 per cent chance of 2 °C.
The main tools are these.
- Clean energy: Replace coal, oil and gas with solar, wind, hydro and nuclear power in electricity and, through electrification and green hydrogen, in transport and industry.
- Energy efficiency: Use less energy for the same output in buildings, appliances and factories.
- Carbon pricing and markets: Put a price on emissions through taxes, emissions trading or credits.
- Forests and land: Reduce deforestation, plant trees and restore ecosystems to strengthen sinks.
- Methane and F‑gas control: Cut methane from agriculture, waste and fossil fuel extraction, and phase down hydrofluorocarbons, which give quick gains because methane lives only about a decade.
- Lifestyle and demand: Reduce wasteful consumption, as the Indian LiFE campaign advocates.
Carbon Sinks, Carbon Capture and Carbon Dioxide Removal
A carbon sink is a natural or artificial process that removes a greenhouse gas from the atmosphere. Forests, soils and the ocean are the natural sinks. Blue carbon is the carbon captured and stored by the oceans and coastal ecosystems, especially seagrass meadows, tidal marshes and mangrove forests; when these ecosystems are degraded they release the carbon back.
Carbon capture, utilisation and storage (CCUS) captures carbon dioxide from large point sources such as power plants and cement works, uses it or stores it underground. Storage options include deep saline aquifers, depleted oil and gas reservoirs, and coal beds, and a part of the captured gas is used in enhanced oil recovery. Its potential role is to cut emissions from sectors that are hard to decarbonise and to deliver the carbon dioxide removal that net zero pathways need, but it is energy-intensive and costly, and it must not become an excuse to delay cutting emissions.
Adaptation, Resilience and Geoengineering Proposals
Adaptation is adjustment to actual or expected climate and its effects. Without mitigation, adaptation cannot avert severe, widespread and irreversible impacts, so the two are complements. Examples include protecting coastlines through mangrove restoration and climate-resilient infrastructure, early warning systems for cyclones and storm surges, Heat Action Plans in the States, glacier monitoring and sustainable livelihoods in Himalayan states, and climate-resilient agriculture.
Geoengineering means deliberate large-scale intervention in the climate system. Solar radiation modification (SRM) aims to reflect more sunlight. The best-researched form is stratospheric aerosol injection, in which reflective particles such as sulphate aerosols are placed in the upper atmosphere. Marine cloud brightening makes marine clouds more reflective, and cirrus cloud thinning seeds cirrus clouds so that more outgoing long-wave radiation escapes to space. These methods would not remove carbon dioxide or stop ocean acidification, are untested at scale, and raise governance questions, so they are discussed as supplements to, not substitutes for, mitigation.
International Climate Framework
UNFCCC, 1992 and the IPCC
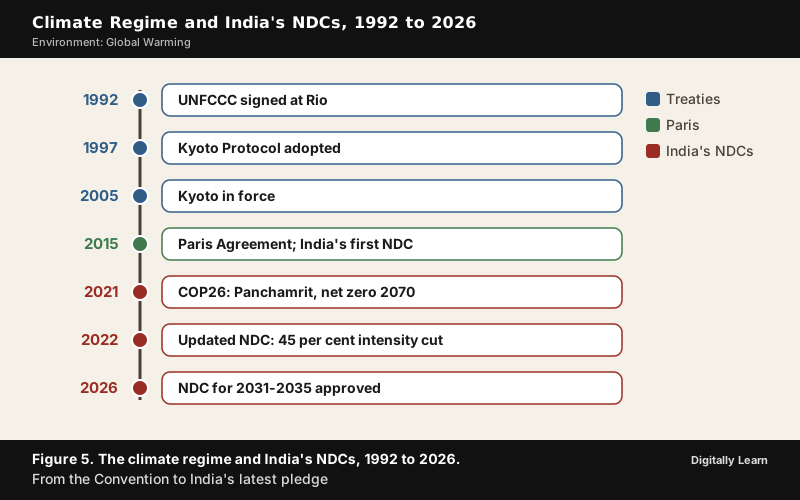
The IPCC assessment reports supply the scientific base for the climate regime. The United Nations Framework Convention on Climate Change (UNFCCC) was signed in 1992 by 154 states at the Earth Summit in Rio de Janeiro and entered into force in 1994. Its principle is common but differentiated responsibilities and respective capabilities (CBDR‑RC). Every country shares responsibility, but developed countries, called Annex I countries, take the lead because of their greater historical emissions and are expected to report on steps to return to 1990 emission levels. The Conference of the Parties (COP) is its supreme decision-making body and meets every year, and by 2022 the Convention had 198 parties.
Kyoto Protocol, 1997 and Its Commitment Periods
The Kyoto Protocol was adopted in Kyoto, Japan, on 11 December 1997 and entered into force on 16 February 2005. It was based on common but differentiated responsibilities and put the obligation to cut emissions on developed countries, which are historically responsible. It bound 35 industrialised countries to reduce their emissions by 2012 to 5 per cent less than 1990 levels, and developing countries, including India and China, had no binding targets.
- First commitment period: 2008 to 2012, with targets listed in Annex B of the Protocol.
- Second commitment period: The Doha Amendment, agreed in 2012, extended the Protocol to 2020; it entered into force on 31 December 2020. Canada withdrew from the Protocol in 2012 and the United States never ratified it.
- Gases covered: Carbon dioxide, methane, nitrous oxide, HFCs, PFCs, sulphur hexafluoride and, from the second period, nitrogen trifluoride.
Kyoto gave countries three flexibility mechanisms to meet targets at lower cost.
- International Emissions Trading: Annex I Parties can trade emission allowances, called Assigned Amount Units.
- Clean Development Mechanism (CDM): An Annex I country invests in an emission-reducing project in a non-Annex I (developing) country and receives Certified Emission Reductions, which count towards its target. The CDM is designed to encourage emission reductions in non-Annex I Parties, so its projects are located in developing countries such as India and China, not only in Annex I countries.
- Joint Implementation: Annex I countries earn emission reduction units from projects in other Annex I countries.
The carbon credit system arose from these mechanisms. For India, the CDM brought investment in renewable energy, energy efficiency and fuel switching, and India was expected to account for about 16 per cent of the potential Certified Emission Reductions by 2012.
A credit is valuable only while a binding cap makes it scarce; low prices of credits, for example of Assigned Amount Units, show how fragile the market is when targets are weak. Whether India should continue to pursue carbon credits and the CDM when credit prices have slumped therefore depends on a balance. They still bring foreign investment and technology into clean energy, but the revenue is unreliable, and India's need for cheap energy to grow means that credits can supplement, not replace, domestic policy.
Paris Agreement, 2015 and Nationally Determined Contributions
The Paris Agreement was adopted at COP21 on 12 December 2015 by consensus and entered into force on 4 November 2016, after it had been opened for signature on 22 April 2016. Its central goal is to hold the increase in global average temperature to well below 2 °C above pre-industrial levels and to pursue efforts to limit it to 1.5 °C. Unlike Kyoto, which gave binding targets only to developed countries, every country sets its own Nationally Determined Contribution (NDC), communicates a new one every five years, and each is meant to be a progression over the previous one.
- Global stocktake: The Agreement provides for a periodic review of collective progress, with the first stocktake concluded in 2023.
- Finance: Developed countries reaffirmed their commitment to mobilise $100 billion a year by 2020 for mitigation and adaptation in developing countries, and to continue at this level until 2025.
- Article 6: It sets out cooperative approaches for countries to meet their NDCs, including carbon markets, and it also recognises non-market approaches, which promote mitigation, adaptation, finance, technology transfer and capacity-building.
- Article 8: It recognises the importance of averting, minimising and addressing loss and damage associated with climate impacts.
- Transparency and review: Each Party communicates its NDC informed by the outcomes of the global stocktake.
| Feature | Kyoto Protocol (1997) | Paris Agreement (2015) |
|---|---|---|
| Who must cut | Developed (Annex I) countries only, with binding targets | Every country, through its own NDC |
| Target | 5 per cent below 1990 levels by 2012 for industrialised countries | Well below 2 °C, pursuing 1.5 °C |
| Approach | Targets negotiated from the top | Pledges set by each country and raised every five years |
| In force | 16 February 2005 | 4 November 2016 |
| Market tools | CDM, Joint Implementation, International Emissions Trading | Article 6 cooperative approaches and a mechanism for sustainable development |
From Glasgow to Belém: COP26 to COP30
- COP26, Glasgow (31 October to 13 November 2021): The Glasgow Climate Pact reaffirmed the 1.5 °C goal and was the first climate decision to call explicitly for reducing unabated coal power; after last-minute interventions by India and China the wording was changed to "phase down" from "phase out", and it called for phasing out inefficient fossil fuel subsidies.
- COP27, Sharm El-Sheikh (2022): Nations agreed to establish a loss and damage fund for vulnerable countries.
- COP28, Dubai (2023): The loss and damage fund was agreed on the first day, and the first global stocktake concluded, with a call to shift away from fossil fuels in the UAE Consensus.
- COP29, Baku (2024): A new climate finance goal of $300 billion a year by 2035 was set for developed countries, which developing countries criticised as too low.
- COP30, Belém (2025): The text called for tripling adaptation finance by 2035, set up a Just Transition Mechanism and adopted 59 global adaptation indicators, though the fossil fuel roadmap stayed outside the formal decision.
India and Global Warming
India's Position and the National Action Plan on Climate Change
India's greenhouse gas emissions are the third largest in the world, about 6.6 per cent of the global total in 2019, and the main source is coal. Its per capita emissions are low, at 1.85 tonnes a year. India holds to the principle of common but differentiated responsibilities and respective capabilities, argues that developed countries must lead and must provide climate finance, and at COP26 asked developed countries to provide climate finance of 1 trillion dollars at the earliest.
India launched its National Action Plan on Climate Change (NAPCC) in 2008 as an umbrella framework with eight national missions.
- National Solar Mission
- National Mission for Enhanced Energy Efficiency
- National Mission on Sustainable Habitat
- National Water Mission
- National Mission for Sustaining the Himalayan Eco-system
- National Mission for a Green India
- National Mission on Sustainable Agriculture
- National Mission on Strategic Knowledge for Climate Change
The NAPCC is now described as comprising nine national missions, and it operationalises India's NDC together with the State Action Plans on Climate Change (SAPCC); thirty-three States and Union Territories had prepared their SAPCC in line with the NAPCC by 2021. In 2021 the Executive Committee on Climate Change mandated the Apex Committee for Implementation of the Paris Agreement to review progress of the missions.
India's NDCs, Panchamrit, Net Zero 2070, LiFE and Green Credit
India submitted its first (intended) NDC to the UNFCCC on 2 October 2015, with three quantitative targets for 2030. At COP26 in Glasgow on 1 November 2021 the Prime Minister presented five commitments called Panchamrit.
- Non-fossil capacity: 500 GW of non-fossil energy capacity by 2030.
- Renewable share: 50 per cent of India's energy requirements from renewable energy by 2030.
- Emissions: A reduction of one billion tonnes in total projected carbon emissions from then until 2030.
- Carbon intensity: A reduction in the carbon intensity of the economy by 2030, put in the speech as "less than 45 percent" and recorded in the updated NDC as a 45 per cent cut in emissions intensity of GDP from the 2005 level.
- Net zero: Net zero emissions by 2070.
The updated NDC, approved by the Cabinet in August 2022, translated the Panchamrit into enhanced targets, and India's Lifestyle for Environment (LiFE) idea, a mass movement for sustainable living, was proposed at COP26. In March 2026 the Cabinet approved India's NDC for 2031 to 2035, which raises the targets further.
| Target | First NDC (2015, for 2030) | Updated NDC (2022, for 2030) | NDC for 2031‑2035 |
|---|---|---|---|
| Emissions intensity of GDP, from 2005 level | 33 to 35 per cent cut | 45 per cent cut | 47 per cent cut by 2035 |
| Non-fossil share of installed electric power capacity | About 40 per cent | About 50 per cent | 60 per cent by 2035 |
| Additional carbon sink through forest and tree cover | 2.5 to 3 billion tonnes of CO2 equivalent | No new figure announced | 3.5 to 4.0 billion tonnes of CO2 equivalent by 2035 |
| Long-term goal | Not stated | Net zero by 2070 | Net zero by 2070 |
India met its first-NDC targets on emissions intensity and non-fossil capacity well ahead of 2030. The share of non-fossil sources in installed electric power capacity was 52.57 per cent in February 2026, and emissions intensity had fallen by 36 per cent between 2005 and 2020.
The Green Credit Programme, notified in October 2023 under the LiFE initiative, rewards voluntary environmental actions such as water conservation and afforestation with tradable credits; the Indian Council of Forestry Research and Education is its Administrator. Alongside these, India has promoted the International Solar Alliance, the Green Hydrogen Mission, rooftop solar and carbon capture, and has submitted its Long-Term Low Emission Development Strategy to the UNFCCC.
Previous Year UPSC‑CSE Questions
Each question comes with an explanation of how to approach it.
- UPSC Prelims 2005Consider the following statements :
- Kyoto Protocol came into force in the year 2005
- Kyoto Protocol deals primarily with the depletion of the Ozone layer.
- Methane as a greenhouse gas is more harmful than carbon dioxide
Which of the statements given above is/are correct?
How to approach this Prelims question
Approach: Take each statement against the Kyoto and GWP sections.
Trap to watch: Kyoto and ozone are often linked in memory; the ozone treaty is Montreal.
Why each option is right or wrong:
- (a) 1 and 2: Wrong. Statement 1 is right, but statement 2 is wrong because Kyoto deals with greenhouse gases and ozone depletion is dealt with by the Montreal Protocol.
- (b) 1 and 3: Correct. Kyoto entered into force on 16 February 2005, and methane's GWP over 100 years (29.8 for fossil methane) is far above carbon dioxide's 1.
- (c) 1 only: Wrong. It leaves out statement 3, which is correct.
- (d) 3 only: Wrong. It leaves out statement 1, which is correct.
Answer: Option (b) 1 and 3: Kyoto came into force on 16 February 2005, and methane is more potent than carbon dioxide per unit.
- UPSC Prelims 2008Consider the following:
- Rice fields
- Coal mining
- Domestic animals
- Wetlands
Which of the above are sources of methane, a major greenhouse gas?
How to approach this Prelims question
Approach: Check each item against the methane sources listed in the agriculture and waste section.
Trap to watch: Wetlands are natural, not man-made, but they are still a methane source.
Why each option is right or wrong:
- (a) 1 and 4 only: Wrong. Rice fields and wetlands are sources, but it omits coal mining and domestic animals, which also emit methane.
- (b) 2 and 3 only: Wrong. Coal mining and livestock are sources, but it omits rice fields and wetlands.
- (c) 1, 2 and 3 only: Wrong. It omits wetlands, the largest natural source.
- (d) 1, 2, 3 and 4: Correct. Rice paddies, coal mining, livestock digestion and manure, and wetlands all emit methane.
Answer: (d) 1, 2, 3 and 4. Each item is a methane source.
- UPSC Prelims 2008Consider the following statements:
- Clean Development Mechanism (CDM) in respect of carbon credits is one of the Kyoto Protocol Mechanisms.
- Under the CDM, the projects handled pertain only to the Annex-I countries.
Which of the statements given above is/are correct?
How to approach this Prelims question
Approach: Recall the three Kyoto mechanisms and the location of CDM projects.
Trap to watch: Annex I countries pay for CDM projects, but the projects lie in developing countries.
Why each option is right or wrong:
- (a) 1 only: Correct. The CDM is a Kyoto mechanism; statement 2 is wrong because CDM projects are in non-Annex I (developing) countries.
- (b) 2 only: Wrong. Statement 2 is false and statement 1 is true.
- (c) Both 1 and 2: Wrong. Statement 2 is false, since the CDM encourages emission reductions in non-Annex I countries.
- (d) Neither 1 nor 2: Wrong. Statement 1 is true.
Answer: Option (a) 1 only: CDM is a Kyoto mechanism, with projects in developing countries.
- UPSC Prelims 2016With reference to the Agreement at the UNFCCC Meeting in Paris in 2015, which of the following statements is/are correct? 1. The Agreement was signed by all the member countries of the UN and it will go into effect in 2017. 2. The Agreement aims to limit the greenhouse gas emissions so that the rise in average global temperature by the end of this century does not exceed 2 °C or even 1·5 °C above pre-industrial levels. 3. Developed countries acknowledged their historical responsibility in global warming and committed to donate $1000 billion a year from 2020 to help developing countries to cope with climate change. Select the correct answer using the code given below.
How to approach this Prelims question
Approach: Test each statement's date and number against the Paris section.
Trap to watch: The finance pledge is 100 billion dollars a year, not 1,000 billion.
Why each option is right or wrong:
- (a) 1 and 3 only: Wrong. Statement 1 is wrong because the Agreement was adopted by the Parties to the UNFCCC, opened for signature on 22 April 2016 and entered into force on 4 November 2016, not 2017; statement 3 is wrong because the figure is $100 billion a year, not $1000 billion.
- (b) 2 only: Correct. The temperature goal of well below 2 °C and efforts towards 1.5 °C is the Agreement's central aim.
- (c) 2 and 3 only: Wrong. Statement 3 states $1000 billion; the commitment is $100 billion a year by 2020.
- (d) 1, 2 and 3: Wrong. Statements 1 and 3 are both incorrect.
Answer: Option (b) 2 only: Entry into force 4 November 2016 and $100 billion a year.
- UPSC Prelims 2016Consider the following pairs:Terms sometimes seen in the news - Their origin
- Annex-I Countries : Cartagena Protocol
- Certified Emissions Reductions : Nagoya Protocol
- Clean Development Mechanism : Kyoto Protocol
Which of the pairs given above is/are correctly matched?
How to approach this Prelims question
Approach: Place each term in the treaty it belongs to.
Trap to watch: Cartagena and Nagoya are biodiversity protocols, not climate ones.
Why each option is right or wrong:
- (a) 1 and 2 only: Wrong. Annex I belongs to the UNFCCC and Kyoto regime, and the Cartagena Protocol is a biosafety agreement under the Convention on Biological Diversity; Certified Emission Reductions come from the Kyoto CDM, while the Nagoya Protocol concerns access to genetic resources and benefit sharing.
- (b) 2 and 3 only: Wrong. Pair 2 is mismatched.
- (c) 3 only: Correct. The Clean Development Mechanism is a Kyoto Protocol mechanism.
- (d) 1, 2 and 3: Wrong. Pairs 1 and 2 are mismatched.
Answer: Option (c) 3 only: CDM belongs to Kyoto, Annex I to the Convention and Kyoto, CERs to the CDM.
- UPSC Prelims 2024Consider the following statements:
- Statement‑I: The atmosphere is heated more by incoming solar radiation than by terrestrial radiation.
- Statement‑II: Carbon dioxide and other greenhouse gases in the atmosphere are good absorbers of long wave radiation.
Which one of the following is correct in respect of the above statements?
How to approach this Prelims question
Approach: Decide which radiation heats the atmosphere, then check the role of greenhouse gases.
Trap to watch: Sunlight warms the surface, not the air directly.
Why each option is right or wrong:
- (a) Both Statement‑I and Statement‑II are correct and Statement‑II explains Statement‑I: Wrong. Statement I is incorrect because the atmosphere is transparent to short-wave solar radiation and is heated mainly by terrestrial long-wave radiation.
- (b) Both Statement‑I and Statement‑II are correct, but Statement‑II does not explain Statement‑I: Wrong. Statement I is incorrect.
- (c) Statement‑I is correct, but Statement‑II is incorrect: Wrong. It reverses the truth: I is incorrect and II is correct.
- (d) Statement‑I is incorrect, but Statement‑II is correct: Correct. The atmosphere is heated more by terrestrial radiation, and greenhouse gases absorb long-wave radiation.
Answer: (d) Statement‑I is incorrect, but Statement‑II is correct. Statement‑II correct.
- UPSC Prelims 2022Among the following crops, which one is the most important anthropogenic source of both methane and nitrous oxide?
How to approach this Prelims question
Approach: Match the crop with both gases.
Trap to watch: Sugarcane and cotton use fertilizer too, but only rice grows in standing water.
Why each option is right or wrong:
- (a) Cotton: Wrong. Cotton is not a flooded crop and is not the main source of methane.
- (b) Rice: Correct. Flooded paddies produce methane under oxygen-free conditions, and fertilizer use on the crop releases nitrous oxide.
- (c) Sugarcane: Wrong. It is not grown in standing water.
- (d) Wheat: Wrong. It is an upland crop with no flooded methane source.
Answer: Option (b) Rice: Anaerobic paddies give methane and fertilizer gives nitrous oxide.
- UPSC Prelims 2019Which of the following statements are correct about the deposits of 'methane hydrate'?
- Global warming might trigger the release of methane gas from these deposits.
- Large deposits of 'methane hydrate' are found in Arctic Tundra and under the seafloor.
- Methane in atmosphere oxidizes to carbon dioxide after a decade or two.
How to approach this Prelims question
Approach: Check each statement against the feedbacks and methane lifetime.
Trap to watch: Methane is short-lived; that is statement 3, and it is true.
Why each option is right or wrong:
- (a) 1 and 2 only: Wrong. It omits statement 3; methane has a lifetime of 11.8 years and oxidises to carbon dioxide.
- (b) 2 and 3 only: Wrong. It omits statement 1; warming can destabilise hydrates.
- (c) 1 and 3 only: Wrong. It omits statement 2; hydrates are found under the ocean floor and in cold Arctic regions.
- (d) 1, 2 and 3: Correct. All three are correct.
Answer: Option (d) 1, 2 and 3: Hydrates lie under the seafloor and in the Arctic, warming can release them, and methane oxidises within about a decade.
- UPSC Prelims 2019In the context of which of the following do some scientists suggest the use of cirrus cloud thinning technique and the injection of sulphate aerosol into stratosphere?
How to approach this Prelims question
Approach: Identify the aim of the two techniques.
Trap to watch: Cirrus thinning sounds like weather control, but its aim is to let heat escape.
Why each option is right or wrong:
- (a) Creating the artificial rains in some regions: Wrong. These are not cloud-seeding for rain.
- (b) Reducing the frequency and intensity of tropical cyclones: Wrong. They are not cyclone-control methods.
- (c) Reducing the adverse effects of solar wind on the Earth: Wrong. They do not address solar wind.
- (d) Reducing the global warming: Correct. Both are solar radiation modification proposals that aim to lower global temperature.
Answer: (d) Reducing the global warming.
- UPSC Prelims 2017In the context of mitigating the impending global warming due to anthropogenic emissions of carbon dioxide, which of the following can be the potential sites for carbon sequestration?
- Abandoned and uneconomic coal seams
- Depleted oil and gas reservoirs
- Subterranean deep saline formations
How to approach this Prelims question
Approach: Check each site against the storage options.
Trap to watch: Coal seams look unlikely, but coal beds are a recognised storage option.
Why each option is right or wrong:
- (a) 1 and 2 only: Wrong. It omits deep saline formations, the most plentiful storage option.
- (b) 3 only: Wrong. It omits coal beds and depleted reservoirs.
- (c) 1 and 3 only: Wrong. It omits depleted oil and gas reservoirs.
- (d) 1, 2 and 3: Correct. Deep saline aquifers, depleted oil and gas fields and coal beds are all potential geological storage sites.
Answer: Option (d) 1, 2 and 3: Coal beds, depleted oil and gas reservoirs and deep saline formations are all storage options.
- UPSC Prelims 2021What is blue carbon?
How to approach this Prelims question
Approach: Recall the definition from the carbon sinks section.
Trap to watch: Forest and soil carbon is sometimes called green, not blue.
Why each option is right or wrong:
- (a) Carbon captured by oceans and coastal ecosystems: Correct. Blue carbon is stored by seagrass, tidal marshes and mangroves.
- (b) Carbon sequestered in forest biomass and agricultural soils: Wrong. That is terrestrial or green carbon.
- (c) Carbon contained in petroleum and natural gas: Wrong. That is fossil carbon.
- (d) Carbon present in atmosphere: Wrong. That is atmospheric CO2.
Answer: Option (a) Carbon captured by oceans and coastal ecosystems.
- UPSC Prelims 2025Consider the following statements:
- Article 6 of the Paris Agreement on climate change is frequently discussed in global discussions on sustainable development and climate change.
- Article 6 of the Paris Agreement on climate change sets out the principles of carbon markets.
- Article 6 of the Paris Agreement on climate change intends to promote inter-country non-market strategies to reach their climate targets.
Which one of the following is correct in respect of the above statements?
How to approach this Prelims question
Approach: Check what Article 6 contains.
Trap to watch: Carbon markets are the best-known part, but non-market approaches are in Article 6 too.
Why each option is right or wrong:
- (a) Both Statement II and Statement III are correct and both of them explain Statement I: Correct. Article 6 sets out cooperative approaches that form the basis of carbon markets, and it also recognises non-market approaches; together they explain why it is much discussed.
- (b) Both Statement II and Statement III are correct but only one of them explains Statement I: Wrong. Both explain the prominence of Article 6.
- (c) Only one of the Statements II and III is correct and that explains Statement I: Wrong. Both statements are correct.
- (d) Neither Statement II nor Statement III is correct: Wrong. Both statements are correct.
Answer: (a) Both Statement II and Statement III are correct and both of them explain Statement I. Article 6 covers carbon markets and non-market approaches, and both explain why it is discussed so widely.
- UPSC Mains 2022 GS‑IIIDiscuss global warming and mention its effects on the global climate. Explain the control measures to bring down the level of greenhouse gases which cause global warming, in the light of the Kyoto Protocol, 1997.
Answer outline
The outline sets out what the question asks, the main arguments, relevant examples and the direction of the conclusion; it is not a full model answer.
Introduction: Global warming is the human-driven rise in the Earth's average temperature, caused by the enhanced greenhouse effect.
Body (sub-themes to develop):
- Effects: Hotter extremes, heavier rain and droughts, melting ice, sea level rise, ocean heat and acidification.
- Control at home: Clean energy, efficiency, carbon pricing, forests and sinks, methane and F‑gas cuts, lifestyle change.
- Kyoto Protocol, 1997: Binding cuts for 35 industrialised countries to 5 per cent below 1990, in force 2005.
- Kyoto's mechanisms: Emissions trading, the Clean Development Mechanism and Joint Implementation.
- Beyond Kyoto: The Paris Agreement extends action to every country through NDCs.
Conclusion: Kyoto began binding cuts on the countries most responsible; Paris and equity in finance carry the work forward.
- UPSC Mains 2019 GS‑IAssess the impact of global warming on the coral life system with examples.
Answer outline
Introduction: Reef-building corals live in partnership with zooxanthellae, which give them colour and food.
Body (sub-themes to develop):
- Bleaching: Warm water makes corals expel the zooxanthellae; prolonged bleaching kills them.
- Examples: The global bleaching of 2014 to 2016 and the 2016 loss of 29 to 50 per cent of coral on the Great Barrier Reef.
- Acidification: Carbon dioxide absorbed by the ocean harms corals and shell-forming life.
- Cost: Loss of fisheries, tourism and protection against storm surges.
Conclusion: Warm-water reefs are already reaching hard limits of adaptation, so only deep emission cuts can protect them.
- UPSC Mains 2023 GS‑IIIThe Intergovernmental Panel on Climate Change (IPCC) has predicted a global sea level rise of about one metre by AD 2100. What would be its impact in India and the other countries in the Indian Ocean region?
Answer outline
Introduction: Sea level rises as ice melts and warming water expands; the very high emissions range by 2100 is 0.63 to 1.01 m.
Body (sub-themes to develop):
- India's coast: Flooding of Mumbai and Kolkata, erosion and cyclone surges.
- Sundarbans: Low-lying islands already submerged and people displaced.
- Groundwater: Salinisation of coastal aquifers and farmland.
- Island and low-lying neighbours: Loss of land and freshwater, and migration.
- Response: Mangrove restoration, early warning and climate-resilient infrastructure.
Conclusion: A one-metre rise would turn coastal risk into a question of migration and security, so adaptation must start now.
- UPSC Mains 2025 GS‑IIIWrite a review on India's climate commitments under the Paris Agreement (2015) and mention how these have been further strengthened in COP26 (2021). In this direction, how has the first Nationally Determined Contribution intended by India been updated in 2022?
Answer outline
Introduction: India's first NDC of 2015 set three quantitative targets for 2030.
Body (sub-themes to develop):
- First NDC: A 33 to 35 per cent cut in emissions intensity, about 40 per cent non-fossil capacity, a 2.5 to 3 billion tonne sink.
- COP26, 2021: The Panchamrit, from 500 GW of non-fossil capacity to net zero by 2070.
- Updated NDC, 2022: A 45 per cent intensity cut and about 50 per cent non-fossil capacity by 2030.
- Delivery: Non-fossil capacity reached 52.57 per cent in February 2026, ahead of the target.
- Since then: The NDC for 2031 to 2035 raises the intensity cut to 47 per cent.
Conclusion: India has raised its ambition at each stage while holding to equity and the call for climate finance.
- UPSC Mains 2021 GS‑IIIDescribe the major outcomes of the 26th session of the Conference of the Parties (COP) to the United Nations Framework Convention on Climate Change (UNFCCC). What are the commitments made by India in this conference?
Answer outline
Introduction: COP26 met at Glasgow from 31 October to 13 November 2021.
Body (sub-themes to develop):
- Glasgow Climate Pact: The 1.5 °C goal reaffirmed.
- Coal: The first call to reduce unabated coal power, worded as phase down after interventions by India and China.
- Subsidies: A call to phase out inefficient fossil fuel subsidies.
- India's Panchamrit: 500 GW non-fossil capacity, 50 per cent renewable energy, one billion tonnes less carbon, a lower intensity, net zero by 2070.
- India's other asks: LiFE and climate finance of 1 trillion dollars from developed countries.
Conclusion: COP26 kept 1.5 °C alive, and India paired a net zero date with a demand for finance.
- UPSC Mains 2023 GS‑IDiscuss the consequences of climate change on the food security in tropical countries.
Answer outline
Introduction: Tropical countries depend heavily on rainfed farming, so warming hits their food first.
Body (sub-themes to develop):
- Availability: Lower yields, shifting crop zones, poorer livestock and fisheries.
- Access: Floods and droughts break supply chains and farm incomes; prices swing.
- Utilisation: Heat stress, disease and unsafe water reduce nutrition.
- Stability: Repeated shocks make supply and income unstable.
- Wider effects: Migration, pests and animal diseases.
Conclusion: Climate-resilient crops, water management and insurance must go alongside cuts in emissions.
- UPSC Mains 2017 GS‑III'Climate change' is a global problem. How India will be affected by climate change? How Himalayan and coastal states of India will be affected by climate change?
Answer outline
Introduction: India's average surface air temperature rose by about 0.7 °C during 1901 to 2018.
Body (sub-themes to develop):
- India: More rainfall extremes and droughts, a warmer Indian Ocean and rising seas.
- Himalayan states: Glacier retreat, landslides, floods and glacial lake outbursts.
- Coastal states: Sea level rise, erosion, stronger cyclones and saltwater intrusion.
- Response: The NAPCC and its missions, State Action Plans and adaptation.
Conclusion: A global problem reaches India region by region, so the answer must be both national and local.
- UPSC Mains 2014 GS‑IBring out the relationship between the shrinking Himalayan glaciers and the symptoms of climate change in the Indian sub-continent.
Answer outline
Introduction: The Himalayan region shows elevation-dependent warming, and its glaciers are retreating.
Body (sub-themes to develop):
- Rivers: The glaciers feed the Ganga, Brahmaputra and Yamuna, so their retreat threatens river flow.
- Snow and rain: Western disturbances and snowfall patterns change.
- Hazards: Landslides, floods and glacial lake outburst floods become more likely.
- Water and farming: Long-run risk to irrigation and drinking water downstream.
Conclusion: Shrinking glaciers are both a symptom of warming and a cause of further stress on the subcontinent.
- UPSC Mains 2025 GS‑IHow are climate change and the sea level rise affecting the very existence of many island nations? Discuss with examples.
Answer outline
Introduction: Sea level rose by 0.20 m between 1901 and 2018, and the rate of rise has increased.
Body (sub-themes to develop):
- Extreme sea levels: Once-a-century events become yearly at many places by 2100.
- Land and water: Flooding, erosion and salinisation of groundwater.
- Reefs: Coral bleaching removes the natural barrier against storm surges.
- People: Displacement and migration.
- Finance: The loss and damage fund agreed at COP27 and COP28.
Conclusion: For low-lying island states, climate change is a question of survival, not only of environment.
- UPSC Mains 2025 GS‑IIIWhat is Carbon Capture, Utilization and Storage (CCUS)? What is the potential role of CCUS in tackling climate change?
Answer outline
Introduction: Carbon capture, utilisation and storage captures carbon dioxide from large point sources.
Body (sub-themes to develop):
- Steps: Capture at power plants and cement works, use, or storage underground.
- Sites: Deep saline aquifers, depleted oil and gas reservoirs and coal beds.
- Role: Cutting emissions in hard-to-decarbonise sectors and delivering carbon removal.
- Limits: High energy use and cost, and the risk of delaying real emission cuts.
Conclusion: CCUS can support net zero but cannot replace cutting emissions at source.
- UPSC Mains 2014 GS‑IIIShould the pursuit of carbon credits and clean development mechanisms set up under UNFCCC be maintained even though there has been a massive slide in the value of a carbon credit? Discuss with respect to India's energy needs for economic growth.
Answer outline
Introduction: Carbon credits arose from the Kyoto mechanisms, chiefly the Clean Development Mechanism.
Body (sub-themes to develop):
- Benefits: Investment in renewables, efficiency and fuel switching; India was expected to hold about 16 per cent of CERs.
- Weakness: A credit is valuable only under a binding cap, so prices fall when targets are weak.
- India's needs: Cheap energy for growth means credits cannot carry the transition alone.
Conclusion: Credits are worth keeping as a supplement to domestic policy, not as its foundation.
Sources
- IPCC: Sixth Assessment Report, Working Group I, Summary for Policymakers
- IPCC: Sixth Assessment Report, Synthesis Report
- IPCC: Sixth Assessment Report, Working Group I, Chapter 7
- World Meteorological Organization: State of the Global Climate 2025
- NOAA Global Monitoring Laboratory: Trends in atmospheric carbon dioxide
- NASA: Causes of climate change
- NCERT: Fundamentals of Physical Geography (Class XI), World Climate and Climate Change
- United Nations Treaty Collection: Paris Agreement
- Press Information Bureau: Release 1847813
- Press Information Bureau: Release 128404
- Press Information Bureau: Release 2245209
- Press Information Bureau: Release 1768712
- Press Information Bureau: Release 1967476
- Press Information Bureau: Release 1845820
- Press Information Bureau: Release 2085950
- Press Information Bureau: Release 1706938
- Press Information Bureau: Release 1945036
- Press Information Bureau: Release 2242357
- Wikipedia: Greenhouse effect
- Wikipedia: Radiative forcing
- Wikipedia: Methane emissions
- Wikipedia: Ice–albedo feedback
- Wikipedia: Methane clathrate
- Wikipedia: Coral bleaching
- Wikipedia: Blue carbon
- Wikipedia: Carbon sink
- Wikipedia: Carbon capture and storage
- Wikipedia: Solar radiation modification
- Wikipedia: United Nations Framework Convention on Climate Change
- Wikipedia: Kyoto Protocol
- Wikipedia: Paris Agreement
- Wikipedia: 2021 United Nations Climate Change Conference
- Wikipedia: Loss and damage
- Wikipedia: 2023 United Nations Climate Change Conference
- Wikipedia: 2024 United Nations Climate Change Conference
- Wikipedia: 2025 United Nations Climate Change Conference
- Wikipedia: Montreal Protocol
- Wikipedia: Cartagena Protocol on Biosafety
- Wikipedia: Nagoya Protocol
- Wikipedia: Climate change in India
- UPSC: Civil Services Examination question papers
Editorial Disclaimer
This article uses the IPCC Sixth Assessment Report, the latest World Meteorological Organization report and the other sources listed in the Sources section. Climate figures are revised as new reports appear.


