Causes of Eutrophication and Algal bloom | UPSC – IAS

Causes of Eutrophication and Algal bloom | UPSC - IAS

Causes of Eutrophication and Algal bloom | UPSC - IAS

Causes of Eutrophication and Algal bloom | UPSC – IAS

Eutrophication derives from the Greek word eutrophos, meaning nourished or enriched. Eutrophication is the natural aging of a lake by biological enrichment of its water. In a young lake the water is cold and clear, supporting little life. With time, streams draining into the lake introduce nutrients such as nitrogen and phosphorus, which encourage the growth of aquatic organisms. In other words, the Eutrophication refers to the addition of artificial or non-artificial substances, such as nitrates and phosphates, through fertilizers or sewage, to a fresh water system. It can be anthropogenic or natural.

  • Eutrophication leads to increase in the primary productivity of the water body or “bloom” of phytoplankton. The overgrowth causes the loss of oxygen in the water leading to severe reductions in fish and other animal populations.
  • What is the cause of eutrophication ? – Domestic sewage, the most common source of pollution of water bodies, reduces dissolved oxygen but increases biochemical oxygen demand of receiving water. Domestic sewage is rich in nutrients, especially, nitrogen and phosphorus, which cause eutrophication and nuisance algal blooms.

Types of Eutrophication | UPSC – IAS

Eutrophication is mainly divided into natural and cultural Eutrophication.

Natural Eutrophication

  • In natural Eutrophication, a lake is characterized by nutrient enrichment. During this process an oligotrophic lake is converted into an eutrophic lake. It permits the production of phytoplankton, algal blooms and aquatic vegetation that in turn provide ample food for herbivorous zooplankton and fish.
  • While Cultural Eutrophication is caused by human activities. Which in turn are responsible for addition of 80% nitrogen and 75% phosphorus to lake and streams.

Accelerated or Cultural Eutrophication

  • Over the centuries, as silt and organic debris pile up, the lake grows shallower and warmer, with warm-water organisms supplanting those that thrive in a cold environment. Marsh plants take root in the shallows and begin to fill in the original lake basin. Eventually, the lake gives way to large masses of floating plants (bog), finally converting into land.
  • Depending on climate, size of the lake and other factors, the natural aging of a lake may span thousands of years. However, pollutants from human activities like effluents from the industries and homes can radically accelerate the aging process. This phenomenon has been called Cultural or Accelerated Eutrophication.
  • In other words when the process of Eutrophication is increased by the human activities, it is called cultural or accelerated Eutrophication. This is because the human activities (mainly development in nature) increase the surface runoff and the nutrients such as Phosphates, Nitrates are supplied to the Ocean water. They may be supplied by Constriction works, treatment plants, golf courses, fertilizers, and farms.

Features and sources of Eutrophication | UPSC - IAS

Features of Eutrophication | UPSC – IAS

  • Eutrophication escalates rapidly when high nutrients from fertilizers, domestic and industrial wastes, urban drainage, detergents and animal, sediments enter water streams.
  • Eutrophication causes several physical, chemical and biological changes, which considerably deteriorate the water quality.
  • It creates algal bloom, releases toxic chemicals that kill fish, birds and other aquatic animals.
  • Decomposition of algal bloom leads to the depletion of oxygen in water. Thus with a high CO2 level and poor oxygen through reduction of nitrates.
  • On complete exhaustion of nitrate, oxygen may as last resort be obtained by reduction of sulphate yielding hydrogen sulphide causing foul smell and putrefied taste of water. Many pathogenic microbes, viruses, protozoa and bacteria and grow on sewage products under anaerobic conditions. It results into the spread of fatal water-borne disease such as polio, dysentery, diarrhoea, typhoid and viral hepatitis.

Ways to control Eutrophication | UPSC – IAS

  • Several prevention and technical devices have been used to control Eutrophication. The wastewater must be treated before its discharge into water streams.
  • Recycling of nutrients can be checked through harvest. Removing nitrogen and phosphorous at the source, division of nutrient-rich waters from the receiving bodies and dilution of these elements can minimize Eutrophication.
  • Algal blood should be removed upon their death and decomposition. Limiting the dissolve nutrients can control algal growth. The most suitable, feasible and effective method involves the use of chemicals to precipitate additional phosphorus.
  • Precipitants like alum, lime, iron and sodium aluminate may be used. Physicochemical methods can be adopted to remove nutrients. for example phosphorus can be removed by precipitation and nitrogen by nitrification or denitrification.
  • Electrodialysis, reverse osmosis and ion exchange methods. Copper-sulphate and sodium arsenite are employed for killing algae and rooted plant respectively.

Relation between Viruses and Aquatic Ecosystem | UPSC – IAS

  • A teaspoon of seawater contains about one million of Viruses, making them the most abundant biological entity in aquatic environments. They are useful in the regulation of saltwater and freshwater ecosystems. The Bacteriophage, which is harmless to plants and animals, play the most important role here.
  • They infect and destroy the bacteria in aquatic microbial communities, comprising the most important mechanism of recycling carbon in the marine environment. However, the organic molecules released from the bacterial cells by the viruses stimulate fresh bacterial and algal growth. Viruses are useful for the rapid destruction of harmful algal blooms that arises generally from the Blue Green algae and often kills other marine life.
  • Viruses increase the amount of Photosynthesis in Oceans and are responsible for reducing the amount of carbon dioxide in the atmosphere by approximately 3 giga-tonnes of carbon per year.

Sankalp Parva by MOC | Planting of Trees | UPSC – IAS

Sankalp Parva by MOC | Planting of Trees | UPSC - IAS

Sankalp Parva by MOC | Planting of Trees | UPSC - IAS

Sankalp Parva – To ensure Healthy Environment

Trees contribute to their environment by providing oxygen, improving air quality, climate amelioration, conserving water, preserving soil, and supporting wildlife.

As the  monsoon season has started, which is right time for plantation. We have seen the importance of clean and healthy environment during this Pandemic and we are proud of our Herbal Wealth which has enough strength to enable us to sail through safely in the period of Pandemic.

MOC urge everybody to participate in this Sankalp Parv and plant and take care of at least one plant, so we can create healthy environment and a flourishing “Bharat

  • Objective of the  Sankalp Parva To ensure clean and healthy environment of the country. 
  • Culture Ministry to celebrate “Sankalp Parva” to plant trees from 28th June to 12 July 2020

MOC Recommends Five Types of Trees | UPSC – IAS

Ministry of Culture recommends to plants five trees which have been identified by our Prime Minister and which represent the herbal heritage of our country.

These trees are as follows:-

  • Bargad
  • Awla
  • Pepal
  • Ashok
  • Bel

The Ministry has asked for the participation of all and that the organizations must ensure that each employee should plant at least one tree of his/her choice and over and above these five trees which should be planted as per the call of the Prime Minister.The Institutions must also ensure that the employee takes care of plant planted by them during the year so that it survives and flourishes .

Biorock technology | Coral Restoration | UPSC – IAS

Biorock technology Coral Restoration electric reef UPSC - IAS

Biorock technology Coral Restoration electric reef UPSC - IAS

Biorock technology | Coral Restoration | UPSC – IAS

Coral reefs are one of the most biologically diverse marine ecosystems on the Earth. Ecologically, coral reefs are important because they are the counterpart to the tropical rain forest in terms of species diversity and biological productivity in the Ocean. Coral reef enables the formation of associated eco-systems which allow the formation of essential habitats, fisheries and livelihoods.

    • Coral reefs are the backbone of life in the oceans.
    • They are a critical part of the web of life on our planet.
  • Biorock is the name given to the substance formed by electro accumulation of minerals dissolved in seawater on steel structures that are lowered onto the sea- bed and are connected to a power source.
  • The technology works by passing a small amount of electrical current through electrodes in the water.
  • When a positively charged anode and negatively charged cathode are placed on the seafloor, with an electric current flowing between them, calcium ions combine with carbonate ions and adhere to the structure (cathode).
  • This results in calcium carbonate formation. Coral larvae adhere to the CaCO3 and grow quickly.
  • The fragments of broken corals are tied to the biorock structure, where they are able to grow at least four to six times faster than their actual growth as they need not spend their energy in building their own calcium carbonate skeletons.
  • A biorock structure was installed one nautical mile off the Mithapur coast in the Gulf of Kachchh

Major threats for the corals | UPSC – IAS

The vast diversity of animal and plant species that contributes to its system and genetic heritage that it represents are increasingly at risk, since the last few decades.

  • Natural: Environmental-Temperature, Sediment Deposition, Salinity, pH, etc.
  • Anthropogenic: Mining, Bottom Fishing, Tourism, pollution, etc.

Coral bleaching | UPSC – IAS

  • Coral bleaching occurs when coral polyps expel algae that live inside their tissues.
  • Coral species live within a relatively narrow temperature margin hence low and high sea temperatures can induce coral bleaching.
  • When corals are exposed to high concentrations of chemical contaminants or pathogens, coral bleaching happens.

Factors responsible for Coral Bleaching | UPSC – IAS

  • Runoff from agricultural land and chemical pollution results in eutrophication and subsequent oxygen depletion.
  • Destructive fishing and boating practices lead to habitat destruction and disintegration of reef ecosystem.
  • Marine Pollution: Incidents such as increase in sea transport, oil spill etc. destroy coral reefs
  • Uncontrolled tourism activities lead to breakage of coral colonies and leads to tissue damage.
  • Coastal construction and shoreline development results in heavy sedimentation, which can lead to coral reef destruction.
  • Introduction of invasive species in ocean by humans too lead to change in the coral ecosystem.
  • Coral mining: Live coral is removed from reefs for use as bricks etc.
  • Ocean acidification- With increased pollution, Carbon Dioxide is absorbed by Ocean leading to rise in Carbonic acid in water. As Coral has Calcium carbonate as main component, it reacts with Carbonic acid and slowly dissolves down.

Consequences of Coral Bleaching | UPSC – IAS

  • It will impact marine ecosystem, as coral reefs are some of the most bio diverse and productive ecosystems.
  • Reefs act as natural barriers to shorelines, protecting them from the effects of moving water. As coral reefs die, coastlines become more susceptible to damage and flooding from storms, hurricanes, and cyclones.
  • Without coral reefs, ocean will not be able to absorb as much CO2, leaving more CO2 in atmosphere.
  • Loss of the coral reefs will have a devastating impact on tropical countries’ economies, food supplies, and safety of their coastal communities.

Measures taken in India | UPSC – IAS

  • Government of India has taken steps to protect its coral reefs under Coastal Ocean Monitoring and Prediction system (COMAPS), Land Ocean Interactions in Coastal zones (LOICZ) and Integrated Coastal and Marine Area Management (ICMAM).
  • Government of India has notified Coastal Regulation Zones (CRZ) and has setup National Coastal Zone Management Authority and State Coastal Zone Management Authority to protect coral reefs.
  • Coral Bleaching Alert System (CBAS)- a service initiated from INCOIS uses the satellite derived Sea Surface Temperature (SST) in order to assess the thermal stress accumulated in the coral environs.
  • Coral Reef Recovery Project- is a joint venture of Wildlife Trust of India and the Gujarat Forest Department, supported by Tata Chemicals Limited (TCL).

Harmful effects of single use plastic on environment | UPSC – IAS

Harmful effects of single use plastic on environment | UPSC - IAS

Harmful effects of single use plastic on environment | UPSC - IAS

Harmful effects of single use plastic on environment | UPSC – IAS

What is single use plastic refers to ?

  • It refers to disposable plastics that are commonly used for plastic packaging and include items intended to be used only once before they are thrown away or recycled.
  • There is a no fixed definition for single use plastic and it varies from country to country (India is in process of giving statutory definition to single use plastic)
  • European Union describes ‘single-use plastics’ as plastics as products made of plastic such as cotton-bud sticks, cutlery, plates, straws, sticks for balloons, cups, food, beverage containers made of polystyrene and products made of oxo-degradable plastic, etc.
  • Industry gives a different definition like plastic below 50 microns with less than 20 per cent recycled content makes for single-use plastic.
  • This single-use material makes up between 26% to 36% of the world’s plastic and problems caused by single use plastics (SUPs) were first recognised in 2007.
  • The issue of single use plastic becomes more dangerous due to the fact that it is least reused, no proper disposal process, difficult segregation, micro plastic (small size) etc.

Harmful effects of single use plastic on environment | UPSC – IAS

  • Marine life & climate change: Plastic waste is at epidemic proportions in the world’s oceans with an estimated 100 million tonnes dumped there to date.
    • Scientists have found large amounts of micro plastic in the intestines of deep-dwelling ocean mammals like whales.
    • Single-use plastics make up on average 49% of beach litter.
  • Human health: The toxins, poisons and persistent pollutants present in some of these plastic products leach and enter human bodies where they cause several diseases, including cancer and can damage nervous systems, lungs and reproductive organs.
    • Humans may be consuming anywhere from 39,000 to 52,000 microplastic particles a year through fish (contaminated with microplastics) alone.
  • Environmental pollution: A staggering total of it remains uncollected causing choking of drainage and river systems, littering of the marine ecosystem, soil and water pollution, ingestion by stray animals, and open air burning leading to adverse impact on environment.
  • Less reused: A United Nations report on environment states that only 9% of all plastic waste ever produced has been recycled. About 12% has gone through incineration, while the rest — 79% — has piled up in landfills, dumps or the natural environment, leading to slow poisoning of the earth.
  • Increasing Carbon dioxide: If the production, disposal and incineration of plastic continues on its present day growth trajectory, by 2030 these global emissions could reach 1.34 gigatonne per year — equivalent to more than 295 coal-based power plants of 500-MW capacity.
  • More impact on developing countries: The ubiquitous plastic seems to be a curse for the third world countries, because poor countries, especially in Asia, not only have their own plastic dump to deal with but also the plastic trash that lands on their shores from developed countries.
    • India has imported 99,545 MT plastic flakes and 21,801 MT plastic lumps from South America, Africa, Middle East, Europe and Asia.
    • Recently, Malaysia has decided that 450 tonne of contaminated plastic waste would be shipped back to where it came from — Australia, Bangladesh, Canada, China, Japan, Saudi Arabia and the US.
  • Disposal issue: They do not biodegrade instead they slowly break down into smaller pieces of plastic called microplastics which again causes more issues. It can take up to thousands of years for plastic bags and Styrofoam containers to decompose.

System of Air Quality and Weather Forecasting And Research (SAFAR) | UPSC – IAS

System of Air Quality and Weather Forecasting And Research (SAFAR) | UPSC - IAS

System of Air Quality and Weather Forecasting And Research (SAFAR) | UPSC - IAS

System of Air Quality and Weather Forecasting And Research (SAFAR) | UPSC – IAS

SAFAR is a national initiative introduced by the Ministry of Earth Sciences (MoES) to measure the air quality of a metropolitan city, by measuring the overall pollution level and the location-specific air quality of the city.

SAFAR envisages a research based management system where strategies of air pollution mitigation go hand in hand with nation’s economic development to target a win-win scenario.

  • It is first of its kind and most advanced system in India. Such advanced are also proposed to be implemented in other three cities of India- Pune, Mumbai and Ahmedabad.
  • SAFAR was developed indigenously by Indian Institute of Tropical Meteorology (IITM), Pune and operationalized by India Meteorological Department (IMD).
  • The ultimate goal of the project is to increase awareness among the general public regarding the air quality in their city so that appropriate mitigation measures and systematic action can be taken up.
    • It organizes awareness drive by educating the public (prompting self-mitigation), and
    • It also helps the policy-makers to develop mitigation strategies keeping in mind the nation’s economic development.
  • SAFAR is an integral part of India’s first Air Quality Early Warning System operational in Delhi.
    • It monitors all weather parameters like temperature, rainfall, humidity, wind speed, and wind direction, UV radiation, and solar radiation.
    • Pollutants monitored: PM2.5, PM10, Ozone, Carbon Monoxide (CO), Nitrogen Oxides (NOx), Sulfur Dioxide (SO2), Benzene, Toluene, Xylene, and Mercury.
  • SAFAR has giant true colour LED display which gives out real-time air quality index on 24×7 basis with colour coding alongwith 72-hour advance forecast.
  • The World Meteorological Organization has recognized SAFAR as a prototype activity on the basis of the high-quality control and standards maintained in its implementation.
  • Besides health, SAFAR system will benefit cost savings to several other sectors like agriculture, aviation, infrastructure, disaster management skill, tourism and many others, which directly or indirectly get affected by air quality and weather.

Stockholm Convention on Persistent Organic Pollutants | UPSC – IAS

Stockholm Convention on Persistent Organic Pollutants UPSC - IAS

Stockholm Convention on Persistent Organic Pollutants UPSC - IAS

Stockholm Convention on Persistent Organic Pollutants | UPSC – IAS

Stockholm Convention on Persistent Organic Pollutants is an international environmental treaty, signed in 2001 and effective from May 2004, that aims to eliminate or restrict the production and use of persistent organic pollutants.

  • Dicofol is used as a miticide on a variety of field crops, fruits, vegetables, ornamentals and tea and coffee and is known to cause skin irritation and hyperstimulation of nerve transmissions in humans as well as being highly toxic to fish, aquatic invertebrates, algae and birds.
  • PFOA is a widely-used industrial chemical used in the production of non-stick cookware and food processing equipment, as well as a surfactant in textiles, carpets, paper, paints and fire-fighting foams. As a substance of very high concern, it is known to be linked to major health problems including kidney cancer, testicular cancer, thyroid disease and hypertension in pregnancy.

Under Stockholm Convention: Listing for elimination of dicofol and perfluorooctanoic acid (PFOA), its salts, and PFOA-related compounds under Annex A of the Convention, which obliges Parties to eliminate these chemicals from use. Key provisions include:-

    • Elimination (Persistent organic pollutants (POPs)  in annex A);
    • Restriction Persistent organic pollutants (POPs)  in annex B) &
    • Reduction or elimination (unintentionally produced POPs in annex C)

More About Stockholm Convention 

  • It’s a global treaty to protect human health and the environment from chemicals that remain intact in the environment for long periods (POP), become widely distributed geographically, accumulate in the fatty tissue of humans and wildlife, and have harmful impacts on human health or on the environment.
  • It calls for international action on three categories of POPs:
    • Pesticides,
    • Industrial chemicals, and
    • Unintentionally produced POPs.
  • It requires parties to prevent the development of new POPs and promote best available techniques (BAT) and best environmental practices (BEP) for replacing existing POPs.
  • In 2001, it originally covered the 12 POPs of greatest concern, called the “dirty dozen:”aldrin, chlordane, DDT, dieldrin, dioxins, endrin, furans, heptachlor, hexachlorobenzene, mirex, PCBs, and toxaphene. Another 16 additional chemicals were added to the treaty in 2017.

Where are Persistent Organic Pollutants found? | UPSC – IAS

POPs are found everywhere in the world in measurable amounts.

  • Food – fish, shellfish, or wild foods in which POPs have bio-accumulated
  • Air – indoors and outdoors, cigarette and secondhand smoke, and vehicle exhaust
  • Consumer products – pesticides, insecticides, cigarettes, and some paints

Global Action Plan of the Decade of Family Farming | UPSC – IAS

Global Action Plan of the Decade of Family Farming UPSC - IAS

Global Action Plan of the Decade of Family Farming  UPSC - IAS

Global Action Plan of the Decade of Family Farming | UPSC – IAS

United Nations Decade of Family Farming (2019-2028), was launched by the Food and Agriculture Organization (FAO) and the International Fund for Agricultural Development (IFAD). The UN Decade of Family Farming aims to shed new light on what it means to be a family farmer in a rapidly changing world, the important role they play in eradicating hunger and shaping our future of food. Family farming offers a unique opportunity to ensure (particularly in rural areas) :-

  • Food security,
  • Improve livelihoods,
  • Better manage natural resources,
  • Protect the environment and
  • Achieve sustainable development, 

The Decade of Family Farming provides an extraordinary opportunity for the United Nations to achieve its Sustainable Development Goals (SDGs) in an inclusive, collaborative and coherent way.

  • A Global Action Plan was also laid out to boost support for family farmers, which provides detailed guidance for the international community on collective and coherent actions that can be taken during 2019-2028.
    Family Farming: Concept and Significance
  • As per the FAO, “Family farming is a means of organizing agricultural, forestry, fisheries, pastoral and aquaculture production which is managed and operated by a family and predominantly reliant on family labour.”
  • Provide healthy, diversified and culturally appropriate foods. They represent over 90 per cent of all farms globally, and produce 80 percent of the world’s food in value terms.
  • Generate on and off-farm employment opportunities as they spend their incomes mostly within local and regional markets thus helping rural economies grow along with wider women’s participation.
  • Ensure the succession of knowledge and tradition from generation to generation, and promote social equity and community well-being.

Some Key Facts on family farming | UPSC – IAS

  • More than 80 percent of all farms globally are below two hectares.
  • Family farms occupy around 70-80 percent of farmland and produce more than 80 percent of the world’s food in value terms.
  • Women perform nearly 50 percent of farm labor but hold only 15 percent of farmland.
  • 90 percent of fishers are small-scale operators, which account for half of the capture fisheries production in developing countries.
  • Up to 500 million pastoralists rely on livestock rearing to make a living.
  • Mountain farming is largely family farming.
  • Family farmers include forest communities. Around 40 percent of the extreme rural poor live in forest and savannah areas.
  • Traditional indigenous territories encompass up to 22 percent of the world’s land surface and coincide with areas that hold 80 percent of the planet’s biodiversity.

Challenges to Family Farming in the developing countries | UPSC – IAS

  • Socio-economic challenges: Although family farmers produce most of food, they, paradoxically face poverty in developing countries with women farmers facing greater constraints. Rural youth are also highly vulnerable due to a lack of incentives for on-and off-farm employment opportunities.
  • Shrinking land holding, as more than 80 percent of all farms globally are below two hectares therefore unable to reach economy of scale.
  • Lack of access to resources, credit, infrastructure and technology to support the food production and marketing.
  • Climate change as the environmental conditions on which they rely are under threat which necessitates adoption of climate resilient agricultural practices.

Actions include | UPSC – IAS

  • Developing and implementing an enabling policy environment that support family farming at local, national and international levels;
  • Supporting rural youth and women by enabling them to access productive assets, natural resources, information etc.
  • Strengthening family farmers’ organizations and their capacities to generate knowledge and link traditional knowledge with new solutions;
  • Improving family farmers’ livelihoods and enhancing their resilience to multiple hazards though access to basic social and economic services.
  • Promoting sustainability of family farming for climate-resilient food systems

Conclusion | UPSC – IAS

Family and farm represent a unity that continuously co-evolves, fulfilling economic, environmental, social and cultural functions of the wider rural economy. Hence the Decade of Family Farming aims to create a conducive environment that strengthens their position, and maximizes their contributions to global food security and nutrition, and a healthy, resilient and sustainable future.

Invasive Alien Species in India and its Causes | UPSC – IAS

Invasive Alien Species ZSI findings and its Causes UPSC - IAS

Invasive Alien Species ZSI findings and its Causes UPSC - IAS

Invasive Alien Species by Zoological Survey of India (ZSI) | UPSC – IAS

An invasive alien species is a species that is not native to a specific location (an introduced species), and that has a tendency to spread to a degree believed to cause damage to the environment, human economy or human health.

An introduced species, alien species, foreign species, exotic species, non-indigenous species, or non-native species is a species living outside its native distributional range, but which has arrived there by human activity, either deliberate or accidental.

Causes of Invasive Alien Species | UPSC – IAS

While all species compete to survive, invasive species appear to have specific traits or specific combinations of traits that allow them to outcompete native species. In some cases, the competition is about rates of growth and reproduction. In other cases, species interact with each other more directly.

Study found invasive species tended to have only a small subset of the presumed traits and that many similar traits were found in noninvasive species, requiring other explanations. Common invasive species traits include the following:

  • Fast growth
  • Rapid reproduction
  • High dispersal ability
  • Phenotype plasticity (the ability to alter growth form to suit current conditions)
  • Tolerance of a wide range of environmental conditions (Ecological competence)
  • Ability to live off of a wide range of food types
  • Association with humans
  • Prior successful invasions

Findings of Zoological Survey of India | UPSC – IAS

National Conference on the Status of Invasive Species in India was organised by Zoological Survey of India and the Botanica  Survey of India in which ZSI announced a list of alien invasive animal species. Findings of Zoological Survey of India are as follows:-

ZSI has made a list of 157 species of Invasive Alien Species (IAS) out of which 58 are found on land and freshwater habitat and 99 are found in marine ecosystem. Common Alien Animal Species found in India are –

  • African Apple Snail – found in Andaman and Nicobar Island, now spread across the whole country
  • Papaya Mealy Bug – massively affected papaya crop in Assam, West Bengal and Tamil Nadu
  • Cotton Mealy Bug – threat to cotton crops in Deccan
  • Amazon sailfin catfish – responsible for destroying fish population in wetlands
  • Orange Cup-Coral – originated in Indo- East Pacific, now also found in Andaman and Nicobar Island, Gulf of Kutch, Kerala and Lakshadweep.
  • Primrose Willow -It is an aquatic plant native to Central and South America. It flourishes in sandy and mineral rich soil of wetlands. First seen in Karbi Anglong district of Assam and is now spreading in Tamil Nadu, Kerala, the Andaman & Nicobar Islands and West Bengal.

Steps taken to control Invasive Alien Species | UPSC – IAS

Invasive alien species (IAS) are a global issue that requires international cooperation and actions. Preventing international movement of Invasive alien species (IAS) and rapid detection at borders are less costly than control and eradication. Preventing the entry of Invasive alien species (IAS) is carried out through inspections of international shipments, customs checks and proper quarantine regulations. 

  • Article 8(h) of CBD and Aichi Target 9 aim to control or eradicate alien species which threaten ecosystems, habitats and species.
  • Global Invasive Species Program is supporting to implement Article 8(h) of CBD with IUCN as partner organization and also working to address the global threat to IAS.
  • IUCN’s Invasive Species Specialist Group has also been working to promote and facilitate the exchange of IAS information and knowledge across the globe and ensure linkages between policy making and flow of knowledge.
  • IUCN has also developed a number of global databases which provide critical information on IAS such as Global Invasive Species Database and the Global Register of Introduced and Invasive Species.

Peatland its Significance and threats | UPSC- IAS

Peatland its Significance and threats UPSC- IAS

Peatland its Significance and threats UPSC- IAS

Peatland its Significance and threats | UPSC- IAS

Peat, also known as turf, is an accumulation of partially decayed vegetation or organic matter. It is unique to natural areas called peatlands, bogs, mires, moors, or muskegs. Peats are a heterogeneous mixture of plant material (vascular plants, mosses and humus) that had accumulated in a water-saturated area and are only partially decomposed due to absence of oxygen.

Some Uses of Peat are as follows:-

  • Peat is used in water filtration, such as for the treatment of septic tank effluent and for urban runoff. Also widely used in balneotherapy (the use of bathing to treat disease).
  • Peat is sometimes used in freshwater aquaria. It is seen most commonly in soft water or blackwater river systems such as those mimicking the Amazon River basin.

They are mostly found in permafrost regions towards the poles and at-

  • High altitudes,
  • In coastal areas,
  • Beneath tropical rainforest and
  • In boreal forests.

Countries with largest peatland areas are Russia, Canada, Indonesia, USA, Finland etc.

Several multilateral conventions take peatland into consideration such as:-  UNFCCC, Ramsar Convention on Wetlands, Convention on Biodiversity and United Nation Convention to Combat Desertification.

  • Brazzaville Declaration: was signed to promote better management and conservation of Cuvette Centrale Region in Congo Basin in the backdrop of the 3rd Conference of Partners of the Global Peatlands Initiative (GPI), 2018.
  • Global Peatlands Initiative: is an effort by leading experts and institutions to save peatlands as the world’s largest terrestrial organic carbon stock and to prevent it being emitted into the atmosphere. It is led by UN Environment.

Significance of Peatland | UPSC – IAS

Peatlands are highly significant to global efforts to combat climate change, as well as wider sustainable development goals. The protection and restoration of peatlands is vital in the transition towards a low-carbon and circular economy.

  • Carbon Storage: Although they cover less than 3% of the global surface, estimates suggest that peatlands contain twice as much carbon as in the world’s forest.
  • Supporting water cycle: They regulate water flow, exert a cooling effect during hot periods through evaporation and cloud formation, play an important role in retention of pollutants and nutrients and water purification, counteract eutrophication of water bodies and also prevent intrusion of saltwater.
  • Supporting unique and critically threatened biodiversity: The tropical peatlands are home to a number of endangered species, including Sumatran tigers, gorillas and orangutans.
  • Supporting livelihood: They are source of berries, mushrooms and medicinal plants in boreal and temperate regions and of non-timber forest products in tropical regions. Even the peat itself is used as fuel.
  • As a cultural landscape and archive: They hold some of the most evocative archeological discoveries of last decades such as 4th millennium BCE footpath ‘sweet tracks’. They also record environmental changes.

Threats to Peatlands | UPSC – IAS

  • Drainage for agriculture: Drained peatlands are mainly used for agriculture and forestry, and peat is extracted for horticulture and energy production. CO2 emissions from drained peatlands are estimated at 1.3 gigatonnes of CO2 annually. This is equivalent to 5.6% of global anthropogenic CO2 emissions.
  • Commercial Forestry: It is the second greatest cause of land-use changes in peatland mostly prevalent in Scandinavian countries, UK, Russia, South-East Asia etc.
  • Peat extraction and usage: Peat as a source of energy is being used on a large scale by households. It is also used as raw material for producing growing media for professional horticulture and for home gardening.
  • Infrastructure Development: Conversion of peatlands in coastal areas to meet the urban development, waste disposal needs, development of roads and other infrastructure.
  • What happens when peatlands are degraded or destroyed – Peatland destruction leads to releasing vast amounts of CO2; – Burning, draining, and degrading peat bogs emits carbon dioxide equivalent to more than one tenth of the global emissions released from burning fossil fuels.

A Way forward | UPSC – IAS

  • A landscape approach is vital and good practices in peatland management and restoration must be shared and implemented across all peatland landscapes to save these threatened ecosystems and their services to people.
    • Rewetting: It is an essential step in the restoration of Peatlands as they rely on waterlogged conditions for their survival.
    • Plaudiculture and sustainable management techniques: It is a practice of crop production on wet soils, predominantly in peatlands. Other sustainable techniques could be cultivation of fish or pursuit of ecotourism.
  • Legal and Fiscal environment and Policies: Various policies that have been put in place both at global as well domestic levels should be implemented properly.
    • Local communities should receive support to sustainably manage their peatlands by preserving traditional non-destructive uses and introducing innovative management alternatives.
  • Creating a market to finance peatland management: Using Funding mechanism such as Green Bonds, private capital (equity and debt), funding from government sources etc.
  • Institutional framework for coordinated action: Integrated global partnerships should be established.
  • Restricting new agriculture & industrial activities that threaten their long-term viability and developing long-term land use policies which favour conservation and protection of peatlands.
  • Capacity building: Focused action is required with support from developed countries for capacity building, outreach and awareness raising.
  • A comprehensive mapping of peatlands worldwide is essential to better understanding their extent and status, and to enable us to safeguard them.

Fly ash and its Advantages and Disadvantages | UPSC – IAS

Fly ash and its Advantages and Disadvantages UPSC - IAS

Fly ash and its Advantages and Disadvantages UPSC - IAS

Fly ash and its Advantages and Disadvantages | UPSC – IAS

It is a fine powder, which is the by-product of burning coal in thermal power plants. Its Composition:- Fly ash includes substantial amounts of oxides of silica, aluminum and calcium. Element like Arsenic, Boron, Chromium, lead etc. are also found in trace concentrations.

Fly ash or flue ash, also known as pulverised fuel ash in the United Kingdom, is a coal combustion product that is composed of the particulates (fine particles of burned fuel) that are driven out of coal-fired boilers together with the flue gases. Ash that falls to the bottom of the boiler is called bottom ash.

In the past, fly ash was generally released into the atmosphere, but air pollution control standards now require that it be captured prior to release by fitting pollution control equipment. In the United States, fly ash is generally stored at coal power plants or placed in landfills. About 43% is recycled, often used as a pozzolan to produce hydraulic cement or hydraulic plaster and a replacement or partial replacement for Portland cement in concrete production. Pozzolans ensure the setting of concrete and plaster and provide concrete with more protection from wet conditions and chemical attack.

Fly ash or flue ash use in India | UPSC – IAS

The Ministry of Environment and Forest of Government of India first published a gazette notification in the year 1999 specifying use of fly ash and mandating a target date for all thermal power plants to comply by ensuring 100% utilisation. Subsequent amendments to the notification in 2003 and 2009 had fixed the deadline to be 2014 which as per figures reported in was missed by almost 40%. This has resulted in the latest notification in 2015 which has set December 31st 2017 as the revised deadline to achieve 100% utilisation.

  • Out of the approximately 55.7% fly ash utilised, bulk of it (42.3%) goes into cement production whereas only about 0.74% is used as an additive in concrete
  • Researchers in India are actively addressing this challenge by working on fly ash as an admixture for concrete and activated pozzolanic cement such as geopolymer to help achieve the target of 100% utilisation. The biggest scope clearly lies in the area of increasing the quantity of fly ash being incorporated in concrete.
  • India produced 280 Million Tonnes of Cement in 2016. With housing sector consuming 67% of the cement, there is a huge scope for incorporating fly ash in both the increasing share of Portland Pozzolana Cement (PPC) and low to moderate strength concrete.
  • There is a misconception that the Indian codes IS 456:2000 for Concrete and Reinforced Concrete and IS 3812.1:2013 for Fly Ash restrict the use of Fly Ash to less than 35%.
  • Similar misconceptions exists in countries like USA but evidence to the contrary is the use of HVFA in many large projects where design mixes have been used under strict quality control.
  • It is suggested that in order to make the most of the research results presented in the paper, Ultra High Volume Fly ash Concrete (UHVFA) concrete is urgently developed for widespread use in India using local fly ash. Urgent steps are also required to promote alkali activated pozzolan or geopolymer cement based concretes.

Another government notification, released in February 2019 states that-

  • The existing red clay brick kilns located within 300 km shall be converted into fly ash-based bricks or blocks or tiles manufacturing unit within one year from the date of publication of this notification.
  • In order to encourage the conversion, Thermal Power Station (TPS)should provide fly ash at the rate of Re 1 per tonne and bear the full transportation cost up to 300 km to such units.

Advantages of Fly Ash Utilization | UPSC – IAS

  • Prevent Contamination of Water Resources- by preventing contamination of surface water through erosion, runoff, airborne particles landing on the water surface; of ground water moving into surface waters, flooding drainage, or discharge from a coal ash pond.
  • Prevents Soil Erosion- Helps restrict usage of topsoil for manufacturing of bricks.
  • Used in variety of construction works- Fly ash is a proven resource material for many applications of construction industries and currently is being utilized in manufacturing of portland cement, bricks/blocks/tiles manufacturing, road embankment construction and low-lying area development, etc. Flyash bricks have been found to show better strength.
  • Used in Agriculture- as an agent for acidic soils, as soil conditioner – improving upon some important physicochemical properties of the soil such as hydraulic conductivity, bulk density, porosity, water holding capacity, etc.
  • Using fly ash in concrete is environmentally beneficial because it reduces the Portland cement (a major contributor of CO2) required in concrete.

Disadvantages of Fly Ash | UPSC – IAS

  • Slower Strength Gain – Concrete changes from a liquid to a solid a few hours after pouring, but the curing process may take much longer. It continues to gain strength for weeks after its initial setting period. This can cause problems when slow strength gain means delays in construction.
  • Longer Setting Times – Fly ash admixtures can lengthen the time it takes for concrete to set. Sometimes this is desirable, particularly in hot weather which speeds up concrete set times, but at other times it is an inconvenience and can cause delays in construction. Other admixtures may be necessary to adjust the set time of the concrete, depending on the percent fly ash in the mixture and the outside temperature.
  • Air Content Control – Concrete is susceptible to damage from freeze/thaw cycles if it does not contain air. Fly ash reduces the amount of air entrainment, and concrete mixtures high in fly ash often require more air-entraining admixture.
  • Seasonal LimitationsThe winter season is problematic for concrete pouring, and mixtures high in fly ash are even more susceptible to low temperatures. 
  • Color Variability – The structural effects of fly ash may be more critical, but cosmetic concerns also affect its use in concrete. It is more difficult to control the color of concrete containing fly ash than mixtures with Portland cement only.

Sea Level Rise and its Causes and Effects | UPSC – IAS

Ross Ice shelf in Antarctica Melting UPSC - IAS gk today the hindu pib

Ross Ice shelf in Antarctica & Sea Level Rise | UPSC - IAS | gk today the hindu pib

Sea Level Rise and its Causes and Effects | UPSC – IAS

Coastal areas Globally tens of millions of people will be displaced in the latter decades of the century if greenhouse gases are not reduced drastically. Many coastal areas have large population growth, which results in more people at risk from sea level rise.

Main cause of sea level rise are as follows:-

  • Melting of Ice Sheets and Glaciers,
  • Thermal expansion,
  • A slowing Gulf Stream, and
  • Sinking land all contribute to Sea level rise.

Effects of Sea level Rise | UPSC – IAS

Current and future sea level rise is set to have a number of impacts, particularly on coastal systems. Such impacts include:-

  • Increased coastal erosion,
  • Higher storm-surge flooding,
  • Inhibition of primary production processes,
  • More extensive coastal inundation,
  • Changes in surface water quality and groundwater characteristics,
  • Increased loss of property and coastal habitats,
  • Increased flood risk and potential loss of life,
  • Loss of non-monetary cultural resources and values,
  • Impacts on agriculture and aquaculture through decline in soil and water quality,
  • And loss of tourism, recreation, and transportation functions.

Many of these impacts are detrimental. Owing to the great diversity of coastal environments; regional and local differences in projected relative sea level and climate changes; and differences in the resilience and adaptive capacity of ecosystems, sectors, and countries, the impacts will be highly variable in time and space. River deltas in Africa and Asia and small island states are particularly vulnerable to sea-level rise.

  • The rising seas pose both a direct risk: unprotected homes can be flooded, and indirect threats of higher storm surges, tsunamis and king tides. Asia has the largest population at risk from sea level with countries such as Bangladesh, China, India, Indonesia, and Vietnam having very densely populated coastal areas.
  • The effects of displacement are very dependent on how successful governments will be in implementing defenses against the rising sea, with concerns for the poorest countries such as sub-Saharan countries and island nations.
  • Sea levels are rising at the fastest rate in 3,000 years. From 2018 to 2019, the global sea level rose to 6.1 millimeters.

About Ross ice shelf | UPSC – IAS

The Ross Ice Shelf is the largest ice shelf of Antarctica (as of 2013 an area of roughly 500,809 square kilometres (193,363 sq mi) and about 800 kilometres (500 mi) across). It is several hundred metres thick. The nearly vertical ice front to the open sea is more than 600 kilometres (370 mi) long, and between 15 and 50 metres (50 and 160 ft) high above the water surface. Ninety percent of the floating ice, however, is below the water surface.

Ross Ice shelf in Antarctica Map and Diagram | UPSC - IAS

  • Antarctica’s Ross Ice Shelf is the world’s largest ice shelf roughly the size of France, is melting rapidly.
  • Recently it is found that the ice cap is melting rapidly leading to global sea-level rise of around 13.8 millimetres over the last 40 years.
  • The ice shelf is melting 10 times faster than the overall average, due to solar heating of the surrounding ocean surface.
  • Antarctica comprises 90 percent of the world’s ice, thus whatever happens to its ice and snow is a matter of serious concern, and if this situation continues, sea-levels would rise up to 60 meters by 2050 and the ocean would engulf coastal cities across the globe.

Compensatory Afforestation Fund Act | UPSC – IAS

Compensatory Afforestation Fund Rules vision ias UPSC - IAS

Compensatory Afforestation Fund Rules vision ias UPSC - IAS

Compensatory Afforestation Fund Act | UPSC – IAS

Compensatory Afforestation (CA) refers to afforestation and regeneration activities carried out as a way of compensating for forest land diverted to non-forest purposes. Here “non-forest purpose” means the breaking up or clearing of any forest land or a portion thereof for-

  • The cultivation of tea, coffee, spices, rubber, palms, oil-bearing plants, horticultural crops or medicinal plants;
  • any purpose other than reafforestation;

But does not include any work relating or ancillary to – Conservation, Development and management of forests and wildlife, namely,

  • The establishment of check-posts,
  • Fire lines,
  • Wireless communications and construction of fencing,
  • Bridges and culverts,
  • Dams,
  • Waterholes,
  • Trench marks,
  • Boundary marks,
  • Pipelines or other like purposes.

Compensatory Afforestation (CA) is one of the most important conditions stipulated by the Central Government while approving proposals for de-reservation or diversion of forest land for non-forest use. The compensatory afforestation is an additional plantation activity and not a diversion of part of the annual plantation programme.

Elements of Schemes for Compensatory Afforestation | UPSC – IAS

The scheme for compensatory afforestation should contain the following details:-

  • Details of equivalent non-forest or degraded forest land identified for raising compensatory afforestation.
  • Delineation of proposed area on a suitable map.
  • Agency responsible for afforestation.
  • Details of work schedule proposed for compensatory afforestation.
  • Cost structure of plantation, provision of funds and the mechanism to ensure that the funds will be utilised for raising afforestation.
  • Details of proposed monitoring mechanism.

More about Compensatory afforestation Fund Act| UPSC – IAS

The government enacted Compensatory Afforestation Fund Act 2016 to provide a proper institutional mechanism for compensatory afforestation matters.

The salient features of the Act include:-

  • The Act established National Compensatory Afforestation Fund (NCAF) under the Public account of India and State Compensatory Afforestation Funds under public accounts of states.
  • The National Fund will receive 10% of these funds, and the State Funds will receive the remaining 90%.
  • The fund will be used for compensatory afforestation, additional compensatory afforestation, penal compensatory afforestation, net present value, catchment area treatment plan or any money for compliance of conditions stipulated by the Central Government while according approval under the provisions of the Forest (Conservation) Act, 1980.
  • Act provides statutory status for two ad-hoc institutions, namely
    • National Compensatory Afforestation Fund Management and Planning Authority (NCAFM-PA) for management and utilisation of NCAF.
    • State Compensatory Afforestation Fund Management and Planning Authority for utilisation of State Compensatory Afforestation Fund.
  • The act also seeks to provide for constitution of a multidisciplinary monitoring group to monitor activities undertaken from these funds.
  • The act also provides for annual audit of the accounts by the Comptroller and Auditor General.

Compensatory Afforestation Fund 2019 the Hindu UPSC - IAS

Issues with the Act | UPSC – IAS

  • Compromising community forest rights: The land identified for compensatory afforestation would be under forest department’s jurisdiction thus, having adverse consequences for the hard-won rights of tribals and forest dwellers.
  • Lack of monitoring mechanism for expenditure from funds despite findings of Comptroller and Auditor General in 2013 about massive misutilization of funds by the forest department.
  • Scarcity of land as land is a limited resource, and is required for multiple purposes, such as agriculture, industry, etc. The problem is compounded by unclear land titles.
  • Inadequate Capacity of state forest departments for planning and implementation. Still utilisation of 90% of funds depend on it.
  • Low quality forest cover: Compensatory afforestation cannot make up for the ecological value lost by cutting the existing forests. Also, computing the appropriate Net Present Value of a forest is a challenge.
  • Poor survival rate of plantations raised under compensatory afforestation also raises serious questions about their effectiveness.
  • Diversion as land banks: The creation of land banks for Compensatory afforestation from revenue forests and degraded forests (on which communities have got traditional rights) further allows for takeover of community land.

A Way forward | UPSC – IAS

  • Primacy of Gram sabha: The CAF Act needs to be integrated with the FRA and PESA by centring the role of gram sabhas and incorporating land and forest rights guarantees.
  • Management of Compensatory afforestation: Emphasis should not only be on plantation but also on the maintenance of Compensatory afforestation.

India Cooling Action Plan UPSC | 20 Year | Ozone Layer | UPSC – IAS

India Cooling Action Plan (ICAP) 20 Year Road Map UPSC - IAS

India Cooling Action Plan (ICAP) 20 Year Road Map UPSC - IAS

India Cooling Action Plan (ICAP) | 20 Year Road Map |Ozone Layer| UPSC

Montreal Protocol is a global agreement to protect the ozone layer, by weaning out the production and consumption of ozone-depleting substances, and is similar to the Paris Agreement. The Montreal Protocol is quite the success story, and is the only environmental treaty to have been ratified by 197 UN member countries. It has been successful in reducing global production, consumption and emission of ozone layer-depleting substances

  • Ministry for Environment, Forest and Climate Change released the India Cooling Action Plan – a 20 year road map (From 2018 to 2038).

About Cooling Action Plan | UPSC – IAS

  • India is the first country in the world to develop such a document (ICAP), which addresses cooling requirement across sectors and lists out actions which can help reduce the cooling demand. This will help in reducing both direct and indirect emissions.
  • The Montreal Protocol on Substances that Deplete the Ozone Layer (a protocol to the Vienna Convention for the Protection of the Ozone Layer) is an international treaty designed to protect the ozone layer by phasing out the production of numerous substances that are responsible for ozone depletion. As per the Montreal Protocol, India is taking steps to curb elements that deplete the ozone layer.
  • India is one of the first countries in the world to develop a comprehensive Cooling Action Plan – to fight ozone layer depletion adhering to the Montreal Protocol.

Main targets of India Cooling Action Plan (ICAP)

  • Reduce cooling demand across sectors by 20% to 25% by 2037-38.
  • Reduce refrigerant demand by 25% to 30% by 2037-38,
  • Reduce cooling energy requirements by 25% to 40% by 2037-38,
  • Recognize “cooling and related areas” as a thrust area of research under national S&T Programme,
  • Training and certification of 100,000 servicing sector technicians by 2022-23, synergizing with Skill India Mission

ICAP provides an integrated vision:

  • To address the cooling requirement across different sectors of the economy such as residential and commercial buildings, cold-chain, refrigeration, transport and industries.
  • To lists out actions which can help reduce the cooling demand, enhancing energy efficiency and better technology options.

Significance of India Cooling Action Plan (ICAP) | UPSC – IAS

  • Thermal comfort for all – Provision for cooling for Economically Weaker Sections and Low Income Group housing.
  • Sustainable cooling – Reducing both direct and indirect Greenhouse Gases emissions related to cooling.
  • Doubling Farmers Income – Through better cold chain infrastructure–less wastage of produce leading to better value of produce to farmers.
  • Skilled workforce by creating jobs in service sector. For example- Skilling of AC and refrigerator service technicians.
  • Robust R&D on alternative cooling technologies to provide push to innovation in cooling sector.

Key actions included under India Cooling Action Plan (ICAP) | UPSC – IAS

  • Cooling buildings naturally through better design: Passively cooled building designs with natural and mechanical ventilation.
  • Adopting comfortable range of thermostat set-points in commercial buildings as well as for affordable housing projects under the Pradhan Mantri Awas Yojana for economically weaker sections.
  • Improving efficiency of cooling appliances: The plan makes ACs a focus area as the majority of energy consumption in space cooling is by room air-conditioners. A drive for widespread adoption of 5-star labelled fans and room air conditioners in new and existing public buildings.
  • Reducing cost of efficient air-conditioning through public procurement schemes.
  • Skilling and certifying AC and refrigerator service technicians.
  • Promoting renewable energy-based energy efficient cold chains
  • Investing in research and development (R&D) of refrigerant gases that do not harm or warm the planet.

Why India needs ICAP ? | UPSC – IAS

  • Cooling is an important developmental necessity as it is needed in different sectors of the economy. For example: Space cooling for buildings consumes 60% of the total energy supply for cooling in India.
  • India’s per capita space cooling consumption is nearly 1/4th of global average consumption. (Global average-272 kWh whereas India’s 69 kWh).
  • However, according to recent report, the current technology used in conventional cooling systems in air conditioners and refrigerators, coupled with an increasing demand for such appliances and rising global temperatures, could spur a 64 % increase in household energy use and produce over 23 million tonnes of carbon emissions by 2040.
  • This presents an urgent need (for India and other tropical countries) to develop a sustainable plan addressing both concerns.

Global Warming Causes and Climate Change Effects | UPSC – IAS

Global warming effects Acid rain, Greenhouse, Ozone Depletion, Deforestation UPSC IAS

Global warming effects Acid rain, Greenhouse, Ozone Depletion, Deforestation UPSC IAS

Global Warming and its Major effects on Environment and Human Health 

The “natural” greenhouse effect has been part of the basis of life on Earth since the early atmosphere formed. Without it, our planet would be a frozen mass, perhaps 30°C (54°F) colder than it is today. Over the last three decades, human-produced changes to the greenhouse effect have been brought to the attention of the media and the general public by the scientific community. Climate change has brought about possibly permanent alterations to Earth’s geological, biological and ecological systems

Data gathered from surface weather stations, ships, buoys, balloons, satellites, ice cores, and other paleoclimatological sources indicate that the climate of Earth is becoming warmer. This warming trend became known to the public as global warming, although many climate scientists prefer the more general term climate change because it encompasses the many effects of warming, such as changes in precipitation patterns.

Effects of global warming on Environment, human health and ecosystem:-

  • Hotter days: 2017 was the hottest year on record, the previous record was broken in 2015, and 2019 is expected to set a new record for the third year in a row.
  • Rising sea levels: Warmer temperatures also result in the expansion of the water’s mass, which causes sea levels to rise, threatening low-lying islands and coastal cities.
  • More frequent and intense extreme weather events: Extreme weather events like bush-fires, cyclones, droughts and floods are becoming more frequent and more intense as a result of global warming.
  • Species: One in six species is at risk of extinction because of climate change.
  • Food and farming: Changes to rainfall patterns, increasingly severe drought, more frequent heat waves, flooding and extreme weather make it more difficult for farmers to graze livestock and grow produce, reducing food availability and making it more expensive to buy.
  • Water: Reduced rainfall and increasingly severe droughts may lead to water shortages.
  • Coastal Erosion: Rising sea levels and more frequent and intense storm surges will see more erosion of Australia’s coastline, wearing away and inundating community and residential properties.
  • Health:  Increasingly severe and frequent heat waves may lead to death and illness, especially among the elderly. Higher temperatures and humidity could also produce more mosquito-borne disease.
  • Damage to homes:  Increasingly severe extreme weather events like bush-fires, storms, floods, cyclones and coastal erosion, will see increased damage to homes, as well as more costly insurance premiums.
  • Coral bleaching: Rising temperatures and acidity within our oceans is contributing to extreme coral bleaching events, like the 2016 event that destroyed more than one-third of the Great Barrier Reef.

Increasing Greenhouse Gas Concentrations | UPSC – IAS

The cause of global climate change appears to be human enhanced greenhouse effect. Since the industrial era began in the mid-1700s, human activities have increased the concentrations of greenhouse gases – such as:-

  • Carbon dioxide,
  • Methane,
  • Tropospheric ozone, and
  • Chlorofluorocarbons in the atmosphere.

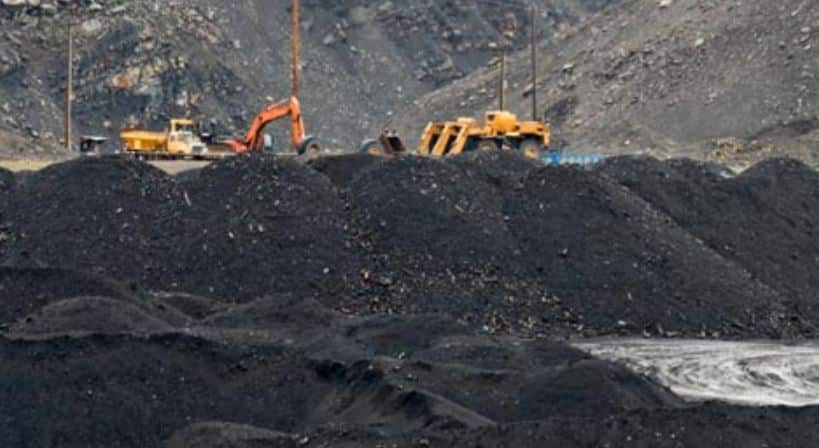
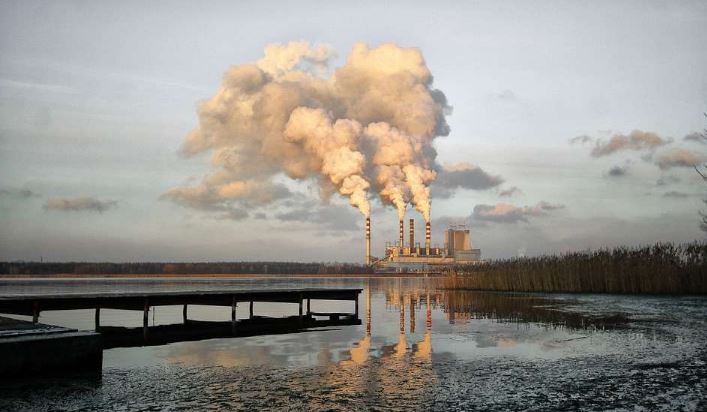
As greenhouse gas concentrations in the atmosphere increase, more terrestrial radiation is retained in the lower atmosphere, thereby increasing global temperatures. Carbon dioxide (CO2) is thought to be responsible for at least 60 percent of the human-enhanced greenhouse effect. CO2 concentrations have been rising steadily since the Industrial Revolution began in the mid-1700s. Carbon dioxide is a principal by-product of combustion of anything containing carbon, such as coal and petroleum

Since 1750 – when estimates show the concentration of CO2 in the atmosphere was about 280 parts per million (ppm) – carbon dioxide levels in the atmosphere have increased by more than 40 percent. The latest paleoclimatological data indicates that the current (May 2012) concentration of CO2 in the atmosphere of about 396 ppm is greater than at any time in the last 800,000 years.

Many other greenhouse gases have been added to the atmosphere by human activity.

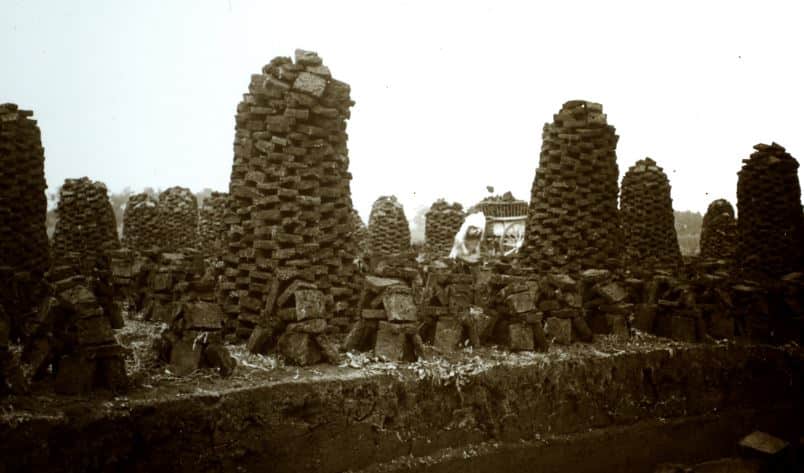
  • Methane – produced by grazing livestock and rice paddies and as a by-product of the combustion of wood,
  • Natural gas, coal, and oil – has more than doubled since 1750 and is about 25 times more potent as a greenhouse gas than CO2.
  • Nitrous Oxide which comes from chemical fertilizers and automobile emissions—has increased by about 18 percent since 1750.
  • Chlorofluorocarbons (CFCs) – are synthetic chemicals that were widely used as refrigerants and as propellants in spray cans until quite recently.

Many of these gases, and others, are being released into the atmosphere at accelerating rates. The increase in greenhouse gas concentrations, especially carbon dioxide, correlates well with the observed increase in global temperature: as CO2 has increased, so have average global temperatures.

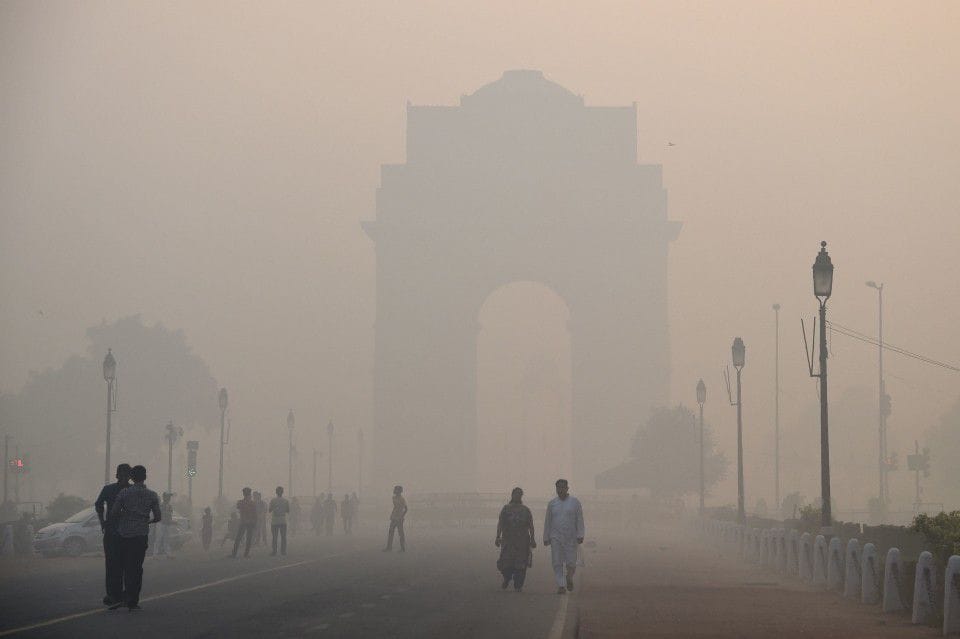
Acid Rain and its Sources | UPSC – IAS

One of the most troublesome environmental problems since the latter part of the twentieth century is acid rain— more generally called acid precipitation or acid deposition. This term refers to the deposition of either wet or dry acidic materials from the atmosphere on Earth’s surface. Although most conspicuously associated with rainfall, the pollutants may fall to Earth with snow, sleet, hail, or fog or in the dry form of gases or particulate matter.

Sources of Acid Precipitation:-

  • Sulfuric and nitric acids are the principal culprits recognized thus far. Evidence indicates that the principal human induced sources are sulfur dioxide (SO2) emissions from smokestacks (particularly electric utility companies in the United States, the smelting of metal ores in Canada), and nitrogen oxides (NOx) from motor vehicle exhaust.
  • These and other emissions of sulfur and nitrogen compounds are expelled into the air, where they may drift hundreds or even thousands of kilometers by winds. During this time they may mix with atmospheric moisture to form the sulfuric and nitric acids that are precipitated sooner or later.

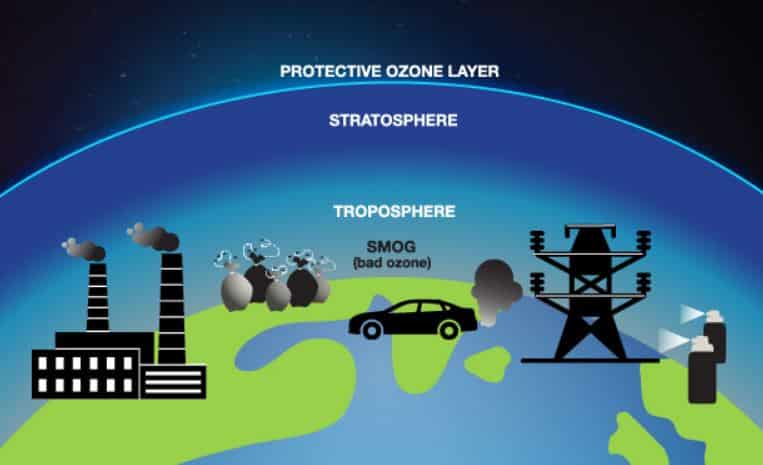
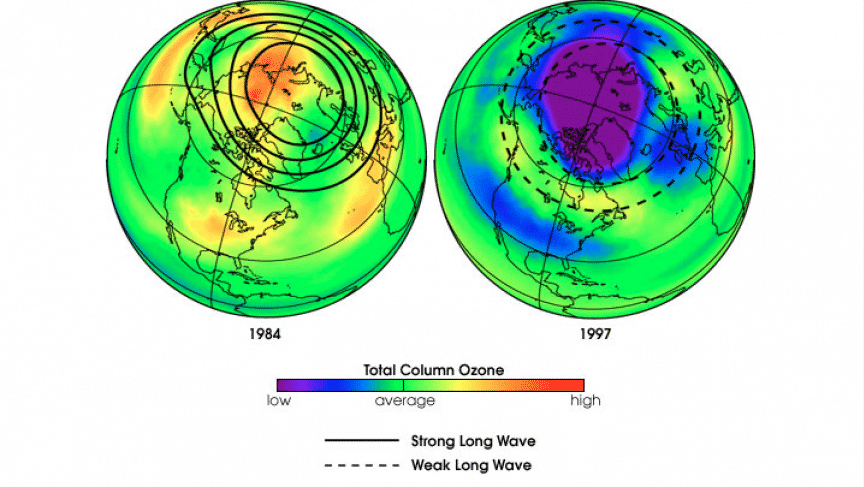
Depletion of the Ozone Layer | UPSC – IAS

Ozone is naturally produced in the stratosphere. It is a form of oxygen molecule consisting of three atoms of oxygen (O3) rather than the more common two atoms (O2). Ozone is created in the upper atmosphere by the action of ultraviolet solar radiation on diatomic oxygen (O2) molecules.

Ultraviolet (UV) radiation from the Sun is divided into three bands (from longest to shortest wavelengths): UV-A, UV-B, and UV-C. In the stratosphere, under the influence of UV-C, O2 molecules split into oxygen atoms; some of the free oxygen atoms combine with O2 molecules to form O2.

Natural Formation of Ozone – The natural breakdown of ozone in the stratosphere occurs when, under the influence of UV-B and UV-C, ozone breaks down into O2 and a free oxygen atom. Through this ongoing natural process of ozone formation and breakdown, nearly all of UV-C and much of UV-B radiation is absorbed by the ozone layer. The absorption of UV radiation in this photochemical process also serves to warm the stratosphere.

About 90 percent of all atmospheric ozone is found in the stratosphere where it forms a fragile “shield” by absorbing most of the potentially dangerous ultraviolet radiation from the Sun. Ultraviolet radiation can be biologically harmful in many ways.

  • Prolonged exposure to UV radiation is linked to skin cancer – both the generally curable nonmelanoma varieties as well as much more serious melanoma;
  • It is also linked to increased risk for cataracts;
  • It can suppress the human immune system,
  • Diminish the yield of many crops,
  • Disrupt the aquatic food chain by killing microorganisms such as phytoplankton on the ocean surface, and  may have other negative effects still undiscovered.

Ozone is also produced near Earth’s surface in the troposphere through human activities, forming one of the components of photochemical smog. However, it was a thinning of the stratospheric ozone layer first observed in the 1970s that triggered extensive research and monitoring.

Greenhouse effect and its impact on earth | UPSC – IAS

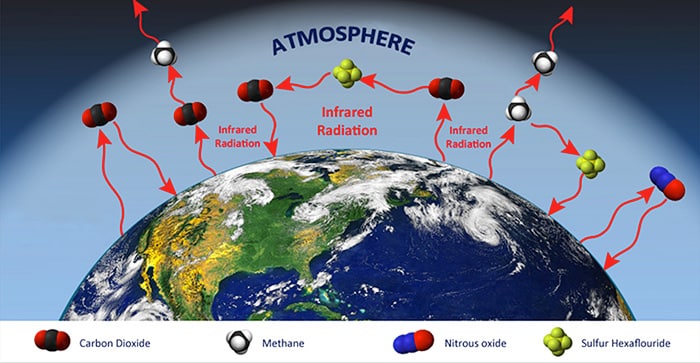
The greenhouse effect is at work in the atmosphere. A number of gases in the atmosphere, known as greenhouse gases, readily transmit incoming shortwave radiation from the Sun but do not easily transmit outgoing longwave terrestrial radiation. The most important greenhouse gas is water vapor, followed by carbon dioxide. Many other trace gases such as methane also play a role, as do some kinds of clouds.

In the simplest terms, incoming shortwave solar radiation transmits through the atmosphere to Earth’s surface, where this energy is absorbed, increasing the temperature of the surface. However, the longwave radiation emitted by Earth’s surface is inhibited from transmitting back through the atmosphere by the greenhouse gases. Much of this outgoing terrestrial radiation is absorbed by greenhouse gases and clouds, and then reradiated back toward the surface, hence delaying this energy loss to space.

  • The greenhouse effect is one of the most important warming processes in the troposphere. The greenhouse effect keeps Earth’s surface and lower troposphere much warmer than would be the case if there were no atmosphere – without the greenhouse effect, the average temperature of Earth would be about −15°C (5°F) rather than the present average of 15°C (59°F).
  • Although the ongoing, natural greenhouse effect in the atmosphere makes life as we know it possible, over the last century or so a significant increase in greenhouse gas concentration – especially carbon dioxide – has been measured.
  • This increase in atmospheric carbon dioxide is closely associated with human activity, especially the burning of fossil fuels such as petroleum and coal (carbon dioxide is one of the by-products of combustion).
  • The increase in greenhouse gas concentration has been accompanied by a slight, yet nonetheless significant, increase in average global temperature, raising the likelihood that humans are altering the global energy balance of the atmosphere. This important issue, commonly referred to as global warming.
Major greenhouse gases
Methane
Methane
Sulfur hexafluoride
Sulfur hexafluoride
Ozone
Ozone
Water vapor
Water vapor
Fluorocarbon
Fluorocarbon
Fluoroform
Fluoroform
Nitrogen trifluoride

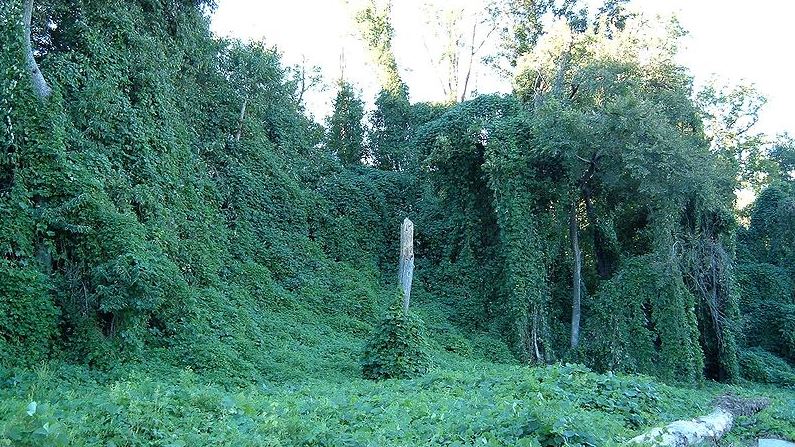
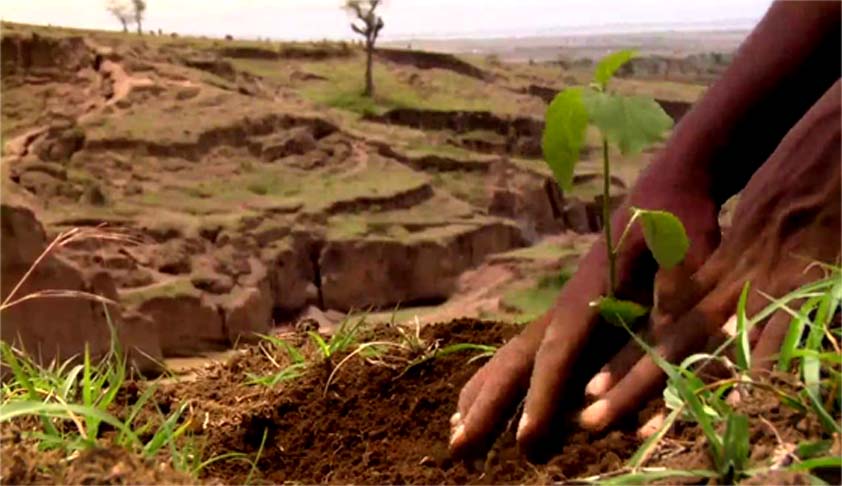
Deforestation – Tropical Rainforest | UPSC – IAS

How does cutting down trees affect us and our environment? – Throughout much of history, most rainforests of the world were only moderately populated and as a consequence they were affected by human activities in limited ways.

  • Since the twentieth century, however, rainforests have been exploited and devastated at an accelerating pace; and over the past 40 years or so, tropical deforestation has become one of Earth’s most serious environmental problems.
  • The exact rate of deforestation around the world – in both the tropics and temperate forest regions – is not precisely known, but the United Nations Food and Agriculture Organization (FAO) estimates that between 2000 and 2010, about 13 million hectares (32 million acres) of forest were being lost each year.
  • Between 1990 and 2005 about 42 million hectares (104 million acres) of rainforest was cleared in Brazil alone—the greatest total of any country during that time period and an area approximately equal to that of California. Indonesia ranked second with more than 25 million hectares (62 million acres) cleared during those years.
  • In South and Southeast Asia, where commercial exploration, especially for teak and mahogany is important, about 45 percent of the original forest no longer exists. Approximately 40 percent of Latin America’s rainforest has been cleared. Much of the very rapid deforestation in Central America has been due to expanded cattle ranching.
  • Deforestation of the Amazon region as a percentage of the total area of rainforest has been moderate (perhaps 20 percent of the total has been cleared). As the forest goes, so goes its habitability for both indigenous peoples and native animal life.

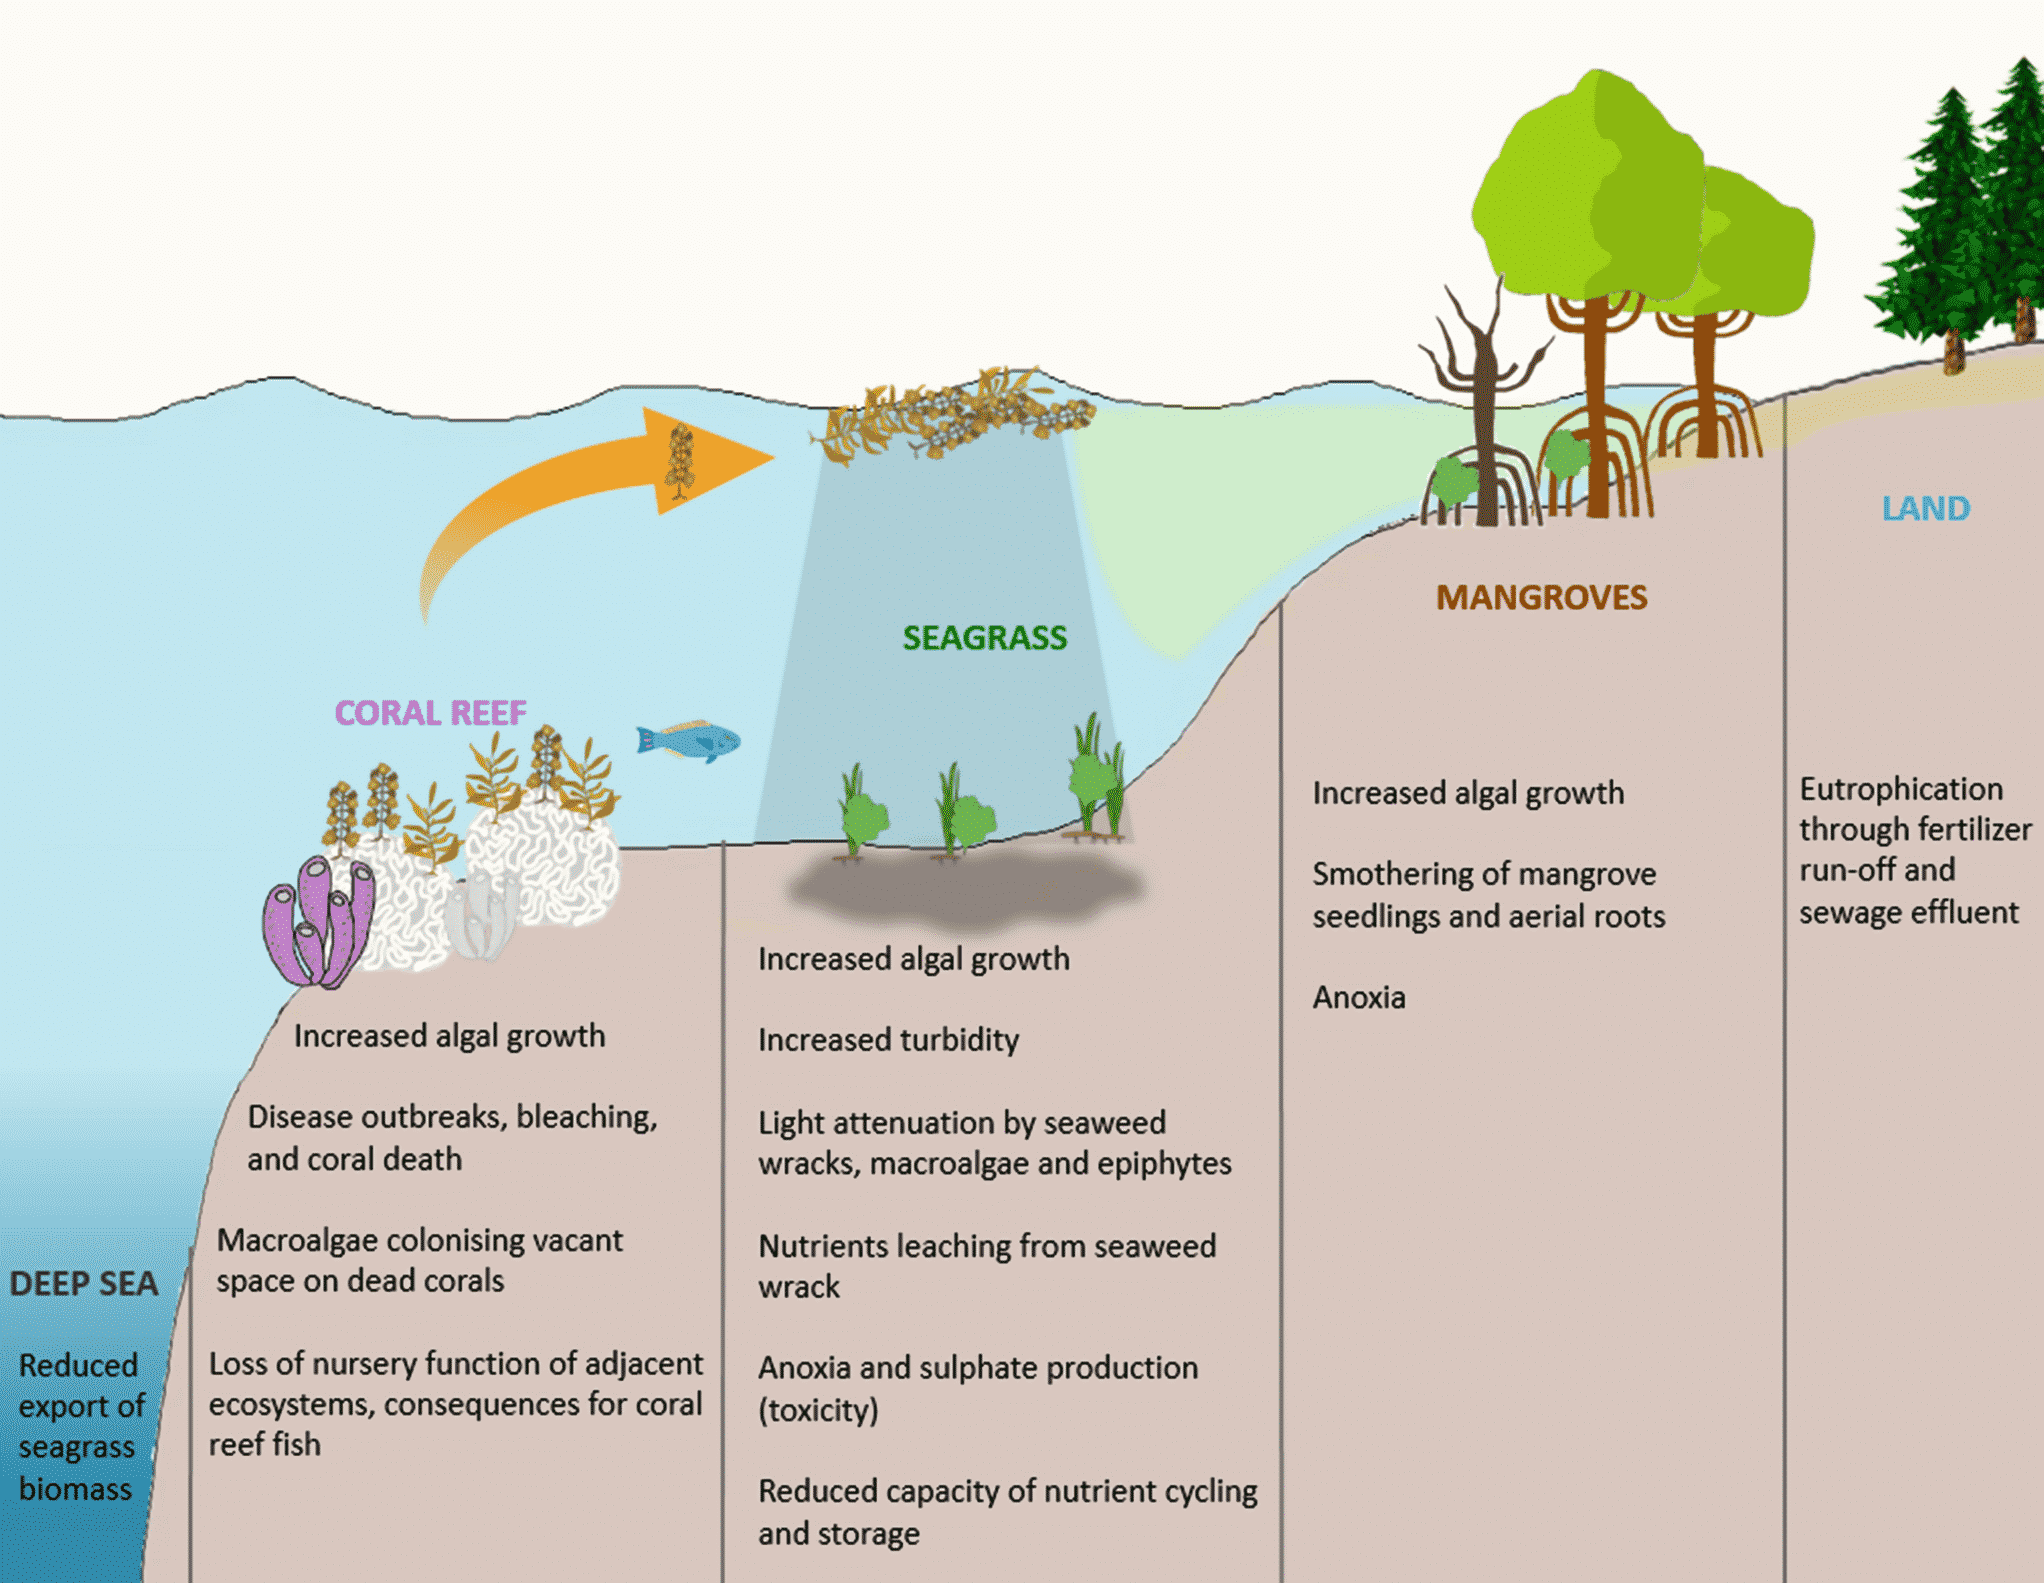
Causes of Acidification of Oceans

The oceans absorb carbon dioxide from the atmosphere. Perhaps one-third of the excess CO2 released into the air each year by human activity is absorbed by the oceans. When CO2 is taken in by the ocean, it forms carbonic acid (H2CO3), a weak acid.

Oceans are warming and acidifying: The oceans have absorbed most of extra heat and carbon dioxide (CO2) so far – more than the air – making the seas both warmer and more acidic. Warming waters are bleaching coral reefs and driving stronger storms. Rising ocean acidity threatens shellfish, including the tiny crustaceans without which marine food chains would collapse.

  • Research now suggests that as a result of the great quantities of CO2 absorbed since the beginning of the industrial revolution, the ocean is becoming more acidic.
  • Currently, ocean water is slightly alkaline, with a pH of 8.1. Although still alkaline, this value is estimated to be about 0.1 lower – in other words more acidic – than it was in the preindustrial era.
  • Given the current rate of fossil fuel use and continued absorption of CO2 by the oceans, the pH of ocean water could drop to 7.7 by the end of this century.
  • The consequences of a slightly more acidic ocean are not completely known, but it is likely that it will affect the growth of organisms such as coral polyps and microscopic creatures such as foraminifera that build their shells or exoskeletons from calcium carbonate (CaCO3) extracted from seawater.
  • As the oceans become more acidic, there are fewer calcium ions in seawater and so the growth of calcium carbonate shells is inhibited.
  • It is not clear if these creatures will be able to adapt to the changing chemistry of the ocean. Because foraminifera are at the bottom of the oceanic food web, among the potentially important consequences of a decline in their numbers would be the loss of food for a number of fish, such as mackerel and salmon.
  • If the increased acidity of the oceans reduces the growth of coral polyps, coral reefs—already under stress worldwide from higher temperatures—might possibly degrade even further 
  • In addition to bleaching, coral reefs are being stressed by the slight acidification of the ocean waters caused by the absorption of carbon dioxide.
  • In January 2009, an international panel of 155 marine scientists issued the Monaco Declaration, stating that damage from ocean acidification is already detectable, and that with the projected increase in atmospheric carbon dioxide – and the associated increased acidification of the ocean—many regions of the world will become “chemically inhospitable” to coral reefs by mid-century.

Sea level Rise Causes

  • Ice caps and glaciers decreased in both hemispheres, contributing to sea level rise; the flow speed of some Greenland and Antarctic outlet glaciers has increased.
  • Since 1980, temperatures at the top of the permafrost layer have increased by as much as 3°C (5.4°F), and since 1900 the extent of seasonally frozen ground has been reduced by about 7 percent.

El Niño and Global warming

  • El Niño Periodic atmospheric and oceanic phenomenon of the tropical Pacific that typically involves the weakening or reversal of the trade winds and the warming of surface water off the west coast of South America.
  • The warming of coastal waters during the 1982–83 El Niño was observed to cause coral bleaching in Panama; the 1997–98 El Niño was even stronger and caused bleaching in reefs around the world.
  • El Niño’s strongest impacts are felt around the equatorial Pacific, they can affect weather around the world by influencing high and low pressure systems, winds and precipitation. And as the warmer ocean waters release excess energy (heat) into the atmosphere, global temperatures rise.

Why Ecosystem Loss ?

Global warming stresses ecosystems through temperature rises, water shortages, increased fire threats, drought, weed and pest invasions, intense storm damage and salt invasion.

Loss of biodiversity appears to affect ecosystems as much as climate change, pollution and other major forms of environmental stress, according to results of a new study by an international research team.

  • Ecosystem perturbations driven by climate change have direct human impacts, including reduced water supply and quality, the loss of iconic species
  • Hunting, habitat loss, and illegal bush-meat trade has raised the number of threatened primate specie
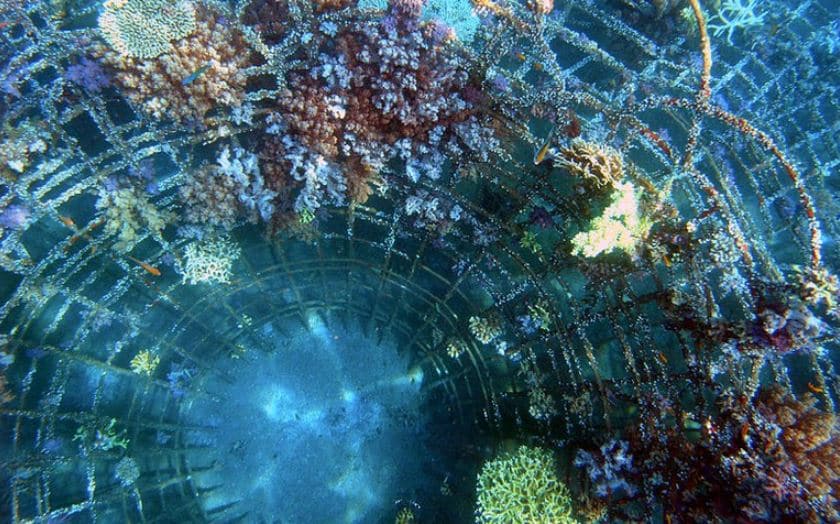
  • The loss of coral reefs through bleaching and other natural and human-produced causes is alarming many researchers.
  • When coral dies, an entire ecosystem is at risk: the fish and other creatures that depend on coral for survival are stressed, local fisheries can decline, the protection from storm waves offered to low-lying islands fringed with reefs is diminished, and, of course, the loss of species and biodiversity may be irreparable.

Land degradation and its Causes | UPSC – IAS

Land degradation is a process in which the value of the biophysical environment is affected by a combination of human-induced processes acting upon the land. It is viewed as any change or disturbance to the land perceived to be deleterious or undesirable.

Overcutting of vegetation occurs when people cut forests, woodlands and shrublands—to obtain timber, fuel-wood and other products—at a pace exceeding the rate of natural regrowth. This is frequent in semi-arid environments, where fuelwood shortages are often severe.

Land degradation caused by mining as it cause landslides Land degradation is a global problem largely related to agricultural use.

Causes of Land degradation | UPSC – IAS

  • Land clearance, such as clear cutting and deforestation
  • Agricultural depletion of soil nutrients through poor farming practices
  • Livestock including overgrazing and overdrafting
  • Inappropriate irrigation and overdrafting
  • Urban sprawl and commercial development
  • Vehicle off-roading
  • Quarrying of stone, sand, ore and minerals
  • Increase in field size due to economies of scale, reducing shelter for wildlife, as hedgerows and copses disappear
  • Exposure of naked soil after harvesting by heavy equipment
  • Monoculture, destabilizing the local ecosystem
  • Dumping of non-biodegradable trash, such as plastics
  • Invasive Species
  • Soil degradation, e.g.
    • Soil contamination
    • Soil erosion
    • Soil acidification
    • Loss of soil carbon

Human overpopulation | UPSC – IAS

Human overpopulation occurs when the ecological footprint of a human population in a specific geographical location exceeds the carrying capacity of the place occupied by that group.

The Human overpopulation or population explosion has had various consequences:-

  • Producing enough food for 7 billion humans has required farming techniques that pollute, reduce biodiversity, and destroy topsoil.
  • Over the last 20,000 years, humans have deforested a major fraction of the Earth.
  • In the last few centuries, humans have burned through a supply of carbon fuel that has been accumulating in the Earth for several billion years. The resulting carbon emissions are causing global climate change, with possibly catastrophic consequences.
  • Humans have polluted the Earth, and especially its seas, with toxic chemicals, radioactive waste, and plastic debris. Many of these synthetic poisons will not disappear naturally for hundreds of thousands of years.
  • Humans have colonized most of the animal-friendly land on Earth, and made it unlivable for most other species.
  • Humans have hunted to extinction numerous species, either because they threatened us or fed us.
  • These factors in combination are causing extinction of non-human species (even those we don’t eat or fear) on an unprecedented scale – about 1,000 times faster than the historical average.

Climate change and poverty | UPSC – IAS

  • Climate change’s adverse effects mostly impact poor and low-income communities around the world. Those in poverty have a higher chance of experiencing the ill-effects climate change due to increased exposure and vulnerability
  • Over 2 billion people – one third of the global population – are poor or near-poor and face persistent threats to their livelihoods, including from climate change. Estimates indicate that by 2030 more than 100 million people could fall back into extreme poverty due to climate change, while over 200 million people could be displaced due to more frequent and severe climatic disasters.
  • Climate change and poverty link a process and a condition that are interrelated. While climate change and global warming affect the natural environment, especially agriculture, it also affects humans. Climate change globally impacts poverty, particularly in low-income communities.

Resource depletion 

Resource depletion is the consumption of a resource faster than it can be replenished. Natural resources are commonly divided between renewable resources and non-renewable resources. Use of either of these forms of resources beyond their rate of replacement is considered to be resource depletion

Is Climate Change Natural or Anthropogenic ? | UPSC – IAS

Human impact on the environment or anthropogenic impact on the environment includes changes to biophysical environments and ecosystems, biodiversity, and natural resources  caused directly or indirectly by humans, including

  • Global warming,
  • Environmental degradation (such as ocean acidification),
  • Mass extinction
  • Biodiversity loss
  • Ecological crisis, and 
  • Ecological collapse.

Modifying the environment to fit the needs of society is causing severe effects, which become worse as the problem of human overpopulation continues. Some human activities that cause damage (either directly or indirectly) to the environment on a global scale include

  • Human reproduction,
  • Overconsumption,
  • Overexploitation,
  • Pollution, and
  • Deforestation

Some of the problems, including global warming and biodiversity loss pose an existential risk to the human race, and overpopulation causes  those problems.

Evidence of Current Climate Change

The Intergovernmental Panel on Climate Change (IPCC) is the most authoritative international body providing information about climate change to global leaders. In evaluating evidence of climate change over the last century, the Fourth Assessment Report of the IPCC released in 2007 concluded that the warming of global climate is “unequivocal.”

  • The Fifth Assessment Report of the IPCC is due out beginning in 2013, and the findings it will present are expected to reinforce and clarify the findings of the Fourth Assessment Report (AR4). Findings of the AR4 along with updates from recent research include:

Changes in Air Temperature

Between 1906 and 2005 global average temperature increased by 0.74°C (1.33°F), with estimates ranging from 0.57 to 0.95°C (1.03 to 1.71°F).

Projected temperature changes from 2000 to 2100 under different IPCC emission scenarios. UPSC IAS PCS

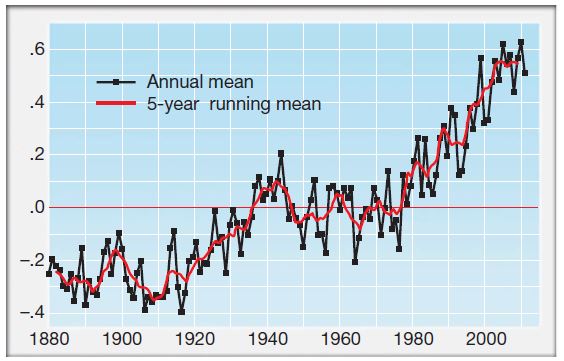
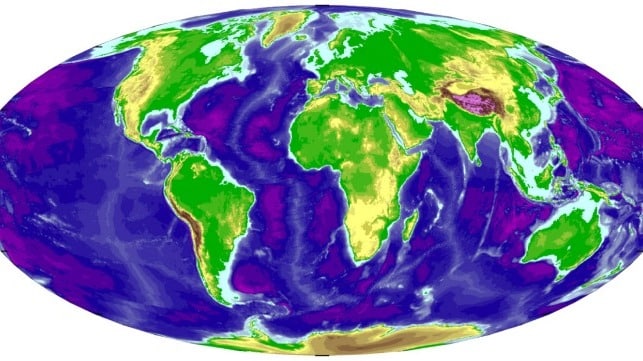
The global temperature anomalies, or departure from average, from 1880 to 2011. (Image)

  • Based on instrument data of temperature since 1880, 9 of the 10 warmest years on record have occurred since 2000 (1998 is the only year in the twentieth century that is in the “top ten”). The year 2011 ranked ninth overall, 0.51°C (0.92°F) warmer than the mid-twentieth century baseline and, as of this writing, 2012 was on track to be one of the warmest years on record.
  • Over the last 50 years average global temperature has been increasing at a rate of about 0.13°C (0.23°F) per decade, almost twice the rate of the twentieth century as a whole. Average temperatures in the Northern Hemisphere during this time period are likely (greater than 66 percent probability) to be higher than at any time in at least 1300 years.

Changes in the Oceans due to Climate Change

Data since 1961 shows that global ocean temperature has increased to depths of at least 3000 meters (9800 feet), and that 80 percent of the energy added to the global climate system has been absorbed by the oceans.

  • In part because of thermal expansion of seawater, global sea level has been rising. During the twentieth century, the estimated total global sea level rise was 0.17 meters (6.7 inches). The average rate of global sea level rise between 1961 and 2003 was about 1.8 mm (0.07 inches) per year, although since 1993 the rate has increased to about 3.27 mm (0.128 inches) per year.

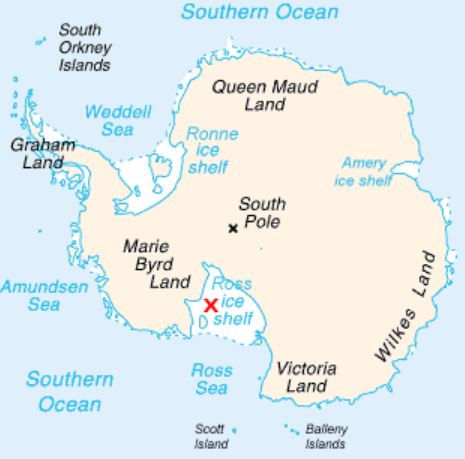
Changes in Polar Regions

  • In the Arctic, over the last 100 years average temperatures have been increasing at almost twice the global rate, although in this region there is high observed variability from decade to decade.
  • Between 1978 and 2007, data from satellites shows that average extent of summer sea ice in the Arctic Was decreasing at a rate of about 7.4 percent per decade (by 2011, the rate had increased to 12 percent per decade). By the end of the summer in 2007 the extent of Arctic sea ice was the smallest measured since regular satellite monitoring of the ice pack began in 1979 (a new record low was set in 2012). Sea ice around Antarctica has shown great annual variation and local changes, but no statistically significant average trend was noted by the IPCC.
  • Ice caps and glaciers decreased in both hemispheres, contributing to sea level rise; the flow speed of some Greenland and Antarctic outlet glaciers has increased.
  • Since 1980, temperatures at the top of the permafrost layer have increased by as much as 3°C (5.4°F), and since 1900 the extent of seasonally frozen ground has been reduced by about 7 percent.

Changes in Weather Patterns:

  • Observations indicate that there may have been an increase in the number of intense tropical cyclones in the North Atlantic Ocean basin since 1970, and this is correlated with an increase in sea-surface temperatures in the tropics.
  • The average amount of water vapor in the atmosphere over both land and ocean areas has increased since the 1980s, consistent with the higher water vapor capacity of warmer air.
  • Between 1900 and 2005 statistically significant increases in average precipitation were observed in parts of North America, South America, Central and Northern Asia, and Northern Europe, whereas decreases in average precipitation were observed in Southern Africa, South Asia, around the Mediterranean, and in the Sahel; since the 1970s, longer and more intense droughts have been observed over wide areas.
  • These observed increases in global temperature and the secondary effects of this warming correlate very closely with an increase in greenhouse gas concentrations tied to human activity. Carbon dioxide in the atmosphere, the most important anthropogenic greenhouse gas, had increased from a pre-industrial level of about 280 parts per million (ppm) to 396 ppm by May 2012.
  • Methane, another key anthropogenic greenhouse gas, increased in concentration from a preindustrial level of about 715 parts per billion (ppb) to 1799 ppb by 2010. Ice-core data from Dome C in Antarctica shows that the current concentrations of both carbon dioxide and methane in the atmosphere are now higher—and that they increased more rapidly in recent decades—than at any time in the past 800,000 years. It is likely that this increase in greenhouse gases would have caused more warming than that observed if not offset by slight cooling from anthropogenic and volcanic aerosols.

Projections of Future Climate

The IPCC’s Fourth Assessment Report concluded that global climate “sensitivity” to a doubling of pre-industrial carbon dioxide levels is likely [a greater than 66 percent probability] to be a temperature increase of 2.0 to 4.5°C (3.6 to 8.1°F), with a best estimate of about 3.0°C (5.4°F).

  • However, projections of the temperature increase expected by the middle or end of this century are more complicated to calculate: In addition to the great complexity of the global climate system is uncertainty about how levels of greenhouse gases will actually change in coming decades.
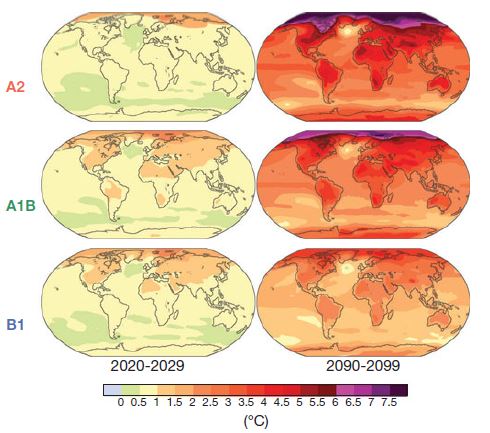
  • Six different emission scenarios were modeled by the IPCC. The various scenarios were based on different rates of global population increase, different rates of fossil fuel use, different rates of per capita economic growth around the world, among other factors

Projected global surface temperature changes for the years 2020 to 2029 and 2090 to 2099 under different IPCC emission scenarios. UPSC IAS PCS

The projections of the IPCC in the Fourth Assessment Report include

Temperature Change Projections:

  • Over the next two decades climate will warm at a rate of about 0.2°C (0.4°F) per decade.
  • If greenhouse gas emissions continue at or above the present rates, the changes in global climate during this century will very likely be (greater than 90 percent probability) greater than the observed changes during the twentieth century.
  • The best estimates of the global temperature increase by the year 2099 for the six emissions scenarios studied for the Fourth Assessment Report range from a low of 1.8°C (3.3°F) to a high of 4.0°C (7.2°F).

Sea-Level Change Projections:

  • The accompanying rise in sea level from thermal expansion and increased rates of ice flow from Antarctica and Greenland under these scenarios ranges from about 0.18 meters (7.1 inches) to 0.59 meters (23.2 inches) by the end of this century

Polar Region Change Projections:

  • Warming is expected to be greatest over land and in high northern latitudes, and least over the Southern Ocean; snow cover on land is expected to diminish.
  • Sea ice is projected to diminish in the Arctic and Antarctic in all emission scenarios, with summer sea ice disappearing in the Arctic by the end of this century in some scenarios.

Weather Pattern Change Projections:

  • It is likely that tropical cyclones will become more intense in association with projected increases in sea surface temperatures; the storm tracks of midlatitude cyclones are projected to move poleward.
  • Precipitation is very likely to increase in high latitudes and likely to decrease in most subtropical areas over land.
  • It is very likely (greater than 90 percent probability) that heat waves, heavy precipitation events, and hot extremes will occur more frequently. Plant and Animal Change Projections:
  • Tropical diseases may become more prevalent in regions beyond their current ranges.
  • As climate changes, some plant and animal species will exhibit shifts in their distributions; wildfire risk will increase in areas of decreased rainfall.
  • With increased global temperatures, risk of species extinction may increase. Among the most troubling findings of the IPCC is that global temperatures are projected to continue increasing and sea level to continue rising even if the concentrations of greenhouse gases are stabilized immediately.

Jerzego sunillimaye – Jumping Spiders | UPSC – IAS

Jerzego sunillimaye - Jumping Spiders UPSC - IAS

Jerzego sunillimaye - Jumping Spiders UPSC - IAS

Jerzego sunillimaye – Jumping spiders and their Significance | UPSC – IAS

(New species of Arachnid found in Mumbai’s Aarey Colony)

In a study published on Saturday by Russian peer reviewed journal Arthropoda Selecta, a teamled by arachnologists Rajesh Sanap, Dr. John Caleb and biologist Anuradha Joglekar announced that they had discovered a new species of jumping spiders in the city’s Aarey Milk Colony. A new species of jumping spider has been discovered in Mumbai’s Aarey Colony.  It has been named after additional principal chief conservator of forest, Sunil Limaye, Jerzego sunillimaye

  • first time found in 2016

Jumping spiders and their Significance

Spiders are Significant creatures as they are pest controllers. They are like the tigers of the microhabitat world. Pulling them out could cause ecological imbalance.

Jumping spiders comprise 13 percent of the global spider population. According to the researchers, the jumping spider family (Salticidae) is the most diverse spider family, with their world fauna consisting of 6,126 described species. A whole team of spider experts spent about three years to study the species. Their observations were published in the journal Arthropod Selecta.

In the World – 4,800 species

Jumping spiders are a group of spiders that constitute the family Salticidae. As at 1 February 2019, this family contained 636 described genera and 6115 described species, making it the largest family of spiders at 13% of all species.

While other species of jump­ing spiders such as the Lan­ gelurillus Onyx, Langeluril­ lus Lacteus – both described in 2017 – and Piranthus de­corus – recorded for the first time in 122 years in the area – have inhabited the Aarey Colony, more studies per­taining to their complete biology, habits and interac­tions with other species are yet to be carried out. While there are 4,800 species of spiders in the world, India alone accounts for 1,800 spider species.

Scientific name: Salticidae
Family: SalticidaeBlackwall, 1841
Higher classification: Araneomorphae
Class: Arachnida
Kingdom: Animalia
Did you know: Bites from jumping spiders aren’t dangerous since jumping spiders are not venomous.

Kelp Forests and Climate Change | UPSC – IAS

Kelp Forests and Climate Change Map Salinity deforestation UPSC - IAS

Kelp Forests and Climate Change Map Salinity deforestation UPSC - IAS

Kelp Forests and Climate Change | UPSC – IAS

Kelp forests are underwater areas with a high density of kelp. They are recognized as one of the most productive and dynamic ecosystems on Earth. Smaller areas of anchored kelp are called kelp beds. Kelp forests occur worldwide throughout temperate and polar coastal oceans. They are large brown algae seaweeds. They grow in “underwater forests”  in shallow oceans.

Generally speaking, kelps live further from the tropics than coral reefs, mangrove forests, and warm-water seagrass beds.

  • Although kelp forests are unknown in tropical surface waters, a few species have been known to occur exclusively in tropical deep waters.
  • Kelps and coral reefs are composed of algae that grow in the shallow parts of the ocean in warm and sunny waters.
  • However, kelp forest grows in nutrient-rich waters while corals can develop in low nutrient waters.

The environmental factors necessary for kelp to survive include hard substrate (usually rock), high nutrients, clear shallow coastal waters and light.

  • The productive kelp forests tend to be associated with areas of significant oceanographic upwelling.
  • They are known for their high growth rate. Some varieties grow as fast as half a metre a day, ultimately reaching 30 to 80 metres.

Kelp Forest Deforestation | UPSC – IAS

Some of the drivers shifting kelp forests into degraded turf reefs are:-

  • Marine heat waves,
  • Strong storms,
  • Expanding tropical herbivores,
  • Gradual warming temperatures,
  • Invasive species and nutrient pollution

Ocean warming and ocean acidification – can cause changes in the microbiome on the surface of Kelp, leading to disease symptoms like blistering, bleaching and eventually degradation of the kelp’s surface.

  • The proportion of kelp showing signs of bite marks increased from less than 10% in 2002 to more than 70% in 2008, before there was no kelp to measure. At the same time the proportion of tropical fish in the ecosystem increased from less than 10% to more than 30%.
  • This will affect the Kelp ability to photosynthesize and potentially survive.
  • This could impact kelp forests around the world and potentially putting the marine biodiversity at risk, which thrives on these forests.

Significance of Kelp Forests | UPSC – IAS

  • They are considered as Keystone Species and their removal is likely to result in a relatively significant shift in the composition of the community and perhaps in the physical structure of the environment.
  • It provides as an important source of food for many marine species. In some cases, up to 60% of carbon found in coastal invertebrates is attributable to kelp productivity. It may be consumed directly or colonised by bacteria that in turn are preyed upon by consumers. Also, the rich fauna of mobile invertebrates in kelp beds makes this an important habitat in the diet of fish species. They provide a foraging habitat for birds due to the associated and diverse invertebrate and fish communities present.
  • It increases productivity of the near shore ecosystem and dumps carbon into that ecosystem. Kelp primary production results in the production of new biomass, detrital material etc.
  • It slows down the flow of the water which is important in situations where animals are spawning and releasing their larvae.
  • They are natural breakwaters and prevent coastal erosion.
  • They can influence coastal oceanographic patterns and provide many ecosystem services.
  • It is an important source of potash and iodine. Many kelps produce algin, a complex carbohydrate useful in industries such as tire manufacturing, ice-cream industry.

Kelp Forest Salinity | UPSC – IAS

  • Kelp forests are found in cold, nutrient-rich water and are found in the shallow coast. Kelp forests have a very high salinity.
  • They are usually in a water temperature in the 50-65 degree range.
  • Kelp forests are not deeper than 80 feet and almost never shallower than 20 feet.
  • The kelp life can be shorter if winter is longer
  • These brown algae communities live in clear water conditions through which light penetrates easily.

Removedebris Satellite Mission | UPSC – IAS

Removedebris Satellite Mission UPSC - IAS

Removedebris Satellite Mission UPSC - IAS

Removedebris satellite Mission | UPSC – IAS

RemoveDEBRIS was launched aboard the SpaceX Dragon refill spacecraft on 2 April 2018 as part of the CRS-14 (Commercial Resupply Service mission), arriving at the International Space Station on 4 April. Deployment of the satellite from the station’s Kibo module via robotic Canadarm-2 took place on 20 June 2018. At approximately 100 kg, RemoveDEBRIS is the largest satellite to have ever been deployed from the International Space Station.

About RemoveDebris Satellite Mission

RemoveDEBRIS is a satellite research project intending to demonstrate various space debris removal technologies. The satellite’s platform was manufactured by Surrey Satellite Technology Ltd (SSTL) and is a variant of the SSTL X50 series.

Rather than engaging in active debris removal (ADR) of real space debris, the RemoveDEBRIS mission plan is to test the efficacy of several ADR technologies on mock targets in LEO (low Earth orbit). In order to complete its planned experiments the platform is equipped with:-

  • A net,
  • A harpoon,
  • A laser ranging instrument,
  • A dragsail, and
  • Two CubeSats (miniature research satellites)

Space debris encompasses both natural (meteoroid) and artificial (man-made) particles. Meteoroids are in orbit about the sun, while most artificial debris is in orbit about the Earth. Hence, the latter is more commonly referred to as orbital debris.

  • The term Kessler syndrome is associated with Space Debris, which is used to describe a self-sustaining cascading collision of space debris in LEO (Low Earth Orbit).

The RemoveDebris satellite platform will showcase four methods for release, capture and deorbit two space debris targets, called DebriSATs:

  • Net capture: It involves a net that will be deployed at the target CubeSat.
  • Harpoon Capture: Which will be launched at a target plate made of “representative satellite panel materials”
  • Vision-based navigation: Using cameras and LiDAR (light detection and ranging), the platform will send data about the debris back to the ground for processing.
  • De-orbiting process: As it enters Earth’s atmosphere, the spacecraft will burn up, leaving no debris behind. The mission will demonstrate key Active Debris Removal (ADR) technologies in orbit, which will have significance for future missions as well.

As part of the space junk cleanup, a new device named space harpoon that captures junk has been tested successfully. It is part of the RemoveDEBRIS satellite project, a multi-organization European effort to create and test methods of reducing space debris

Space Harpoon

The harpoon is meant for larger targets, for example full-size satellites that have malfunctioned and are drifting from their orbit. A simple mass driver could knock them toward the Earth, but capturing them and controlling descent is a more controlled technique.

About Inter-Agency Space Debris Coordination Committee

  • It is an international governmental forum for the worldwide coordination of activities related to the issues of man-made and natural debris in space.
  • It aims to exchange information on space debris research activities between member space agencies, to facilitate opportunities for cooperation in space debris research, to review the progress of ongoing cooperative activities, and to identify debris mitigation options.
  • ISRO is also a member of this committee.

Why Space Debris is a concern?

  • Increase the cost of missions- Various space agencies have to manoeuvre their space programme in light of increasing space debris thus adding to extra economic and human resource on space programme.
  • Debris is bound to increase Space-scientists concern about the inexpensive, tiny satellites called CubeSats, which are going to add space junk around 15% in next 10 years.

Obstruction to various space endeavors

  • NASA estimates that there are about 500,000 pieces of debris larger than half an inch across in low orbit, posing a potential danger to the 780-odd satellites operating in the area.
  • Space junk travels at speeds up to 30,000 km an hour, which turns tiny pieces of orbital debris into deadly shrapnel that can damage satellites, space shuttles, space stations and spacecraft with humans aboard.

Climate Change and International Security Issue | UPSC

Climate Change and International Security Issue UPSC IAS PCS Gk today

Climate Change and International Security Issue  UPSC IAS PCS Gk today

Why Climate Change is a security issue? | UPSC IAS

Many Scholars declared Climate Change as Warming War which requires intervention of United Nation Security Council as per its mandate under article 39 of UN charter. The Warming War is a metaphor (like Cold War) which conveys how climate change acts as a driver of such conflict, as its impacts accumulate and multiply to threaten the security of human life on earth.

Article 39 of UN charter The Security Council shall determine the existence of any threat to the peace, breach of the peace, or act of aggression and shall make recommendations, or decide what measures shall be taken to maintain or restore international peace and security.

Climate Change as a Security Issue | UPSC IAS

  • Earth’s limited resources are under pressure as demand for food, water, and energy is increasing. Widespread unemployment, rapid urbanization, and environmental degradation can cause persistent inequality, political marginalization, and unresponsive governments leading to instability and conflict.
  • In above context United Nation Environment Program has identified seven factors where climate change acts as threat multiplier to security and peace of states and society.
  • Local resource competition: As pressure on local resources is increasing, competition can lead to instability and even violent conflict in absence for proper dispute resolution.
  • Livelihood insecurity and Migration
    • Climate change will increase the insecurity of farmers who depend on natural resources for livelihood. It could push them to migrate and turn to informal and illegal source of income.
    • As per World Bank estimates by 2050, about 140 million people will be forced to leave their place of origin in South Asia, Africa and Latin America.
  • Extreme weather events and disasters: Disasters will exacerbate fragile situation and can increase people vulnerabilities and grievances especially in countries affected by conflict.
  • Volatile food price
    • Climate change is likely to disrupt food production in many regions, increase prices, market volatility and heightening risk of protest, rioting and civil conflicts.
    • As per IPCC assessment by 2080 there will be 770 million undernourished people by 2080 due to climate change.
  • Transboundary water management
    • It is a frequent source of tension. As demand grows and climate impact affects availability and quality, competition over water use will likely exert pressure at local, regional and global level.
    • According to recently released Hindu Kush-Himalayan Assessment report with current emission level two-third of glaciers in the region will be lost by 2100 and cause water crisis for 2 billion people.
  • Sea level rise and coastal degradation
    • Rising sea level will threaten the viability of low lying areas even before they are submerged, leading to social disruption, displacement and migration. Also, disagreement over maritime boundaries and ocean resources may increase.
    • As per IPCC 5th assessment report sea level rise can be 52-98 cm by 2100.
  • Unintended effects of climate change: As the climate adaptation and mitigation policies are more broadly implemented, the risks of unintended negative effects-particularly in fragile regions will also increase. In countries with poor institutional capacity and governance, this may lead to immense political pressure and ultimately civil war.

Reason for support of UNSC intervention | UPSC IAS

  • If the UNSC declares the impacts of climate change an international threat then military and non-military sanctions could be invoked.
  • The sanctions would be available to the council in the event of states not meeting their Paris Agreement obligations. Economic sanctions could also be placed upon corporations that currently operate with relatively little international scrutiny.
  • Supporters of such declaration cites slow and ineffective progress of climate negotiations (under UNFCCC) and demand a rapid response to decreasing GHG emissions to stop temperature rise below 2°C. It’ll bring element of coercion in climate agreements.
  • These measures could include the deployment of peacekeeping forces and increased humanitarian assistance surrounding direct and indirect climate induced crises.

National Clean Air Programme (NCAP) | UPSC – IAS

National Clean Air Programme (NCAP) UPSC IAS Gk today UPPCS

National Clean Air Programme (NCAP) UPSC IAS Gk today UPPCS

What is National Clean Air Programme (NCAP) ? | UPSC – IAS

  • It is a pollution control initiative to cut the concentration of particles (PM10 & PM2.5) by 20-30% by 2024.
  • It will have 2017 as the base year for comparison and 2019 as the first year.
  • It is to be implemented in 102 non-attainment cities. These cities are chosen on the basis of Ambient Air Quality India (2011-2015) and WHO report 2014/2018.
  • National Clean Air Programme (NCAP) was recently launched by – Ministry of Environment, Forest and Climate Change (MoEFCC).

Its objectives include-

  • Stringent implementation of mitigation measures for prevention, control and abatement of air pollution;
  • Augment and strengthen air quality monitoring network across the country;
  • Augment public awareness and capacity building measures.

Significance of National Clean Air Programme (NCAP) | UPSC IAS

  • First such effort – Framing a national framework for air quality management with a time-bound reduction target. The biggest advantage of such targets is that it helps decide the level of severity of local and regional action needed for the plans to be effective enough to meet the reduction targets.
  • Multisectoral Collaboration and Participatory approach – covering all sources of pollution and coordination between relevant Central ministries, state governments, local bodies and other stakeholders.
  • All-inclusive approach – It has tried to incorporate measures for urban as well as rural areas. Further, NCAP identifies the trans-boundary nature of air pollution and thus specifically assigns transboundary strategies in managing the air pollution in the country.
  • Linking Health and Pollution: NCAP has now taken on board the National Health Environmental Profile of 20 cities that the MoEF&CC initiated along with the Indian Council of Medical Research with special focus on air pollution and health. It has asked the Ministry of Health and Family Welfare to maintain health database and integrate that with decision making.

Implementation of National Clean Air Programme (NCAP) | UPSC IAS

  • The Central Pollution Control Board (CPCB) shall execute the nation-wide programme for the prevention, control, and abatement of air pollution within the framework of the NCAP.
  • The NCAP will be institutionalized by respective ministries and will be organized through inter-sectoral groups, which include, Ministry of Road Transport and Highway, Ministry of Petroleum and Natural Gas, Ministry of New and Renewable Energy, Ministry of Heavy Industry, Ministry of Housing and Urban Affairs, Ministry of Agriculture, Ministry of Health, NITI Aayog, CPCB, experts from the industry, academia, and civil society.
  • The program will partner with multilateral and bilateral international organizations, philanthropic foundations and leading technical institutions to achieve its outcomes.
  • The Apex Committee in the MoEFCC will periodically review the progress. Annual performance will be periodically reported upon. Appropriate indicators will be evolved for assessing the emission reduction benefits of the actions.

National Clean Air Programme (NCAP) UPSC IAS

Components of National Clean Air Programme (NCAP) | UPSC IAS

(National Clean Air Programme (NCAP) has 3 components)

Mitigation Actions: NCAP details seven mitigation actions.

  • Web-based, three-tier mechanism – to review, monitor, assess and inspect to avoid any form of non-compliance. The system will work independently under the supervision of a single authority, which will ensure accreditation of three independently operating entities.
  • Extensive Plantation Drive: Plantation initiatives under NCAP at pollution hot spots in the cities/towns will be undertaken under the National Mission for Green India (GIM) with Compensatory Afforestation Fund (CAF) being managed by National Compensatory Afforestation Management and Planning Authority (CAMPA).
  • Technology Support: Clean Technologies with potential for air pollution prevention and mitigation will be supported for R&D, pilot scale demonstration and field scale implementation.
  • Regional and Transboundary Plan: These have major role for effective control of pollution more specifically with reference to the Indo-Gangetic plain. Air quality management at South-Asia regional level by activating the initiatives under ‘Male Declaration on Control and Prevention of Air Pollution and its Likely Transboundary Effects for South Asia’ and South Asia Cooperative Environment Programme (SACEP) to be explored.
  • Sectoral Interventions: This includes sectors such as e-mobility, power sector emissions, indoor air pollution, waste management, industrial and agricultural emissions and dust management.
  • City Specific Air Quality Management Plan for 102 Non-Attainment Cities: based on comprehensive science-based approach, involving meteorological conditions and source apportionment studies.
    • A separate emergency action plan in line with Graded Response Action Plan for Delhi will be formulated for each city for addressing the severe and emergency AQIs.
    • Further, the state capitals and cities with a population more than a million may be taken up on priority for implementation.
  • State Government’s participation is not limited for evolving an effective implementation strategy but also in exploring detailed funding mechanism.

Knowledge and Database Augmentation | UPSC IAS

  • Air Quality Monitoring Network which also includes setting rural monitoring network, 10 city super network (overall air quality dynamics of the nation, impact of interventions, trends, investigative measurements, etc)
  • Extending Source apportionment studies to all Non-Attainment cities: This will help in prioritising the sources of pollution and formulation and implementation of most appropriate action plans. A unified guideline for source apportionment study will be formulated and updated by the Centre.
  • Air Pollution Health and Economic Impact Studies: Under NCAP studies on health and economic impact of air pollution to be supported. Framework for monthly analysis of data w.r.t health to be created.
  • International Cooperation including Sharing of International Best Practices on Air Pollution.
  • Review of Ambient Air Quality Standards and Emission Standards: The existing standards need to be strengthened periodically and new standards need to be formulated for the sources where standards are not available.
  • National Emission Inventory: This will be formalized under the NCAP. Its significance is in tracking progress towards emission reduction targets and as inputs to air quality model.

Institutional Strengthening | UPSC IAS

  • Institutional Framework: It involves a National Apex Committee at the MoEF&CC and State-level Apex Committee under the chief secretaries in various states. There are various other institutions being envisaged such as Technical Expert Committee and National-level Project Monitoring Unit (PMU) at the MoEF&CC and National-level Project Implementation Unit (PIU) at the CPCB.
  • Public Awareness and Education: through national portals, media engagement, civil society involvement, etc.
  • Training and Capacity Building: NCAP identifies lack of capacity on air quality issues due to limited manpower and infrastructure in the CPCB and SPCBs, lack of formal training for various associated stakeholders etc. as one of the major hurdle in an effective implementation of air pollution management plans.
  • Setting up Air Information Centre: which will be responsible for creating a dashboard, data analysis, interpretation, dissemination. This may be set up with the assistance of the IITs, IIMs.
  • Operationalize the NPL-India Certification Scheme (NPL-ICS) for certification of monitoring instrument. It will help to cater to the country’s needs with respect to the online monitoring of air pollution. The proposed certification scheme will have three major components i.e. NPL-India Certification body (NICB), certification committee, and testing and calibration facility.
  • Air-Quality Forecasting System (AQFS): as a state-of-the-art modelling system, it will forecast the following day’s air quality. The satellite data available through ISRO to be integrated for monitoring and forecasting under the NCAP.
  • Network of Technical Institutions- Knowledge Partners: Dedicated air pollution units will be supported in the universities, organizations, and institutions and a network of highly qualified and experienced academicians, academic administrators, and technical institutions will be created.
  • Technology Assessment Cell (TAC): It will evaluate significant technologies with reference to prevention, control, and abatement of pollution. Technology induction/ transfer would be facilitated, where necessary, with time bound goals for indigenization and local manufacturing.o The TAC will be created involving the IITs, IIMs, the major universities, industries, and using the existing mechanisms and programme of the Department of Science & Technology, India Innovation Hub, etc.

Natural Gas Hydrates in India | UPSC – IAS

Natural Gas Hydrates in India UPSC - IAS Science and Tech Gk today

Natural Gas Hydrates in India  UPSC - IAS  Science and Tech Gk today

Natural Gas Hydrates in India | UPSC – IAS | Science and Tech

Researchers at Indian Institute of Technology (IIT) Madras have experimentally shown that methane and carbon dioxide (CO2) can exist as gas hydrates.

What are Gas hydrates? | UPSC – IAS | PCS

  • They are formed when a gas such as methane gets trapped in well-defined cages of water molecules forming crystalline solids. It is a solid ice-like form of water that contains gas molecules in its molecular cavities.
  • Natural gas hydrates occur on continental margins and shelves worldwide from Polar Regions to the tropics.
  • Gas hydrate reservoirs are generally associated with biologically rich cold seep ecosystems at the seafloor. Cold seeps are locations where hydrocarbon-rich fluid seeps up from below the seafloor, often as methane or hydrogen sulfide.
  • It is estimated that total amount of carbon in the form of methane hydrates, far exceeds the carbon content in all the fossil fuel reserves put together and hence these are supposed to be the future potential energy resource.
  • Combustion of methane, is more CO2 efficient than that of any other hydrocarbon. Hence, using methane from gas hydrate compared to other hydrocarbons is relatively climate friendly.
  • According to the latest estimates of the US Geological Survey, India has the second largest gas hydrate reserves after America. The Krishna-Godavari (KG), Cauvery and Kerala basins alone have 100-130 trillion cubic feet of estimated reserves.
  • The carbon dioxide hydrate produced in the lab by the IIT team raises the possibility of sequestering or storing carbon dioxide as hydrates under the sea bed.

Extraction of Gas Hydrates: The natural gas from gas hydrate can be produced via:-

  • Depressurization: Drilling of hole into the layer of hydrate and reducing the pressure beneath. This technique is implemented for hydrates only in polar regions beneath the permafrost.
  • Thermal stimulation: via steam injection, hot brine solution etc. that raises the temperature of the local reservoir outside the hydrate region to cause the dissociation of the hydrate, thus releasing free gas which can be collected.

However, no country in the world has so far developed the technology to produce gas hydrates commercially and economically.

Issues with Gas Hydrates Extraction | UPSC – IAS

Gas hydrates are also important for seafloor stability studies, because “melting” gas hydrate may cause seafloor “landslides”. Methane released from gas hydrate may therefore play a significant role in climate change.

Indian Initiative| UPSC – IAS | PCS

  • The National Gas Hydrate Programme (NGHP) is of national importance considering India’s phenomenal growing energy demand. The programme was initiated in 1997. It first conducted studies in 2006.
  • India has entered into an agreement with Canada to develop technology in this regard.
  • IIT Madras, in collaboration with GAIL, is working to recover methane from methane hydrate from the Krishna-Godavari Basin and sequester CO2 simultaneously.

Origin and Interior of the earth and Age of Earth | UPSC IAS

UPSC IAS Geology Optional

Origin and Interior of the earth and Age of Earth | UPSC – IAS

Origin of Earth and Universe

The origin of Earth, and indeed of the universe, is incompletely understood. It is generally accepted that the universe began with a cosmic event called the big bang. The most widely held view is that the big bang took place some 13.7 billion years ago – similar to the age of the oldest known stars.

  • The big bang began in a fraction of a second as an infinitely dense and infinitesimally small bundle of energy containing all of space and time started to expand away in all directions at extraordinary speeds, pushing out the fabric of space and filling the universe with the energy and matter we see today.
  • Origin of Our solar system originated between 4.5 and 5 billion years ago when a nebula – a huge, cold, diffuse cloud of gas and dust – began to contract inward, owing to its own gravitational collapse, forming a hot, dense protostar.
  • This hot center “our Sun” was surrounded by a cold, revolving disk of gas and dust that eventually condensed and coalesced to form the planets.

birth of the solar system. UPSC IAS PCS UPPCS gk today

Image ExplanationThe origin of the solar system. (1) Diffuse gas cloud, or nebula, begins to contract inward. (2) Cloud flattens into nebular disk as it spins faster around a central axis. (3) Particles in the outer parts of the disk collide with each other to form protoplanets. (4) Protoplanets coalesce into planets and settle into orbits around the hot center. (5) The final product: a central Sun surrounded by eight orbiting planets (solar system not shown in correct scale). The original nebular disk was much larger than our final solar system.

All of the planets revolve around the Sun in elliptical orbits, with the Sun located at one focus (looking “down” on the solar system from a vantage point high above the North Pole of Earth, the planets appear to orbit in a counterclockwise direction around the Sun).

  • All the planetary orbits are in nearly the same plane, perhaps revealing their relationship to the original spinning direction of the nebular disk. The Sun rotates on its axis from west to east.
  • Moreover, most of the planets rotate from west to east on their own axes (Uranus rotates “sideways” with its rotational axis almost parallel to its orbital plane; Venus rotates from east to west). The planets revolve more slowly and generally have a lower temperature as their distance from the Sun increases.

The structure of the Milky Way Galaxy UPSC IAS Gk today PCS UPPCSImage Explanation – The structure of the Milky Way Galaxy showing the approximate location of our Sun on one of the spiral arms.

The Planets – Inner and Outer | UPSC – IAS

Inner Planets

  • The four inner terrestrial planets  Mercury, Venus, Earth, and Mars  – are generally smaller, denser, and less oblate (more nearly spherical), and
  • They rotate more slowly on their axes than the four outer Jovian planets – Jupiter, Saturn, Uranus, and Neptune. Also, the inner planets are composed principally of mineral matter and, except for airless Mercury, have diverse but relatively shallow atmospheres.

Outer planets or Jovian Planets or Giant Planets 

By contrast, the four Jovian planets tend to be much larger, more massive (although they are less dense), and much more oblate (less perfectly spherical) because they rotate more rapidly. The Jovian planets are mostly composed of elements such as hydrogen and helium – liquid near the surface, but frozen toward the interior – as well as ices of compounds such as methane and ammonia.

The Jovian planets generally have atmospheres that are dense, turbulent, and relatively deep. It was long thought that tiny Pluto was the ninth and outermost planet in the solar system.

  • In recent years, however, astronomers have discovered other icy bodies, such as distant Eris, Makemake, and Haumea that are similar to Pluto and orbiting the Sun beyond Neptune in what is referred to as the Kuiper Belt or trans-Neptunian region.
  • In June 2008 the International Astronomical Union reclassified Pluto as a special type of dwarf planet known as a plutoid. Some astronomers speculate that there may be several dozen yet-to-be-discovered plutoids and other dwarf planets in the outer reaches of the solar system.

The Size and Shape of Earth | UPSC – IAS

Is Earth large or small? The answer to this question depends on one’s frame of reference. If the frame of reference is the universe, Earth is almost infinitely small.

The diameter of our planet is only about 13,000 kilometers (7900 miles), a tiny distance at the scale of the universe – For instance – The Moon is 385,000 kilometers (239,000 miles) from Earth, The Sun is 150,000,000 kilometers (93,000,000 miles) away, and the nearest star is 40,000,000,000,000 kilometers (25,000,000,000,000 miles) distant.

Size of the earth UPSC IAS PCS UPPCS UPPSC Gk today

Image Explanation: Earth is large relative to the size of its surface features. Earth’s maximum relief (the difference in elevation between the highest and lowest points) is 19,883 meters (65,233 feet) or about 20 kilometers (12 miles) from the top of Mount Everest to the bottom of the Mariana Trench in the Pacific Ocean.

The Size of Earth | UPSC – IAS

In a human frame of reference, however, Earth is impressive in size. Its surface varies in elevation from the highest mountain peak, Mount Everest, at 8850 meters (29,035 feet) above sea level, to the deepest oceanic trench, the Mariana Trench of the Pacific Ocean, at 11,033 meters (36,198 feet) below sea level, a total difference in elevation of 19,883 meters (65,233 feet).

Although prominent on a human scale of perception, this difference is minor on a planetary scale. If Earth were the size of a basketball, Mount Everest would be an imperceptible pimple no greater than 0.17 millimeter (about 7 thousandths of an inch) high.

Similarly, the Mariana Trench would be a tiny crease only 0.21 millimeter (about 8 thousandths of an inch) deep— this represents a depression smaller than the thickness of a sheet of paper.

  • Our perception of the relative size of topographic irregularities on Earth is often distorted by three-dimensional wall maps and globes that emphasize such landforms.  To portray any noticeable appearance of topographic variation, the vertical distances on such maps are usually exaggerated 8 to 20 times their actual proportional dimensions – as are many diagrams used in this book. Further, many diagrams illustrating features of the atmosphere also exaggerate relative sizes to convey important concepts.
  • More than 2600 years ago Greek scholars correctly reasoned Earth to have a spherical shape. About 2200 years ago, Eratosthenes, the director of the Greek library at Alexandria, calculated the circumference of Earth trigonometrically. He determined the angle of the noon Sun rays at Alexandria and at the city of Syene, 960 kilometers (600 miles) away. From these angular and linear distances he was able to estimate an Earth circumference of almost 43,000 kilometers (26,700 miles) which is reasonably close to the actual figure of 40,000 kilometers (24,900 miles).

The Shape of Earth | UPSC – IAS 

  • Earth is almost, but not quite, spherical. The cross section revealed by a cut through the equator would be circular, but a similar cut from pole to pole would be an ellipse rather than a circle. Any rotating body has a tendency to bulge around its equator and flatten at the polar ends of its rotational axis.  Although the rocks of Earth may seem quite rigid and immovable to us, they are sufficiently pliable to allow Earth to develop a bulge around its middle.
  • The slightly flattened polar diameter of Earth is 12,714 kilometers (7900 miles), whereas the slightly bulging equatorial diameter is 12,756 kilometers (7926 miles), a difference of only about 0.3 percent. Thus, our planet is properly described as an oblate spheroid rather than a true sphere. However, because this variation from true sphericity is exceedingly small, in most cases in this book we will treat Earth as if it were a perfect sphere.

Read – Earth’s Interior- Crust, Mantle and Core 

Physical conditions of the Earth’s Interior- Crust, Mantle and Core | UPSC

Physical conditions of the Earth’s Interior- Crust, Mantle and Core | UPSC IAS PCS Gk today

THE STRUCTURE OF EARTH | UPSC – IAS | Geography Optional

Physical conditions of the Earth’s Interior | UPSC – IAS

Our knowledge of the Earth’s Interior is based largely on indirect evidence. No human activity has explored more than a minute fraction of the vastness beneath the surface. No one has penetrated as much as one-thousandth of the radial distance from the surface to the center of Earth;

  • The deepest existing mine shaft extends a mere 3.8 kilometers (2.4 miles). Nor have probes extended much deeper;
  • The deepest drill holes from which sample cores have been brought up have penetrated only a modest 12 kilometers (8 miles) into Earth.

Physical conditions of the Earth’s Interior- Crust, Mantle and Core | UPSC IAS PCS Gk today

Image Explanation – The vertical structure of Earth’s interior. (a) Below the thin outer crust of Earth is the broad zone of the mantle, and below the mantle are the liquid outer core and the solid inner core. (b) Idealized cross section through Earth’s crust and part of the mantle. The crust and uppermost mantle, both rigid zones, are together called the lithosphere—the “plates” of plate tectonics. In the asthenosphere, the mantle is hot and therefore weak and easily deformed. In the lower mantle, the rock is generally rigid again.

Earth scientists, in the colorful imagery of writer John McPhee, “are like dermatologists: they study, for the most part, the outermost two per cent of the earth. They crawl around like fleas on the world’s tough hide, exploring every wrinkle and crease, and try to figure out what makes the animal move.

  • Even so, a considerable body of inferential knowledge concerning Earth’s interior has been amassed by geophysical means, primarily by monitoring patterns of vibrations transmitted through Earth from earthquakes or from human made explosions.
  • Such seismic waves change their speed and direction whenever they cross a boundary from one type of material to another. Analysis of these changes, augmented by related data on Earth’s magnetism and gravitational attraction, has enabled Earth scientists to develop a model of Earth’s internal structure.

Earth’s Hot Interior | UPSC – IAS

In general, temperature and pressure increase with depth inside Earth, with the highest temperatures and pressures at the center.

  • The source of this warmth is largely from the release of energy from the decay of radioactive elements (in much the same way as the decay of radioactive material supplies the warmth to power a nuclear power plant).
  • As we will see, it is the transfer of heat from Earth’s interior that drives many Earth processes such as plate tectonics and volcanism

 Earth’s Interior – The Crust | UPSC – IAS

The crust, the outermost shell, consists of a broad mixture of rock types. Beneath the oceans the crust has an average thickness of only about 7 kilometers (4 miles), whereas beneath the continents the thickness averages more than five times as much, and in places exceeds 70 kilometers (40 miles).

  • Oceanic crust is thinner but is comprised of denser (“heavier”) rocks than continental crust. In general within the crust there is a gradual increase in density with depth. Altogether, the crust makes up less than 1 percent of Earth’s volume and about 0.4 percent of Earth’s mass.
  • At the base of the crust there is a significant change in mineral composition. This relatively narrow zone of change is called the Mohorovicˇic´ discontinuity, or simply the Moho for short, named for the Yugoslavian seismologist Andrija Mohorovicˇic´ (1857–1936) who discovered it.

 Earth’s Interior – The Mantle | UPSC – IAS

Beneath the Moho is the mantle, which extends downward to a depth of approximately 2900 kilometers (1800 miles). In terms of volume, the mantle is by far the largest of the four layers. Although its depth is only about one half the distance from the surface to the center of Earth, its location on the periphery of the sphere gives it a vast breadth. It makes up 84 percent of the total volume of Earth and about two-thirds of Earth’s total mass. There are three sublayers within the mantle, as Image shows.

  • The uppermost zone is relatively thin but hard and rigid, extending down to a depth of 65 to 100 kilometers (40 to 60 miles)—somewhat deeper under the continents than under the ocean floors. This uppermost mantle zone together with the overlying oceanic or continental crust is called the lithosphere.  “lithosphere” refers specifically to the combination of the crust and upper rigid mantle—and as we’ll see shortly, it is large pieces of the lithosphere that are the “plates” of plate tectonics. Beneath the rigid layer of the lithosphere, and extending downward to a depth of as much as 350 kilometers (200 miles), is a mantle zone in which the rocks are hot enough that they lose much of their strength and become “plastic”—they are easily deformed, somewhat like tar. This is called the asthenosphere (“weak sphere”). Below the asthenosphere is the lower mantle, where the rocks are very hot, but largely rigid again because of higher pressures.

 Earth’s Interior – The Inner and Outer Cores | UPSC – IAS

  • Beneath the mantle is the outer core (Image), thought to be molten (liquid) and extending to a depth of about 5000 kilometers (3100 miles). The innermost portion of Earth is the inner core, an evidently solid (because of extremely high pressure) and very dense mass having a radius of about 1450 kilometers (900 miles). Both the inner and outer cores are thought to be made of iron/nickel or iron/silicate.
  • These two zones together make up about 15 percent of Earth’s volume and 32 percent of its mass. A common misconception is that the liquid outer core of Earth is the source of molten rock (“magma” and “lava”) that is expelled by volcanoes, but this is not the case.
  • Instead, the near-surface mantle is the source for magma, while Earth’s cores are the source of energy that drives the slow movement of hot rock through the mantle toward the surface (through the process of convection).
  • This rising hot rock in the mantle is under so much pressure that it remains essentially solid— only when this rising mantle material is very close to the surface is pressure low enough for it to melt.

 Earth’s Interior – Earth’s Magnetic Field | UPSC – IAS

Earth’s magnetic field is generated in the outer core: convective circulation within the conductive liquid iron and nickel outer core, spiraling in line with Earth’s rotational axis, induces the magnetic field of our planet through what is sometimes called a geodynamo.

  • Interestingly, the strength and orientation of the magnetic field changes over time, and the location of the north magnetic pole does not exactly match the true geographic North Pole.
  • The position of the north magnetic pole slowly but continually drifts several tens of kilometers each year—it is currently located at about 86° N, 147° W – but the position of the north magnetic pole can even change significantly during a single day!
  • In addition, for reasons that are not completely understood, at irregular intervals of thousands to millions of years, the polarity of Earth’s magnetic field reverses, with the north magnetic pole becoming the south. A record of these magnetic polarity reversals has been recorded in the iron rich rocks of the ocean floor.

Great Indian bustard (Ardeotis Nigriceps) – Population Fall | UPSC IAS

Great Indian bustard (Ardeotis Nigriceps) - Population Fall UPSC IAS

Great Indian bustard (Ardeotis Nigriceps) - Population Fall  UPSC IAS

Great Indian bustard (Ardeotis Nigriceps) – Population Fall | UPSC – IAS

A recent study suggests that, Great Indian Bustard population has been falling continuously, from around 1,260 in 1969 to less than 200 in 2018.

About Great Indian bustard (Ardeotis Nigriceps)

  • It’s among the heaviest bird with a horizontal body and long bare legs giving it an ostrich like appearance.
  • Habitat: Arid and semi-arid grasslands, open country with thorn scrub, tall grass interspersed with cultivation. It avoids irrigated areas.
  • Currently, it is found in only six states in the country –
    • Madhya Pradesh,
    • Gujarat,
    • Maharashtra,
    • Andhra Pradesh,
    • Rajasthan and
    • Karnataka.
  • It is endemic to Indian Sub-continent, found in central India, western India and eastern Pakistan.
  • Protection: Listed in Schedule I of the Wildlife (Protection) Act, 1972 and Critically Endangered on the IUCN Red List
  • It is also listed in Appendix I of CITES and covered under CMS or Bonn Convention.
  • Bustard Species Found In India: Great Indian Bustard, the Lesser Florican and the Bengal Florican; Houbara also belong to Bustard family but it’s a migratory species.
  • Importance to Ecosystem: GIB is an indicator species for grassland habitats and its gradual disappearance from such environments shows their deterioration.
  • Once the species is lost, there will be no other species to replace it, and that will destabilise the ecosystem of the grassland and affect critical bio-diversities, as well as blackbucks and wolves, who share their habitat with the GIB.
  • Threat: Hunting, poaching, habitat erosion, ‘greening’ projects that transform arid grasslands to wooded areas, change of land use from grassland to farmland, collisions with high tension electric wires, fast moving vehicles and free-ranging dogs in villages

Great Indian bustard (Ardeotis Nigriceps) - Population Fall | UPSC IAS PIB PCS UPPCS UPPSC the Hindu

Conservation Steps:

Great Indian Bustard, popularly known as ‘Godawan’, is Rajasthan’s state bird. The state government has started “Project Godawan” for its conservation at Desert National Park (DNP) in Jaisalmer. It’s one of the Species for The Recovery Programme under the Integrated Development of Wildlife Habitats of the Ministry of Environment and Forests.

Integrated Development of Wildlife Habitats | UPSC – IAS

It is a Centrally Sponsored Scheme where GoI provides financial and technical assistance to the State/UT Governments for activities aimed at wildlife conservation. The scheme has three components viz- Support to Protected Areas (National Parks, Wildlife Sanctuaries, Conservation Reserves and Community Reserves), Protection of Wildlife Outside Protected Area and Recovery programmes for saving critically endangered species and habitats.

Great Indian bustard (Ardeotis Nigriceps) Recovery Programme

  • It recommends linking local livelihoods with bustard conservation
  • A profitable and equitable mechanism to share revenues generated from ecotourism with local communities should be developed
  • For effective conservation, the guidelines direct state governments to identify the core breeding areas for bustards and keep them inviolate from human disturbances
  • The guidelines suggest restriction on infrastructure development and land use diversion for roads, high tension electric poles, intensive agriculture, wind power generators and construction
  • Only low intensity, traditional pastoral activities should be allowed, that too, not during the breeding season, say the guidelines

Convention on the Conservation of Migratory Species of Wild Animals (CMS) or Bonn convention

  • It is the only convention under UNEP which provides a global platform for the conservation and sustainable use of migratory animals and their habitats ( and their migration routes). India is a member of the convention.
  • Migratory species threatened with extinction are listed on Appendix I of the Convention.

Wildlife Protection Tiger Conservation Project – Analysis | UPSC IAS

Wildlife Protection Tiger Conservation Project - Analysis UPSC IAS UPPCS SSC THe hindu PIB

tiger reserves in india Map location state wise UPSC IAS PIB PCS UPPCS UPPSC

Recently a new study by World Wide Fund for Nature (WWF) found that under optimal conditions, tiger numbers can triple in 18 sites across the world, including eight in India.

  • Another study by researchers has found Royal Bengal Tiger in the snow-capped regions of the Eastern Himalaya at an altitude of more than 4,000m in Dibang valley of Arunachal Pradesh.
    More on News
  • This new assessment could guide planning for tiger recovery globally and help inform more effective, integrated approaches to tiger conservation.
  • The presence of the big cats in Dibang valley which is not even a tiger reserve is a tribute to the ways the people there have been coexisting with the animals.
    Threats to Tiger Population in India

Important Facts Wildlife Protection Tiger Conservation Project  | UPSC – IAS | PCS | PIB

  • Indian Tiger or Royal Bengal Tiger (Panthera tigris) is the sub species found in India.
  • Conservation status of Tiger
    • IUCN Red List: Endangered
    • Wild life protection Act : Schedule 1
    • CITES: Appendix 1
  • The tiger reserves are constituted on a core/buffer strategy. The core areas have the legal status of a national park or a sanctuary. The buffer or peripheral areas are a mix of forest and non-forest land, managed as a multiple use area.
  • India is home to 70 per cent of global tiger population.
  • The tigers are an “umbrella” species as by rescuing them, we save everything beneath their ecological umbrella – everything connected to them.
  • Highest number of tigers are in Karnataka followed by Uttarakhand

Habitat loss | UPSC – IAS | PCS | PIB

  • Industrial Development has led to increased pressure on their natural habitat due to increased deforestation.
  • Forest fires and floods leading to habitat loss also continue to pose a threat to their survival.
  • National Highways often run through the tiger reserves which in turn lead to habitat fragmentation.
  • Poaching: Tigers have been illegally hunted due to their demand in traditional Chinese medicines, decorative works, etc.
  • Man-Animal conflict: Growing incidents of human–tiger conflict protected also pose significant challenge.
  • Inbreeding of the tiger species is also a major concern as inbred animals are prone to acquiring crippling defects, lack of capacity to adapt and psychological issues.

Conservation Efforts in India | UPSC – IAS | PCS | PIB

  • Project Tiger: The Government of India launched the centrally Sponsored Scheme the ‘Project Tiger’ in 1973 for for in-situ conservation of wild tigers in designated tiger reserves. The Project Tiger coverage has increased to 50 tiger reserves at present.
  • The National Tiger Conservation Authority (NTCA): It is a statutory body established in 2006 under MoEFCC performing functions as provided in the Wildlife (Protection) Act, 1972. Presently It implements major tiger conservation initiatives like project tiger, Tiger conservation plan etc.
  • Monitoring System for Tigers – Intensive Protection and Ecological Status (M-STrIPES): It is a software-based monitoring system launched across Indian tiger reserves by the NTCA.
    Global Conservation Efforts
  • The Global Tiger Initiative (GTI): It was launched in 2008 as a global alliance of governments, international organizations, civil society, the conservation and scientific communities and the private sector and includes organization like the World Bank, the Global Environment Facility (GEF), etc. It aims to work together to save wild tigers from extinction. In 2013, the scope was broadened to include Snow Leopards. The initiative is led by the 13 tiger range countries (Bangladesh, Bhutan, Cambodia, China, India, Indonesia, Lao PDR, Malaysia, Myanmar, Nepal, Russia, Thailand, and Vietnam).
  • The Global Tiger Forum (GTF) is the only inter- governmental international body established with members from willing countries to embark on a global campaign to protect the Tiger.
  • TX2: In 2010, the St. Petersburg Declaration on Tiger Conservation was adopted under the GTI and the Global Tiger Recovery Programme or TX2 was endorsed. Its goal was to double the number of wild tigers across their geographical areas. The WWF is implementing the programme in 13 tiger range countries.
  • Conservation Assured Tiger Standards CA|TS: It is a new tool for tiger conservation management. It is a set of criteria which allows tiger sites to check if their management will lead to successful tiger conservation. It is an important part of Tx2 programme.

Way Forward | UPSC – IAS | PCS | PIB

  • Awareness: Awareness about tiger conservation through discussions, exhibitions and local campaigns, etc should be spread.
  • Strengthening monitoring activities by authorities is a crucial element in tiger conservation. Improving the intelligence and information sharing mechanism is a major aspect in this regard. Drones can also be widely used for monitoring.
  • Stopping Illegal trade: Items prepared from tiger killed must be tackled as it effectively fuels the poaching process.
  • Involving Local communities: Peaceful coexistence with voluntarily participation of the local communities is a must. For example villagers must be instantaneously compensated for their cattle loss or crop damage due to tiger and other wildlife activities.
  • Relocation of tigers: It should be done in a well-planned manner else there is a high chance of losing the animal. This can also help to prevent inbreeding of the tiger species and thus increase the viability of the tiger population.

Seabed 2030 Project – Bathymetric data map of Ocean Floor | UPSC – IAS

Seabed 2030 Project - Bathymetric data map of Ocean Floor UPSC - IAS PCS PIB the HIndu UPPCS UPPSC BPSC

Seabed 2030 Project - Bathymetric data map of Ocean Floor UPSC - IAS PCS PIB the HIndu UPPCS UPPSC BPSC

Seabed 2030 Project – Bathymetric data map of Ocean Floor | UPSC – IAS

The U.N.-backed project Seabed 2030 is pooling data from the countries and companies to create a map of the entire ocean floor.

About Seabed 2030 Project | UPSC – IAS

  • It aims to bring together all available bathymetric data (measures of depth and shape of the seafloor) to
    produce the definitive map of the world ocean floor by 2030 and make it available to all.
  • It is a collaborative project between the Nippon Foundation and General Bathymetric Chart of the Oceans (GEBCO).
  • The project was launched at the United Nations (UN) Ocean Conference in June 2017 and is aligned with the UN’s Sustainable Development Goal #14 to conserve and sustainably use the oceans, seas and marine resources.
  • Central to the Seabed 2030 strategy is the creation of Regional Data Assembly and Coordination Centres (RDACCs), with each having a defined ocean region of responsibility. A board will be established for each region consisting of local experts to identify existing bathymetric data, and to help coordinate new bathymetric surveys.

Significance Seabed Mapping Project | UPSC – IAS

  • Bathymetric data from the deep ocean is critical for studying marine geology and geophysics. For example, Bathymetric data obtained in 1950s and ‘60s led to modern understanding of Plate tectonics.
  • The shape of the seabed is a crucial parameter for understanding ocean circulation patterns as well as an important variable for accurately forecasting tsunami wave propagation.
  • Bathymetric data illuminates the study of tides, wave action, sediment transport, underwater geo—hazards, cable routing, resource exploration, extension of continental shelf (UN Law of the Sea treaty issues), military and defence applications.
  • In coastal regions, bathymetry underpins marine and maritime spatial planning and decision-making, navigation safety, and provides a scientific basis for models of storm surges, while also informing our understanding of marine ecosystems and habitats.
  • Detailed knowledge of bathymetry is a fundamental prerequisite for attaining an improved understanding of the subsea processes.

Challenges | UPSC – IAS

  • Even using the RDACC model, the goal of mapping the entire world ocean is a significant challenge, and can only be accomplished if new field mapping projects are initiated.
  • Crowdsourcing bathymetric data from fishing vessels and recreational small boats etc. represents one approach for gathering information in shallower water regions, but is less efficient in deeper waters due to depth limitations of standard echo sounders.
  • Deep water mapping remains a major challenge due to the cost involved and the limited number of available research vessels that are equipped with modern deep, water multibeam sonars.

A Way forward | UPSC – IAS

  • Reach out to the national and international funding agencies, to get adequate funding to support Seabed 2030 vision.
  • Keeping up with technology overtime to make sure that processes, products and services are forward looking and well-positioned to make use of new technologies as they become available.
  • Given the sheer size of the ocean the Seabed 2030 goals can only be achieved through international coordination and collaboration with respect to data acquisition, assimilation and compilation.

Coastal Regulation Zone (CRZ), 2018 – An Analysis | UPSC – IAS

Coastal Regulation Zone (CRZ), 2018 - An Analysis UPSC - IAS


Coastal Regulation Zone (CRZ), 2018 - An Analysis  UPSC - IAS

Coastal Regulation Zone (CRZ), 2018 – An Analysis | UPSC – IAS

To conserve and protect the coastal environment, and to promote sustainable development based on scientific principles Ministry of Environment and Forest and Climate Change (MoEFCC), under the Environment (Protection) Act, 1986, notified the CRZ Notification in 1991, subsequently revised in 2011. CRZ helps in reducing the ecological vulnerability through regulated activities in ecologically most sensitive areas (CRZ-I A):-

  • Regulate activities such as Eco-tourism subject to approved Coastal Zone Management Plans(CZMPs), exceptional construction of public utilities in the mangrove buffer etc.
  • Construction of roads and roads on stilts, by way of reclamation shall be permitted only in exceptional cases for defence, strategic purposes and public utilities, subject to a detailed marine/terrestrial environment impact assessment, to be recommended by the Coastal Zone Management Authority and approved by the MoEFCC.
  • Compensatory plantation of mangroves (Minimum three times the mangrove area affected/destroyed/ cut).

Areas requiring special consideration in the CRZ

  • Critically Vulnerable Coastal Areas (CVCA): Sunderban region of West Bengal and other ecologically sensitive areas identified as under Environment (Protection) Act, 1986 such as Gulf of Khambat and Gulf of Kutchchh in Gujarat, Malvan, Achra-Ratnagiri in Maharashtra, Karwar and Coondapur in Karnataka, Vembanad in Kerala, Gulf of Mannar in Tamil Nadu, Bhaitarkanika in Odisha, Coringa, East Godavari and Krishna in Andhra Pradesh shall be treated as CVCA and managed with the involvement of coastal communities including fisher folk who depend on coastal resources for their sustainable livelihood.
  • CRZ for inland Backwater islands and islands along the mainland coast.
  • CRZ falling within municipal limits of Greater Mumbai.

Salient Features of Coastal Regulation Zone (CRZ), 2018 Notification

  • Easing FSI norms: This notification de-freezes the restrictions imposed on Floor Space Index (FSI) or the Floor Area Ratio (FAR) under CRZ, 2011 in accordance to 1991 Development Control Regulation (DCR) levels.
  • No development zone (NDZ) reduced for densely populated areas: For CRZ-III areas
    • CRZ-III A areas shall have a NDZ of 50 meters from the HTL on the landward side as against 200 meters from the HTL stipulated in the CRZ Notification, 2011.
    • CRZ-III B areas shall continue to have an NDZ of 200 meters from the HTL.
  • Tourism infrastructure for basic amenities to be promoted: The notification allows for temporary tourism facilities such as shacks, toilet blocks, change rooms, drinking water facilities etc on beaches at a minimum distance of 10 metres from HTL. Such temporary tourism facilities are also now permissible in the NDZ of the CRZ-III areas.
  • CRZ Clearances streamlined:
    • CRZ clearances are needed only for projects located in CRZ-I and CRZ IV.
    • States to have the powers for clearances w.r.t CRZ-II and III with necessary guidance
  • No development zone (NDZ of 20 meters has been stipulated for all Islands: in the wake of space limitations and unique geography and to bring uniformity in treatment of such regions.
  • All Ecologically Sensitive Areas have been accorded special importance: Through Specific guidelines related to their conservation and management plans.
  • Pollution abatement has been accorded special focus: By permitting construction of treatment facilities in CRZ-I B area subject to necessary safeguards.
  • Defence and strategic projects have been accorded necessary dispensation.

Benefits of Coastal Regulation Zone | UPSC – IAS

  • Enhanced activities in the coastal regions thereby promoting economic growth while also respecting the conservation principles of coastal regions.
    • o Boost tourism in terms of more activities, more infrastructure and more opportunities in creating employment opportunities.
    • o greater opportunities for development of densely populated rural areas in the CRZs.
  • CRZ, 2018 is also in sync with the thrust being given to port-led industrialisation and the Coastal Economic Zones projects.
  • Additional opportunities for affordable housing which will benefit not only the housing sector but the people at large looking for shelter.
  • It is expected to rejuvenate the coastal areas while reducing their vulnerabilities.

Concerns Over Coastal Regulation Zone | UPSC – IAS 

The new notification has done away with or diluted many stringent restrictions in place at coastal areas. The emphasis of the new CRZ norms is on promotion of tourism facilities, quicker dispensation of defence and strategic projects and liberal licensing for the installation of treatment plants.

  • Ecosensitive regions could see flurry of construction activity thereby hampering the coastal ecosystem and biodiversity.
  • The notification violates the balance between ecosystem and development. The mandatory 50 m buffer zone for mangrove forest in private land with an expanse of more than 1,000 sq m has been done away with.
  • The fishermen are worried that the entry of the tourism sector will attract the real estate lobbies, who will eventually displace the coastal community and deny them the access to the seas.
  • Further, the reduction of NDZ is done without taking consideration of sea level rise. The coastline is already vulnerable due to erosion, fresh water crisis and loss of livelihoods. The new changes will only increase this vulnerability and promote commercialisation of the coast.
  • The Hazard Line, mapped by the Survey of India has, however, been de-linked from the CRZ regulatory regime and will be used only as a tool for disaster management and planning of adaptive and mitigation measures.
  • The treatment facilities, allowed in CRZ-I to reduce coastal pollution, means several ecologically fragile areas will have sewage treatment plants transferring pollution from land to sea.

The notification permits activities like reclamation of land for commercial activities, interference with sand dunes, large scale recreation and drawing of groundwater within the 200-500 metres from the HTL, which is
detrimental to the coastal ecology and that will displace the local communities and affect the biodiversity.

Conclusion | UPSC – IAS

The sustainable management depends on the nature of the social system, comprising political, economic and industrial infrastructure and its linkages, with the knowledge about coastal systems as well as local communities. India need to move from a purely regulatory approach towards an Integrated Coastal Zone Management (ICZM).

Key terms Explanation – ICZM

Integrated Coastal Zone Management (ICZM): This concept was born in 1992 during the Earth Summit of Rio de Janeiro. This was a World Bank assisted project with the objective of building national capacity for implementation of comprehensive coastal management approach in the country, and piloting the integrated coastal zone management approach in states of Gujarat, Orissa and West Bengal.

  • The project’s multi-sectoral and integrated approach represents a paradigm shift from the traditional sector-wise management of coastal resources where numerous institutional, legal, economic and planning frameworks worked in isolation, at times with conflicting aims and outputs.
  • The project puts equal emphasis on conservation of coastal and marine resources, pollution management, and improving livelihood

Climate Change COP24 – Katowice, Poland -An Analysis | UPSC IAS PCS

Climate Change (COP 24) - Katowice, Poland -An Analysis UPSC IAS PCS UPPCS SSC

Climate Change (COP 24) - Katowice, Poland -An Analysis UPSC IAS PCS UPPCS SSC

The 24th Session of the of the Conference of the Parties to the United Nations Framework Convention on Climate Change COP24 was held in Katowice, Poland.

Agenda of COP24: The conference focused on three key issues:-

  • Finalization of guidelines/ modalities/rules for the implementation of Paris Agreement.
  • Conclusion of 2018 Facilitative Talanoa Dialogue (to help countries implement NDC by 2020)
  • The stocktake of Pre-2020 actions implementation and ambition

Key outcomes in Katowice | UPSC IAS PCS PIB

Accounting Guidance Rules to guide the countries for their Climate pledges (“nationally determined contributions”, NDCs), will make it easier to compare pledges and to add them up as a global aggregate.

  • All countries “shall” use the latest emissions accounting guidance from the IPCC, last updated in 2006, but now in the process of being reformed next year.
  • Market mechanisms: This provides for the trading of carbon credits i.e. overachievement of NDCs (cooperative approaches and internationally transferred mitigation outcomes (ITMOs)), as well as individual projects generating carbon credits for sale. Following is the status on this front:
    • Accounting Rules to prevent “double counting” of emissions reductions by the buyer and seller of offsets could not be finalised.
    • The schemes and methodologies for the implementation of Sustainable Development Mechanism- SDM would be discussed in COP25. The SDM is intended to replace the Kyoto Protocol’s “Clean Development Mechanism” (CDM) for carbon offsets. o Overall Mitigation in Global Emissions (OMGE): It is a central and critical new element under the Paris Agreement, that takes carbon markets beyond the offsetting approaches of the existing markets like the CDM.
    • The primary purpose of OMGE is to deliver on cost-effectively reducing greenhouse gas emissions, rather than creating carbon markets for their own sake.
  • Small island countries wanted a mandatory automatic cancellation or discounting for an OMGE applied to all the activities under market mechanism. However this option was removed from the COP decision and made voluntary.
  • Climate finance reporting: Developed country Parties shall biennially communicate indicative quantitative and qualitative information on programmes, including projected levels, channels and instruments, as available public financial resources to be provided to developing country Parties. Other Parties providing resources are encouraged to communicate biennially such information on a voluntary basis.
    • The UNFCCC secretariat to establish a dedicated online portal for posting and recording the biennial communications.
  • Global stocktake: Paris Agreement requires the CMA (Conference of the Parties serving as the meeting of the Parties to the Paris Agreement) to periodically take stock of the implementation of the Paris Agreement and to assess collective progress towards achieving the purpose of the Agreement and its long-term goals. This process is called the global stocktake.
    • The rules set the structure for the stocktake process, which is to be divided into three stages: Information collection, technical assessment and consideration of outputs.
  • Transparency: The purpose of the transparency framework is to provide a clear understanding of climate change action in the light of the objective of the Paris Convention. This includes clarity and tracking of progress towards achieving Parties’ individual NDCs, and Parties’ adaptation actions, including good practices and gaps, to inform the global stocktake.
  • Moreover, it provides clarity on support provided and received by relevant individual Parties in the context of climate change actions, and, to the extent possible, to provide a full overview of aggregate financial support provided, to inform the global stocktake.
    • The final rulebook applies a single set of rules to all countries, however with flexibility for “those developing country parties that need it in the light of their capacities”, reflecting CBDR-RC principle.
  • Loss and damage: Loss and damage caused by the unavoidable impacts of climate change was a touchstone issue for vulnerable countries, such as small island developing states. The rulebook mentions this issue, however, in a diluted version.
    • The global stocktake rules do add loss and damage clause. The stocktake rules now say it “may take into account, as appropriate, efforts to avert, minimise and address loss and damage associated with the adverse effects of climate change”.
    • The transparency rules also say countries “may, as appropriate” report on loss and damage.
  • Other matters: Rules were finalised in a number of other areas, including how compliance with the Paris Agreement is to be monitored.
    • COP24 agreed to set up an expert compliance committee that is “facilitative in nature, non-adversarial and non-punitive”. It will not impose penalties or sanctions. The committee will be able to investigate countries that fail to submit climate pledges.
    • COP decided that the “adaptation fund” – a financial mechanism set up under the Kyoto Protocol – should continue under the Paris Agreement.
  • Talanoa Dialogue: The final text simply “invited” countries to “consider” the outcomes of the Talanoa dialogue in preparing their NDCs and in efforts to enhance pre-2020 ambition.
    • The text also “welcomes” the 2018 stocktake on pre-2020 implementation and ambition, and reiterates its decision to convene another stocktake next year.
    • Pre-2020: With respect to the “pre-2020” commitments –first agreed by developed countries in 2010 in Cancun – the COP called for developed countries to ratify the Doha Amendment so that it can enter into force. This would extend the Kyoto Protocol on developed country emissions till 2020.
    • The COP also “strongly urges” developed countries to increase their financial support in line with the promise to jointly mobilise $100bn per year in climate finance to poorer countries by 2020. It acknowledges that “the provision of urgent and adequate finance” will help developing countries in order to up their own pre-2020 action.
    • ‘Welcoming’ the IPCC 1.5°C report: Despite the majority of countries speaking in favour of the report, four countries – the US, Saudi Arabia, Russia and Kuwait – refused to “welcome” the report. The COP welcome its “timely completion” and “invited” countries to make use of the report in subsequent discussions at the UNFCCC.

Analysis of the outcomes | UPSC IAS PCS PIB

  • Provision of finance by developed countries: Rules on financial contributions by developed countries have been diluted making it very difficult to hold them accountable.
    • Now, developed countries have the choice to include all kinds of financial instruments, concessional and non-concessional loans, grants, aids etc, from various public and private sources, to meet their commitments.
    • The rules on ex-ante (forecasted) financial reporting and its review for adequacy has been significantly weakened.
    • Developed countries now have the freedom to decide the amount and the kind of financial resources they want to give to the developing countries and do this without any strong mechanism of accountability.
  • Loss and damage: The Warsaw International Mechanism, which has to deal with averting, minimizing and addressing loss and damage associated with the adverse effects of climate change, has no financial resources to support vulnerable countries. With no financial provisions, the countries are now left on their own to address the impacts of climate change.
  • Global stocktake (GST):
    • The non- Policy prescriptive rulebook for GST ensures that the process will neither give any recommendation to individual countries or a group of countries, nor will it give any prescriptive policy to everyone. This would result in collection of a lot of technical information without any clear recommendation to increase ambition on mitigation or finance.
    • Also, equity has been mentioned in the text, but there is no mechanism to operationalize it.
  • Carbon market Mechanism:
    • There has virtually been no progress made on non-market mechanisms (sub-article 6.8 of Paris Agreement) to reduce emissions and enhance sinks in forests and land.
    • There is no firm decision on OMGE mechanism. Also, the rulebook has different rules for different markets, which is non-transparent and makes emissions reductions unverifiable. Trading is allowed for sectors which are not covered in a country’s emissions targets, which will dilute the overall mitigation effect.
    • Countries are on their own: The Paris Agreement had both bottom-up and top-down elements. Most of the top-down elements have been diluted in the rulebook. The Paris Agreement and its rulebook is now a totally ‘self-determined’ process. Countries are now on their own to mitigate, to adapt, and to pay the cost of climate impacts.

Indian Human Microbiome Initiative | UPSC – IAS | PIB

Indian Human Microbiome Initiative UPSC - IAS PIB

Indian Human Microbiome Initiative UPSC - IAS PIB

Indian Human Microbiome Initiative | UPSC – IAS | PIB

Indian Human Microbiome Initiative Project, led by The National Centre for Microbial Resource (NCMR)National Centre for Cell Science (NCCS) has been put up for approval.

What is Microbiome?  | UPSC – IAS | PIB

  • The collective genome of all micro-organisms contained within the human body, residing inside tissues & bio-fluids is called Human Microbiome. It includes bacteria, archaea, fungi, protists and viruses.
  • Most of them have either commensal (co-exist without harming humans) or mutualistic (each benefit from the other).
  • Different parts of human body including the skin, mammary glands, placenta, uterus, ovarian follicles, lungs, saliva, oral mucosa, conjunctiva, biliary and gastrointestinal tracts, are occupied by characteristic microbial populations.
  • The composition of microbiome is shaped by factors such as genetics, dietary habits, age, geographic location and ethnicity. Human microbiome makes up around 2% of the body mass of the adult.

Importance of the Human Microbiome | UPSC – IAS | PIB

Microbial communities play a key role in many aspects of host physiology:

  • Metabolism of otherwise complex indigestible carbohydrates and fats
  • Production of essential vitamins
  • Maintaining immune systems
  • Acting as a first line of defense against pathogens
  • Influence the susceptibility to certain infectious diseases, as well as contribute to disorders such as obesity and diabetes
  • Determines how one responds to a particular drug treatment

The diversity of microbes that make up human microbiome could lead to novel therapies e.g. an infection caused by a ‘bad’ bacterial species can be treated by promoting the growth of ‘good’ bacteria.

Indian Human Microbiome Initiative | NCMR & NCCS | UPSC - IAS | PIB Gk today The Hindu

About Human Microbiome Project (HMP) | UPSC – IAS | PIB

  • Human Microbiome Project is a research initiative of US’s National Institute of Health with the mission to generate the resources and expertise needed to characterize the human microbiome and analyze its role in health and disease.
  • Launched in 2007, it is focused on identifying and characterizing human microbial fauna and elucidating their roles in health and diseases.
  • Some methodologies used in HMP are:
    • o Metagenomics as a culture-independent method of broad microbial community characterization
    • o Whole Genome Sequencing (WGS) to provide a “deep” genetic perspective on aspects of a given microbial community, i.e. individual bacterial species

Human Microbiome Research in India | UPSC – IAS | PIB

  • India doesn’t have a dedicated national human microbiome project. But, the proposed Indian Human Microbiome Initiative holds a lot of potential.
  • The project will include collection of saliva, stool and skin swabs of 20,000 Indians across various ethnic groups from
    different geographical regions. India provides for a wide range of research with more than 4,500 ethnic groups and presence of two global biodiversity hotspots (Himalayan range and Western Ghats).
  • Scientists have found that Indian population, particularly tribals, have distinct gut microbiota than individuals from other parts of the world. Such tribal populations largely unaffected by “modern” diet and have lower prevalence of lifestyle diseases and their study would shed some light on mutualism between gut microbiota and the host.

Key terms Explanation

What is Metagenomics ? | UPSC – IAS | PIB

  • It is a sequence-based approach that allows the genetic material from the complete collection of microbes to be analyzed in their natural environment without needing to cultivate the microorganisms.
  • Currently, only a small percentage of the bacteria that comprise the human microbiome have been identified and studied. Majority (>95%) of them are difficult to isolate and culture, because the required growth conditions cannot be reproduced in the laboratory.
  • However, recent technological advances in DNA sequencing and the development of meta-genomics have now made it feasible to analyze the entire human microbiome.

Earth Biogenome project & its Significance | UPSC – IAS and PIB

Earth Biogenome project & its Significance UPSC and PIB IAS

Earth Biogenome project & its Significance UPSC and PIB IAS

About Earth BioGenome Project | UPSC – IAS

International biologists have launched an ambitious Earth BioGenome Project at an estimated cost of $4.7bn.

Aim of the Project It aims to sequence, catalog and characterize the genomes of all of Earth’s eukaryotic biodiversity over a period of ten years.

Significance of Earth Biogenome project | UPSC and PIB

  • Saving Biodiversity: Given Climate Change and related worries such as loss of forest cover, about 50% of current biodiversity could be lost by the end of the 21st century in what is being referred to as the Sixth Great Extinction. This Project will help record the genomes of organisms at risk.
  • Discovery of Unknown Species: It is believed that there are somewhere between 2 million and 3 million eukaryotic species on the planet. Only about half have been identified so far.
  • New Resources: It should also lead to the discovery of new drugs, new biofuels, and boost agricultural technologies, with obvious commercial benefits.
  • Generate Revenues: It could help to boost scientific capacity and generate revenues for poor countries with rich biodiversity.
  • Better Understanding: It will revolutionize the understanding of biology and evolution and thus create new approaches for the conservation of rare and endangered species.

Challenges in Earth Biogenome project | UPSC and PIB

  • High Quality data: The most difficult part in EBP will be to acquire and process high-quality samples from species that are hard to reach.
  • Lack of Technologies: New technologies such as specimen-collecting drones may need to be developed.
  • IPR issue: There are complicated protocols involved in transferring physical samples and genetic data across borders, and there are bound to be disputes about the sharing of the benefits obtained.
  • Legal Frameworks: While the Nagoya Protocols of 2014 provide a framework for such transfers, the United Nations Convention on Biological Diversity will have to work out new protocols and, ideally, create a new, transparent and equitable legal framework.

About Earth BioGenome Project | UPSC and PIB

  • It involves projects by various countries:
    • US-led project to sequence the genetic code of tens of thousands of vertebrates
    • Chinese project to sequence 10,000 plant genomes
    • The Global Ant Genomes Alliance, which aims to sequence around 200 ant genomes.
  • UK participants, led by the Wellcome Sanger Institute, will also sequence the genetic codes of all 66,000 species inhabiting Britain in a national effort called the Darwin Tree of Life.
  • Currently, fewer than 3,500, or about 0.2 per cent of all known eukaryotic species on Earth have had their genome sequenced.
  • Physical samples would be stored frozen in liquid nitrogen in four or more facilities located in different parts of the world, and repositories of digitised information would be created.
  • The completed project will generate at least 1 exabyte (that is, 1 billion gigabytes) of data, which is to be
    shared online for free.
  • The initiative would produce a database of biological information that provides a platform for scientific research and supports environmental and conservation initiatives.
  • The participating institutions would raise their own funding as far as possible. However, the project has the backing of the World Economic Forum
  • The potential benefits of EGP are compared to those from Human Genome Project, which has transformed research into human health and disease.

Key – terms  Explain | UPSC and PIB

Eukaryotes  

  • These are organisms whose cells have a nucleus enclosed by membranes.
  • These are animals, plants, fungi and protozoa, which encompass all of life except simple microbes (bacteria and archaea).

Prokaryotes

  • These are the organisms with single cell nucleus e.g. bacteria and archaea.

Human Genome Project (HGP) | UPSC and PIB

  • It was the international, collaborative research program whose goal was the complete mapping and understanding of all the genes of human beings. All our genes together are known as our “genome”.
  • It helped to develop modern sequencing techniques, which have vastly improved the efficiency while reducing the costs of genomic research.
  • It read the genetic code of just one species, Homo sapiens, between 1990 and 2003.

Convention on Biological Diversity | Sharm El-Sheikh Declaration UPSC

Convention on Biological Diversity Sharm El-Sheikh Declaration UPSC IAS

Convention on Biological Diversity Sharm El-Sheikh Declaration UPSC IAS

COP – 14 and Sharm El-Sheikh Declaration | UPSC – IAS

Recently, Conference of the Parties (COP-14) to the Convention on Biological Diversity (CBD) was held, adopting Sharm El-Sheikh Declaration.

Highlight of COP-14

  •  Adoption of Sharm El-Sheikh Declaration on Investing in Biodiversity for People and Planet.
    • Governments commit to mainstream biodiversity through, integrating biodiversity values in legislative and policy frameworks, and development and finance plans.

Other Significant Highlight

  • New Deal for Nature: It is an agreement on a comprehensive and participatory process to develop post-2020 global biodiversity framework to further achieve the 2050 Vision for Biodiversity.
  • Launch of International Alliance of Nature and Culture to advance work on biological and cultural diversity in collaboration with the United Nations Educational, Scientific and Cultural Organization (UNESCO) and indigenous peoples and local communities.
  • It called for UN General Assembly to designate 2021 to 2030 as the UN Decade of Ecosystem Restoration.

Convention on Biological Diversity (CBD) | UPSC – IAS

  • Aim: To promote the conservation of biodiversity, the sustainable use of its components, and the fair and equitable sharing of benefits arising from the use of genetic resources.
  • It’s a near universal convention with a participation of 196 member countries. Protocols adopted under the Convention.
  • Cartagena Protocol on Biosafety: It seeks to protect biological diversity from the potential risks posed by living modified organisms resulting from modern biotechnology.
  • Nagoya Protocol on Access and Benefit Sharing: It aims at sharing the benefits arising from the utilization of genetic resources in a fair and equitable way, including by appropriate access to genetic resources and by appropriate transfer of relevant technologies.

The Strategic Plan for Biodiversity includes a vision for 2050, five strategic goals and twenty Aichi Biodiversity Targets, mostly to be achieved by 2020. The twenty Aichi Biodiversity Targets are grouped under five strategic goals:

  • Address the underlying causes of biodiversity loss by mainstreaming biodiversity across government and society
  • Reduce the direct pressures on biodiversity and promote sustainable use
  • Improve the status of biodiversity by safeguarding ecosystems, species and genetic diversity
  • Enhance the benefits to all from biodiversity and ecosystem services
  • Enhance implementation through participatory planning, knowledge management and capacity building.

The 2050 Vision stresses the role of biodiversity for human wellbeing: “biodiversity to be valued, conserved, restored and wisely used, maintaining ecosystem services, sustaining a healthy Planet and delivering benefits essential for all people”.

Montreal Protocol: Scientific Assessment of Ozone Depletion | UPSC – IAS

Montreal Protocol: Scientific Assessment of Ozone Depletion: UPSC IAS


Montreal Protocol: Scientific Assessment of Ozone Depletion:  UPSC IAS

Scientific Assessment of Ozone Depletion | UPSC – IAS

The quadrennial (four-yearly) review of the Montreal Protocol reveals a healing ozone layer, global warming reduction potential, and options for more ambitious climate action.

Key findings of the Scientific Assessment of Ozone Depletion | UPSC – IAS

  • Actions taken under the Montreal Protocol have led to decreases in the atmospheric abundance of controlled ozone-depleting substances (ODSs) and the start of the recovery of stratospheric ozone.
  • The atmospheric abundances of both total tropospheric chlorine and total tropospheric bromine from long-lived ODSs controlled under the Montreal Protocol have continued to decline since the 2014 Assessment. Outside the Polar Regions, upper stratospheric ozone layer has recovered at a rate of 1-3% per decade since 2000.
  • The Antarctic ozone hole is recovering, while continuing to occur every year. As a result of the Montreal Protocol much more severe ozone depletion in the Polar Regions has been avoided.
  • At projected rates, Northern Hemisphere and mid-latitude ozone is scheduled to heal completely (i.e. equivalent to 1980 values) by the 2030s followed by
    the Southern Hemisphere in the 2050s and Polar Regions by 2060.
  • The Kigali Amendment is projected to reduce future global average warming in 2100 due to hydrofluorocarbons (HFCs) from a baseline of 0.3–0.5 degree Celsius to less than 0.1 degree Celsius.

Key findings of the Scientific Assessment of Ozone Depletion 2018 UPSC - IAS PCS UPPSC UPPCS

Ozone change and its influence on climate | UPSC – IAS

  • Ozone is important in the climate system and its changes can influence both the troposphere and the stratosphere.
  • Influence on stratospheric climate: Decreases in stratospheric ozone caused by ODS increases have been an important contributor to observed stratospheric cooling.
    • New studies find that ODSs thereby contributed approximately one third of the observed cooling in the upper stratosphere from 1979 to 2005, with two thirds caused by increases in other GHGs.
  • Influence on surface climate and oceans: Lower stratospheric cooling due to ozone depletion has very likely been the dominant cause of late 20th century changes in Southern Hemisphere climate in summer. These changes include the observed poleward shift in Southern Hemisphere tropospheric circulation, with associated impacts on surface temperature and precipitation.
  • Changes in tropospheric circulation driven by ozone depletion have contributed to recent trends in Southern Ocean temperature and circulation; the impact on Antarctic sea ice remains unclear.

Future Global Ozone changes | UPSC – IAS

The key drivers of future ozone levels continue to be declining ODS concentrations, upper stratospheric cooling because of increased GHGs, and the possible strengthening of the Brewer-Dobson circulation (a model which attempts to explain how tropical air has less ozone than polar air, even though the tropical stratosphere is where most atmospheric ozone is produced) from climate change.

  • CO2, CH4, and N2O will be the main drivers of 60°S–60°N stratospheric ozone changes in the second half of the 21st century. These gases impact both chemical cycles and the stratospheric overturning circulation, with a larger response in stratospheric ozone associated with stronger climate forcing.
  • Given that ODS levels are expected to decline slowly in coming years, a large enhancement of stratospheric sulphate aerosol in the next decades would result in additional chemical ozone losses. Possible sources of additional stratospheric sulphate aerosol include volcanic eruptions (like Mt. Pinatubo in 1991) and geoengineering.

Why Montreal Protocol Worked ? | UPSC – IAS

The Montreal Protocol is one of the most successful and effective environmental treaties ever negotiated and implemented. No single factor led to its success.

  • Approach of Cooperation: From the start, negotiation relied heavily on leadership and innovative approaches. Much negotiation was held in small, informal groups. This enabled a genuine exchange of views and the opportunity to take some issues on trust, such as the subsequent development of the Multilateral Fund. The people negotiating the treaty also included scientists, which lent credibility.
  • Principles based: The “precautionary principle”, and the concept of common, but differentiated, responsibility took root in the Montreal Protocol when developing countries were given longer time to phase-out ODS.
  • Flexibility to accommodate newer information: This flexibility meant the protocol could be amended to include stricter controls: more ozone-depleting substances added to the control list and total phase-out, rather than partial phase-out, called for. Starting out modestly also encouraged a greater confidence in the process.
  • Trade Provisions and restrictions: These limited the signatories to trade only with other signatories. This increasingly limited the supplies of CFCs and other ozone-depleting substances (ODS) to non-signatories countries which forced them to ratify the Protocol.
  • Clear List of Targeted Sectors: The chemicals and sectors (refrigeration, primarily) involved are clearly articulated. This let governments prioritise the main sectors early.
  • Incentive to Industry: The Montreal Protocol also provided a stable framework that allowed industry to plan long-term research and innovation. Transitioning to newer, reasonably priced formulations with lower- or no-ozone depleting potential benefited the environment and industry.
  • Institutional Support: Another feature of the protocol has been the expert, independent Technology and Economic Assessment Panel (and its predecessors). These have helped signatories reach solid and timely decisions on often-complex matters. They have given countries confidence to start their transition.
  • The Multilateral Fund has been another reason for the protocol’s success.
    • It provides incremental funding for developing countries to help them meet their compliance targets.
    • Significantly, it has also provided institutional support. This helps countries build capacity within their governments to implement phase-out activities and establish regional networks so they can share experiences and learn from each other.

Marrakech Partnership for Global Climate Action | UPSC – IAS

Marrakech Partnership for Global Climate Action UPSC - IAS

Marrakech Partnership for Global Climate Action  UPSC - IAS

Marrakech Partnership for Global Climate Action | UPSC – IAS

The Marrakech Partnership for Global Climate Action, established at the CoP22 (UNFCCC), aims to mobilize climate actions quickly and to reap the benefits in efficiency and effectiveness through partnerships and coordination between different actors.
It lists out some of the progressive steps taken and benefits of Climate action in the Yearbook of Global Climate Action 2018:

  • About 60 per cent of the initiatives are producing outputs that put them on a path to achieving their desired environmental or social outcomes.
  • The outputs from cooperative initiatives are increasingly being delivered in low- or middle-income countries. This reflects increased climate action in developing countries and increased international cooperation.
  • Climate action is re-shaping the financial sector to help transition to a net-zero carbon and resilient society. Businesses and investors are also reporting on and are managing climate risks and opportunities and implementing the Recommendations of the Task Force on Climate-related Financial Disclosures (TCFD).
  • Increasingly mainstreaming of climate change into financial institutions’ operations and investment decisions. E.g. the green bond market. In 2018, the total value of climate-aligned bonds peaked at USD 1.45 trillion.

Blue Economy its Significance and Challenges | UPSC – IAS

Blue Economy upsc

Blue Economy upsc

Blue Economy and its Components | UPSC – IAS

As per the World Bank, Blue Economy is the sustainable use of ocean resources for economic growth, improved livelihoods, and jobs while preserving the health of ocean ecosystem. It covers several sectors linked directly or indirectly to the oceans such as –

  • Fishing, minerals, shipping and port infrastructure,
  • Marine biotechnology,
  • Marine renewable energy,
  • Marine tourism,
  • Ocean governance and education.

Blue Economy its Significance and Challenges | UPSC - IAS

Significance of Blue economy | UPSC – IAS

Economic Benefits:

  • Oceans provide 30 percent of oil and gas resources.
  • 90% of goods trade takes place through Oceans Sea of Line Communication.
  • Ocean contributes $2.5 trillion to world economy with around 60 million people are employed in fisheries and aquaculture.
  • Seabed Mining of polymetallic nodules and polymetallic sulphides to extract nickel, cobalt, manganese and rare earth metals.

Environmental Benefits:

  • Mangroves and other vegetated ocean habitats sequester 25 percent of the extra CO2 from fossil fuels, i.e., Blue Carbon.
  • Protection of coastal communities from disasters like floods and storms.
  • A Sustainable Blue Economy can help to achieve commitments under UN’s Sustainable Development Goals 2030, Paris climate agreement 2015 and the UN Ocean Conference 2017.

Challenges to Blue Economy | UPSC – IAS

  • Unsustainable development near marine areas: Physical alterations and destruction of marine and coastal habitats & landscapes largely due to coastal development, deforestation, & mining.
  • FAO estimates that approximately 57 percent of fish stocks are fully exploited and another 30 percent are over-exploited, depleted, or recovering.
  • Marine pollution: It is in the form of excess nutrients from untreated sewerage, agricultural
    runoff, and marine debris such as plastics. Deep sea mining can cause long term irreversible ecological damage to marine ecosystem.
  • Impacts of climate change: Threats of both slow-onset events like sea-level rise and more intense and frequent weather events like cyclones. Long-term climate change impacts on ocean systems like changes in sea temperature, acidity, and major oceanic currents.
  • Geopolitical issues: Geopolitical tussle between in various regions like South China Sea, Indian Ocean Region etc. and undermining International Laws like UNCLOS limits the countries from achieving the full potential of Blue Economy.
  • Unfair trade practices: Many times fishing agreements allow access to an EEZ of country to foreign operators. These operators restrict transfer of specific fishing knowledge to national stakeholders leading to low appropriation of fisheries export revenues by national operators. So the potential for national exploitation of those resources is reduced in the long run.
  • Other non-conventional threats: Defense and security related threats like piracy and terrorism combined with natural disasters (Small Island Developing States are particularly vulnerable).

Blue economy and India  | UPSC – IAS

India is trying to achieve the potential of Blue Economy by promoting the spirit of ‘SAGAR-Security and Growth for All in the Region’ in Indian Ocean Region. Some initiatives by India are:  (important for UPSC)

Sagarmala Project: Sagarmala initiative focus on three pillars of development

  • Supporting and enabling Port-led Development through appropriate policy and institutional interventions.
    • Port Infrastructure Enhancement, including modernization and setting up of new ports.
    • Efficient Evacuation to and from hinterland by developing new lines/linkages for transport (including roads, rail, inland waterways and coastal routes).
  • Coastal Economic Zones: 14 CEZs are being developed under Sagarmala initiative covering all the Maritime States.
    • CEZs are spatial economic regions comprising of a group of coastal districts or districts with a strong linkage to the ports in that region.
    • CEZ will help to tap synergies of planned economic corridors.
  • Resource exploration: India in recent times has shifted its focus towards Indian Ocean resource exploration. E.g. India has explored 75000 sq km of Indian Ocean Seabed and is developing technologies (like remotely operated vehicles) for mining the resources
  • International relations and security: India is cooperating with Indian Ocean littoral countries and projecting itself as ‘net security provider’ to ensure a safe, secure and stable Indian Ocean Region (IOR). India is also cooperating with extra regional powers like US, Japan in IOR. E.g. Asia-Africa growth corridor, QUAD etc.

Sustainable Blue Economy Conference

  • It’s the first global conference on the sustainable blue economy.
  •  It was convened by Kenya and co-hosted Canada and Japan.