
Overview
Previous Year UPSC-CSE Questions By the end you will be able to draft model answers for the following UPSC questions. Each question carries a collapsible framework showing how to approach it in the exam.
- UPSC Prelims 2018 General StudiesConsider the following statements:
- Most of the world's coral reefs are in tropical waters.
- More than one-third of the world's coral reefs are located in the territories of Australia, Indonesia and Philippines.
- Coral reefs host far more number of animal phyla than those hosted by tropical rainforests.
Which of the statements given above is/are correct?
How to approach this Prelims question
Approach: Statement 1: coral reefs require warm tropical SSTs (above 20 deg C); accurate. Statement 2: Coral Triangle including Indonesia and Philippines, plus Australia's Great Barrier Reef, jointly hold over one-third of global reefs; accurate. Statement 3: coral reefs host approximately 32 of 34 animal phyla; tropical rainforests host fewer; accurate.
Trap to watch: Statement 3 reverses the more familiar comparison of species count; the question asks about phyla, where reefs dominate.
Key facts to recall:
- Coral reefs require tropical SST above 20 deg C; concentrated 30 deg N to 30 deg S
- Coral Triangle (Indonesia, Philippines, Malaysia) holds the world's highest coral diversity
- Coral reefs host approximately 32 animal phyla; rainforests host fewer at the phylum level
Answer signal: All three statements correct; option 1, 2 and 3.
- UPSC Mains 2022 GS-IIIDiscuss global warming and mention its effects on the global climate. Explain the control measures to bring down the level of greenhouse gases that cause global warming, in the light of the Kyoto Protocol, 1997.
How to structure the answer in the exam
Introduction: Open with the IPCC AR6 framing: anthropogenic greenhouse gas emissions have warmed the global climate system, with widespread and rapid changes observed in the atmosphere, ocean, cryosphere and biosphere. Global mean surface temperature has risen about 1.1 degrees Celsius above pre-industrial levels.
Body (sub-themes to develop):
- Mechanism: greenhouse effect, CO2 and methane radiative forcing, ocean heat content rise.
- Effects on global climate: sea-level rise (0.43 to 0.84 metres by 2100 per AR6); intensifying ENSO extremes; declining Arctic sea ice; coral bleaching globally; agricultural zone shifts.
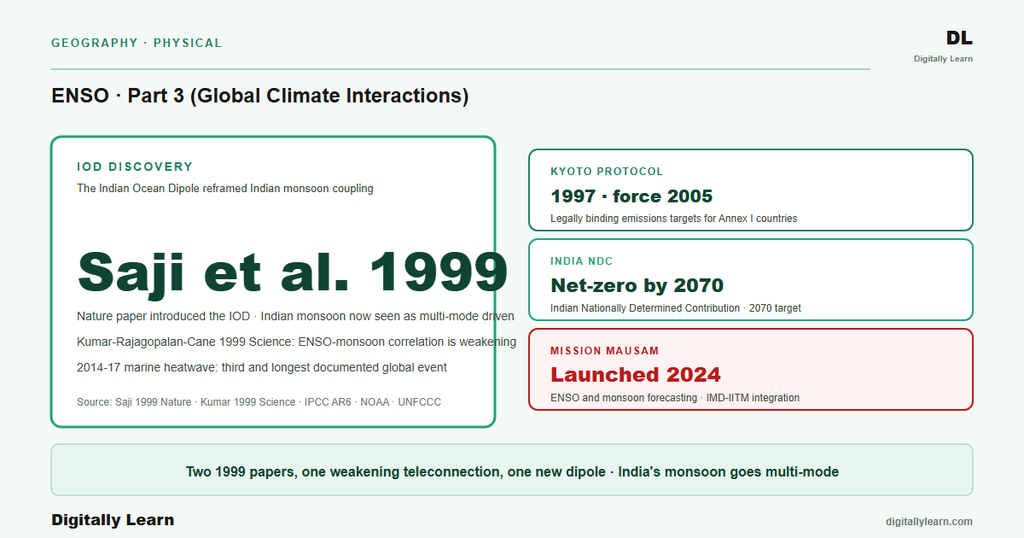
- Kyoto Protocol (1997, in force 2005): legally binding emissions targets for Annex I (developed) countries; market mechanisms (CDM, JI, emissions trading).
- Post-Kyoto frameworks: Paris Agreement 2015 with Nationally Determined Contributions; Glasgow Climate Pact 2021; Loss and Damage fund agreed at COP27 Sharm el-Sheikh 2022.
- Indian context: India's Nationally Determined Contributions including reaching net-zero by 2070; International Solar Alliance launched 2015; Mission Mausam 2024 for ENSO and monsoon forecasting.
Conclusion: Tie back to the integrated challenge: global warming requires both mitigation (emissions control) and adaptation (climate-resilience planning). For India, ENSO-amplified climate volatility is the central operational challenge; international cooperation must support both global emissions reduction and national-level adaptation finance.
- UPSC Mains 2019 GS-IAssess the impact of global warming on coral life system with examples.
How to structure the answer in the exam
Introduction: Coral reefs are among the most thermally sensitive ecosystems on Earth. Coral bleaching occurs when sea-surface temperatures exceed the corals' thermal tolerance, causing the corals to expel their symbiotic zooxanthellae. Global warming has increased background SST, and ENSO-amplified marine heat waves now trigger global bleaching events.
Body (sub-themes to develop):
- Mechanism: thermal stress and zooxanthellae expulsion; ocean acidification compounds bleaching effects.
- 1997-98 El Niño: first documented global coral bleaching event (1998).
- Second global bleaching event: 2010 (independent of a major El Niño).
- 2014-2017 marine heat wave amplified by the 2015-16 El Niño: third and longest documented global event; severe Great Barrier Reef impact (2016 mass bleaching); Indian Ocean reefs widely affected.
- 2023-24 El Niño: fourth global event declared by NOAA in April 2024.
- Indian context: Lakshadweep and Andaman reefs face recurring bleaching; Gulf of Mannar shows resilience that researchers are studying.
Conclusion: Coral bleaching is among the clearest near-term ecological impacts of global warming and ENSO interaction. Conservation under continued warming requires both global emissions reduction and local resilience measures (water-quality protection, fishing pressure management, restoration). The 1.5-degrees-Celsius temperature ceiling of the Paris Agreement is widely viewed as the threshold beyond which most coral reefs cannot survive in their current form.
ENSO does not act alone. It interacts with the Indian Ocean Dipole, which sometimes cancels its impact on India. It interacts with the Madden-Julian Oscillation, which modulates intraseasonal variability. It also interacts with the subtropical and tropical easterly jet streams and the broader global atmospheric circulation. Its global footprint reaches South American rainfall, Australian droughts, African Sahel variability, North American winter weather, marine ecosystems, and coral bleaching. Climate change is reshaping ENSO itself. The IPCC AR6 Working Group I assesses that extreme El Niño and La Niña events will become more frequent under continued warming. Forecasting ENSO and translating those forecasts into agricultural and water-resource decisions is a major operational task for the India Meteorological Department and partner institutions worldwide.
Background: ENSO in a Crowded Climate System
Why it matters. ENSO operates as the strongest source of global interannual climate variability outside the annual cycle. It does not act in isolation. Its interactions with the Indian Ocean Dipole, the Madden-Julian Oscillation, and large-scale jet streams shape its observed footprint. They determine whether a given El Niño or La Niña produces the expected drought-flood pattern or a confounded outcome. UPSC GS-I physical geography and GS-III disaster management questions both reward candidates who treat ENSO as a coupled-system actor rather than an isolated phenomenon.
Part 1 of this series covered the ENSO mechanism: Walker Circulation, Bjerknes feedback, life cycle. Part 2 (the current part) places ENSO in the global climate system. It examines interactions with other modes, surveys case studies of major events, maps forecasting practice, and engages with ENSO under anthropogenic climate change. Part 3 will close the cluster with ENSO impacts on India: monsoon, agriculture, economy, extreme weather, and cyclones.
The discovery of the Indian Ocean Dipole by Saji and colleagues in 1999 (published in Nature) reframed the Indian monsoon as responsive to multiple coupled modes. The Kumar, Rajagopalan, and Cane paper of 1999 in Science showed that the ENSO-monsoon correlation was weakening. The IPCC AR6 cycle of 2021 quantified the climate-change effects on ENSO itself. This part synthesises that work for UPSC-grade understanding.
How ENSO interacts with other coupled climate modes
ENSO and the Indian Ocean Dipole
How the Indian Ocean Dipole is defined
The Indian Ocean Dipole (IOD) is a coupled ocean-atmosphere mode of the tropical Indian Ocean, analogous to ENSO but operating across a different basin. It is defined by the sea-surface-temperature gradient between the western Indian Ocean (off East Africa) and the eastern Indian Ocean (off Indonesia). Saji and colleagues described and named the phenomenon in 1999 in Nature, reframing the understanding of Indian Ocean climate variability.
Positive and negative IOD phases
- Positive IOD: Western Indian Ocean anomalously warm, eastern Indian Ocean anomalously cool. Drives wet conditions over East Africa and dry conditions over Indonesia and northern Australia.
- Negative IOD: Western Indian Ocean cool, eastern Indian Ocean warm. Reverses the rainfall pattern; East Africa dries while Indonesia and northern Australia get heavy rainfall.
- Neutral IOD: The SST gradient is within the normal envelope. The IOD index oscillates on a roughly biennial timescale, though irregularly.
How ENSO and IOD interact
ENSO and IOD frequently co-occur. Positive IOD events tend to develop alongside El Niño. The two together produce reinforced impacts: drought over Indonesia and Australia, heavy rainfall over East Africa, and complex influences over the Indian monsoon. Negative IOD tends to accompany La Niña. The two modes are not perfectly correlated; some years show one without the other.
How a positive IOD can offset El Niño over the Indian monsoon
One of the most studied questions in Indian monsoon meteorology is whether IOD can counter El Niño impact. A positive IOD developing during an El Niño year sometimes maintains warm SST in the western Indian Ocean, supporting moisture transport into the monsoon. The 1997 strong El Niño produced near-normal Indian monsoon partly because a strong positive IOD co-developed.
The 1994 positive IOD year saw above-normal monsoon despite a Central Pacific (Modoki) El Niño, illustrating that a strong IOD signal can over-ride the Pacific suppression. The mechanism is widely accepted, even if its predictive value is still being refined.
Comparing ENSO and IOD influence on the monsoon
| ENSO state | IOD state | Typical monsoon outcome |
|---|---|---|
| El Niño | Positive IOD | Variable; IOD can partly offset deficit (1997 example) |
| El Niño | Negative IOD | Strongly suppressed monsoon, drought risk |
| El Niño | Neutral | Below-normal, with spatial variability |
| La Niña | Negative IOD | Above-normal monsoon (2020-22 triple-dip era) |
| La Niña | Positive IOD | Mixed; concentrated rainfall events possible |
| La Niña | Neutral | At or above normal |
| Neutral | Positive IOD | At or above normal monsoon outcome |
| Neutral | Negative IOD | Variable, regional impacts |
ENSO and the Madden-Julian Oscillation
What the MJO is
The Madden-Julian Oscillation (MJO) is the most prominent mode of intraseasonal variability in the tropics. It is a coupled atmospheric phenomenon, an eastward-propagating envelope of enhanced convection that circles the equator on a roughly 30 to 60 day timescale. Roland Madden and Paul Julian first described it in 1971.
How ENSO and MJO interact
ENSO and MJO operate on different timescales but interact. MJO activity in the Indian Ocean and western Pacific can trigger or amplify El Niño events through westerly wind bursts. During El Niño years, MJO propagation pathways shift and amplitudes change. Operational ENSO forecasters watch MJO state for short-term predictability of onset and termination phases.
How the MJO shapes monsoon intraseasonal variability
The Indian monsoon shows distinctive intraseasonal variability with active and break phases on roughly 30 to 60 day cycles, broadly tracking MJO propagation. Active phases bring concentrated rainfall; break phases bring dry spells of varying duration. ENSO state modulates the depth and frequency of break phases. The combined ENSO and MJO state is more predictive than either mode alone.
How ENSO reshapes weather across the continents
Region-by-region teleconnection patterns
How ENSO reshapes South American climate
What is the significance of ENSO's global impact footprint? ENSO is the single most important driver of cross-continental rainfall, temperature, and marine-fishery anomalies in the historical record. Its teleconnection signatures appear on every continent except Antarctica. Knowing which regions feel which phase, and through what pathways, underpins both climate-policy anticipation and country-level adaptation planning.
El Niño produces heavy rainfall and flooding along the South American Pacific coast (Peru, Ecuador) through warm-water-driven enhancement of coastal convection. The Peruvian anchoveta fishery, one of the world's largest single-species fisheries, collapses during strong El Niño as the cold Humboldt upwelling is suppressed. The 1997-98 event cost the fishery an estimated 1 billion US dollars.
Why El Niño dries eastern Australia
Eastern Australia experiences drought during El Niño as the Walker Circulation displaces ascending air away from the maritime continent. The 1982-83 Australian drought, the 1997-98 drought, and the 2002-03 Millennium Drought all coincided with El Niño events. La Niña reverses the pattern, bringing heavy rainfall and major floods (2010-11 Queensland; 2020-22 wide-area flooding).
How ENSO tilts North American winter weather
| Region | El Niño signal | La Niña signal | Notable example |
|---|---|---|---|
| South American Pacific coast | Heavy rainfall and flooding; Humboldt upwelling collapse | Cool dry conditions; strong upwelling | 1997-98 Peru flooding and anchoveta collapse |
| Eastern Australia | Drought, fire risk | Heavy rainfall, flooding | 2010-11 Queensland floods (La Niña) |
| East Africa short rains | Enhanced rainfall (with positive IOD) | Reduced rainfall, drought | 1997 East Africa flooding |
| Sahel (West Africa) | Reduced summer rainfall | Enhanced summer rainfall | Weaker signal than other regions |
| Southern Africa | Drier conditions | Wetter conditions | 2015-16 Southern African drought |
| North America (winter) | Warmer north, wetter south | Cooler north, drier south | 1997-98 mild US winter |
| Atlantic hurricanes | Suppressed (high wind shear) | Active season | 2020 record-active La Niña season |
| Indo-Pacific coral reefs | Bleaching events | Recovery windows | 1998, 2014-17, 2023-24 global bleaching |
How ENSO drives African rainfall swings
ENSO modulates African rainfall through teleconnection pathways. East African short rains (October-December) intensify during positive Indian Ocean Dipole years that co-occur with El Niño, contributing to the catastrophic 2019 floods across Somalia, Kenya, and Ethiopia. Southern African rainfall is suppressed during El Niño, with drought episodes documented across Zimbabwe, Zambia, and South Africa during 1992, 2015, and 2023 events.
How ENSO disrupts marine ecosystems
Marine ecosystem productivity is profoundly altered by ENSO. The Peruvian anchovy fishery, the world's largest single-species fishery, collapses during strong El Niño years through the suppression of equatorial upwelling. The 1972-73 collapse triggered worldwide fishmeal price spikes; the 1997-98 collapse reshaped global aquaculture supply chains. NOAA and IRI monitor SST anomalies through TAO buoys and satellite altimeters.
Why ENSO triggers coral bleaching
Coral bleaching events scale with ENSO-driven SST anomalies. Strong El Niño years produce mass-bleaching on the Great Barrier Reef, Indian Ocean reefs, and the Indo-Pacific coral triangle. The 1997-98, 2015-16, and 2023-24 El Niño events each triggered global-scale bleaching observed by NOAA Coral Reef Watch. IPCC AR6 attributes the rising bleaching frequency to compounded warming plus ENSO variability.
How ENSO triggers global food-supply shocks
ENSO drives concurrent food-supply shocks across multiple continents. Strong El Niños have produced simultaneous wheat-belt drought in Australia, soybean stress in Brazil, rice deficits in Indonesia and the Philippines, and pulse shortages in India. International agencies including the FAO and WFP coordinate humanitarian response based on ENSO-state seasonal outlooks.
What anthropogenic warming is doing to ENSO
Frequency, extremes and IPCC AR6 projections
How warming reshapes ENSO variability
Anthropogenic climate change is reshaping the ENSO system itself. Background ocean warming (the rise in mean SST), changes in atmospheric water-vapour content, and shifts in the trade-wind regime all modify the ENSO operating environment. The IPCC AR6 Working Group I (2021) assessed multiple lines of evidence on whether ENSO frequency, amplitude, and impact pattern are changing under sustained warming.
Is ENSO becoming more frequent under warming
Whether ENSO event count is increasing under climate change remains an active research question. Some studies argue for a rise in Modoki-type (central-Pacific) El Niño frequency since the 1980s. The pattern is broadly consistent with observed records, but the time series is short relative to ENSO's decadal variability. Distinguishing forced trends from natural variability needs long observational records and careful model intercomparison.
Why intensification of ENSO events is debated
What AR6 projects for extreme El Niño under warming
IPCC AR6 Working Group I assesses with medium confidence that extreme El Niño and La Niña events will become more frequent under continued warming, while ENSO-related rainfall variability is projected to intensify with higher confidence. The mechanism involves a flatter equatorial Pacific thermocline and a weakened Walker Circulation mean state.
What future projections of ENSO show
Future ENSO projections from IPCC AR6 indicate amplified rainfall variability over the tropical Pacific even where SST variability changes modestly. The amplification reflects atmospheric sensitivity to a warmer base state. India-specific consequences include greater monsoon variability between El Niño and La Niña years, with intensified drought-flood swings rather than a uniform shift in mean monsoon.
Where climate models still disagree
Significant model uncertainty remains around how ENSO itself changes under warming. The mean-state response (warmer Pacific) is robust across CMIP6 models, but the variability response (whether ENSO amplitude increases, decreases, or stays similar) varies between models. IPCC AR6 reports the spread as inter-model rather than observational uncertainty.
How India forecasts ENSO and prepares for its impacts
From IMD forecasts to drought-readiness systems
How India forecasts the seasonal monsoon
The India Meteorological Department issues seasonal forecasts of the southwest monsoon in two stages: a preliminary forecast in mid-April and an updated forecast in late May or early June. The methodology has shifted from purely statistical regression (since the 1980s) toward dynamical ensemble forecasts using coupled ocean-atmosphere models. ENSO state is a primary input, alongside IOD state, sea-ice extent, and Eurasian snow cover.
How the IMD monitors ENSO in real time
IMD operates the Pune-based Climate Prediction Group and the National Weather Forecasting Centre. Real-time ENSO monitoring draws on TAO/TRITON buoy data, satellite SST products, and reanalysis fields. IMD issues monthly ENSO bulletins and contributes to World Meteorological Organization regional climate outlooks. Coordination with the Ministry of Earth Sciences and IITM gives it access to the country's leading climate research.
How the monsoon forecasting models work
India's monsoon forecasting infrastructure integrates statistical and dynamical models. The IMD operational forecast combines a sixteen-indicator statistical framework with the IITM-ESM Earth System Model and the NMME multi-model ensemble. The Monsoon Mission has invested in indigenous coupled-model development since 2012, raising lead-time skill from sub-seasonal to multi-month outlooks.
How early-warning systems function
Early warning systems for ENSO-driven drought rest on the IMD long-range forecast plus state-level early-warning networks. The Central Water Commission monitors reservoir levels; the National Crop Forecast Centre tracks crop progression; the State Disaster Management Authorities issue alerts. Mission Mausam targets sub-district-level resolution by 2030.
How climate-resilient agriculture buffers ENSO shocks
The ICAR National Innovations in Climate Resilient Agriculture (NICRA) programme develops drought-tolerant cultivars, water-efficient cropping systems, and locally calibrated extension advisories. Over 1,800 climate-resilient cultivars are released across cereals, pulses, oilseeds, and horticulture, scaled through Krishi Vigyan Kendra district networks across vulnerable agro-ecological zones.
How India prepares for drought years
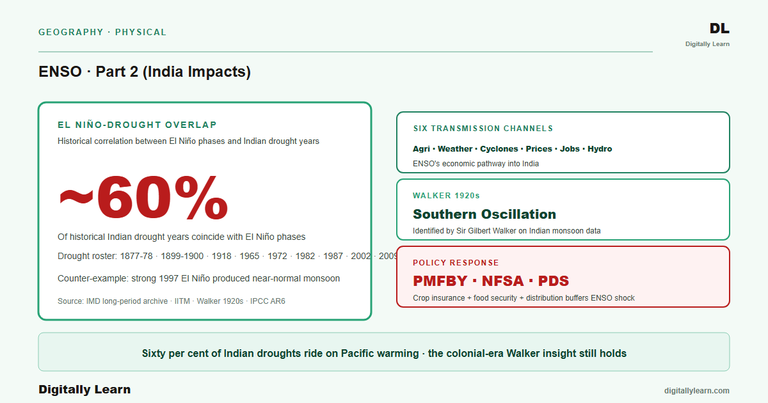
Drought preparedness rests on the NDMA Drought Management Plan plus state-level contingency frameworks. PMFBY crop insurance, MGNREGA wage relief, FCI buffer-stock release, and PDS supply assurance form the rural-distress response. The 2015 and 2018 drought episodes tested and refined the framework, with documented learnings for future ENSO-flagged years.
How water resources are managed in ENSO years
Water-resource management during El Niño years requires advance reservoir-rule modification, groundwater extraction limits under Atal Bhujal Yojana, and inter-state allocation review. The Central Water Commission coordinates with state irrigation departments to optimise the limited stored water across competing kharif and rabi demands. Watershed-development programmes under PMKSY supplement the operational response.
Major ENSO events that shaped the historical record
Worked case studies from 1877 to 2024
The major El Niño events on record
- 1877-78: Among the strongest historical El Niño events; coincided with the Great Famine in India, the Yellow River flood crisis in China, and Brazilian drought.
- 1972-73: Strong El Niño coinciding with one of India’s worst 20th-century droughts and a major Peruvian fishery collapse.
- 1982-83: Extreme El Niño, peak Niño 3.4 anomaly around plus 2.2 degrees Celsius (NOAA ONI ERSST.v5); severe Australian drought; Galapagos ecosystem disruption.
- 1997-98: Strongest El Niño in the modern record at the time; peak Niño 3.4 anomaly approximately plus 2.4 degrees Celsius; near-normal Indian monsoon (canonical break-point example); first documented global coral bleaching (1998).
- 2015-16: Extreme El Niño slightly exceeding 1997-98 in peak intensity per NOAA ONI ERSST.v5; peak Niño 3.4 anomaly approximately plus 2.6 degrees Celsius; warmest calendar year on record at the time; amplified the 2014-2017 marine heat wave that drove the third (and longest) global coral bleaching event; Indian monsoon deficit of about 14 per cent.
- 2023-24: Strong El Niño peaking in boreal winter 2023-24; warmest calendar year on record; fourth global coral bleaching event declared by NOAA in April 2024.
Case study: the 1997-98 El Niño
The 1997-98 event is the canonical strong El Niño. Niño 3.4 SST anomaly peaked at approximately plus 2.4 degrees Celsius (NOAA Oceanic Niño Index ERSST.v5, NDJ peak). Global impacts included Indonesian and Australian drought, South American flooding (Peru and Ecuador), African Sahel drought, Pacific coral bleaching, and a Galapagos marine ecosystem crash.
Crucially for Indian meteorology, the 1997 strong El Niño produced near-normal Indian monsoon rainfall. This break-point catalysed the realisation that ENSO is one driver among several for the Indian monsoon. It also prompted the IOD discovery framing by Saji et al. 1999.
Case study: the 2015-16 El Niño
The 2015-16 El Niño matched or slightly exceeded 1997-98 in peak intensity per NOAA ONI ERSST.v5, with a peak Niño 3.4 anomaly of about plus 2.6 degrees Celsius (NDJ peak). Global impacts included widespread coral bleaching as part of the third global event (2014-17, the longest documented), while Indonesian peat-land fires produced severe regional haze.
For India, the 2015 South Indian heat wave caused an estimated 2,300 deaths, Ethiopia and Southern Africa saw drought, and the Chennai November 2015 floods came through an enhanced northeast monsoon. The Indian southwest monsoon recorded a 14 per cent deficit.
The major La Niña episodes on record
- 1988-89: Strong La Niña; above-normal Indian monsoon; below-normal North Atlantic hurricane season.
- 1998-2001 triple-dip: Three consecutive La Niña years following the 1997-98 El Niño collapse; Australian wet conditions.
- 2010-2012 double-dip: Heavy rainfall and flooding in eastern Australia (the 2010-11 Queensland floods); above-normal Indian monsoon.
- 2020-2022 triple-dip: First triple-dip La Niña of the 21st century (and the third documented in the modern satellite-era record, after 1973-76 and 1998-2001); three consecutive above-normal Indian monsoons; sustained Australian and South Asian flooding.
How ENSO drove Indian agricultural crises
| Year | ENSO state | Headline India impact | Headline global impact |
|---|---|---|---|
| 1972-73 | Strong El Niño | Drought, food crisis (PL-480 imports) | Peruvian anchoveta collapse |
| 1982-83 | Extreme El Niño | Drought, Maharashtra famine | Australian drought, Galapagos crash |
| 1997-98 | Extreme El Niño | Near-normal monsoon (canonical break-point) | First global coral bleaching |
| 2002 | Moderate El Niño | 19 per cent monsoon deficit, food-grain shock | Australian Millennium Drought began |
| 2009 | Moderate El Niño | 22 per cent deficit, NFSA reform catalyst | Pulse and oilseed price spike |
| 2014-15 | Back-to-back moderate | 12 per cent and 14 per cent deficits | PMFBY launched 2016 |
| 2015-16 | Extreme El Niño | Heat wave ~2,300 deaths; Chennai floods | Third global coral bleaching event (2014-17); warmest year on record |
| 2020-22 | Triple-dip La Niña | 3 consecutive above-normal monsoons | Australian and South Asian flooding |
| 2023-24 | Strong El Niño | 6 per cent deficit; spatially concentrated | 4th global coral bleaching; warmest year on record |
How ENSO aligns with Indian drought years
India's most severe historical droughts coincide with strong El Niño years. 1972, 1987, 2002, 2009, and 2015 are the canonical ENSO-driven drought years on the all-India seasonal rainfall record. Each produced rainfall deficits exceeding ten per cent, food-grain output drops of five to fifteen per cent, and significant rural distress. The institutional response across these decades shows progressive improvement in forecasting and policy buffering.
Critical Analysis: Is ENSO the Dominant Driver, Why Some El Niño Years Are Normal, Declining Predictability, Regional Factors, Climate Resilience
Critical Analytical Themes for UPSC
Is ENSO the dominant driver of the Indian monsoon
ENSO is the single strongest external driver of inter-annual Indian monsoon variability, but it is not deterministic. The Indian Ocean Dipole, Madden-Julian Oscillation, Eurasian snow cover, Atlantic SST patterns, and aerosol forcing all contribute to the outcome in any given year.
The 1997 near-normal monsoon despite a strong El Niño illustrates the offset capacity of competing modes. The 1994 above-normal monsoon under a Central Pacific (Modoki) El Niño paired with a strong positive IOD is a second example. The 2014-15 deficit during a moderate El Niño shows how the response varies across event strengths. Treating ENSO as a probability-shifter, not a deterministic predictor, is the operational stance of IMD.
Why some El Niño years still bring normal monsoon rainfall
Three mechanisms can offset El Niño's monsoon-suppressing effect.
- Mechanism one: a co-developing positive Indian Ocean Dipole that maintains western Indian Ocean SST.
- Mechanism two: a favourable MJO phase during the monsoon onset period.
- Mechanism three: favourable Eurasian snow cover and Atlantic SST conditions. The 1997 case exemplifies the IOD-offset mechanism; single-mode predictions fail in roughly one in three years.
Why the ENSO-monsoon link is weakening
Empirical evidence from the last three decades shows that the ENSO-monsoon correlation has weakened. The classical inverse relationship has broken down in years like 1997 (strong El Niño, normal monsoon) and 2019 (weak El Niño, above-normal monsoon offset by positive IOD). IITM Pune research attributes the weakening to climate-change interference plus growing IOD-MJO modulation strength.
Which regional climate factors matter beyond ENSO
Regional climatic factors beyond ENSO increasingly modulate Indian monsoon outcomes. The Indian Ocean Dipole, Madden-Julian Oscillation, Eurasian snow cover, Tibetan-Plateau heating, and Atlantic SST patterns all contribute to inter-annual variability. IMD long-range forecasts now integrate up to sixteen indicators reflecting this multi-driver reality.
How states build ENSO into resilience planning
Climate resilience planning at the state level increasingly accounts for ENSO state. Maharashtra, Karnataka, Andhra Pradesh, and Telangana now publish ENSO-aware contingency crop calendars. NICRA-led district vulnerability assessments build ENSO state into adaptation planning, with insurance-driven crop switching emerging as a key buffering mechanism.
How warming amplifies ENSO impacts overall
Anthropogenic climate change overlays the ENSO baseline. The warming background shifts the absolute SST that any given Niño-3.4 anomaly delivers, meaning a moderate El Niño in 2024 produces atmospheric impacts that would have required a strong El Niño in the 1990s. IPCC AR6 documents this background-warming-amplification of ENSO impacts as a central finding.
ENSO research frontier and operational forecasting in 2026
The 2023-24 El Niño produced confirmed drought in southern Africa and northern South America. It also drove marine heat waves across the tropical Pacific and contributed to the warmest calendar year on global record. The 2020-2022 triple-dip La Niña intensified Australian flooding; the 2022 eastern-Australia floods were among the costliest on record. The same La Niña amplified the Indian summer monsoon across all three years.
Three contemporary frontiers shape the research and forecast agenda. The IPCC AR6 Working Group I assessed with medium confidence that extreme El Niño and La Niña events will increase in frequency under continued warming, while mean-state ENSO amplitude projections still diverge across CMIP6 models.
The North American Multi-Model Ensemble (NMME) consolidates dynamical ENSO forecasts from multiple modelling centres, raising forecast skill at the six-to-nine-month horizon. The India Meteorological Department's Monsoon Mission and Mission Mausam programmes integrate ENSO state with Indian Ocean Dipole forecasting for the long-range monsoon outlook.
Part 3 (ENSO impacts on India) will carry these global-impact frameworks into the India-specific monsoon-agriculture-cyclone context. The teleconnection mechanisms and modulating phenomena established here are the foundation that the India-impacts part will build on.
Prelims MCQ practice
Each question below tests one specific concept on the topic. Click to reveal the answer and a full option-wise explanation.
Q1. Consider the following statements about the Indian Ocean Dipole (IOD):
- IOD is the irregular oscillation of sea-surface temperatures between western and eastern equatorial Indian Ocean.
- Positive IOD has warmer-than-normal SSTs in the western Indian Ocean and cooler-than-normal SSTs in the eastern Indian Ocean.
- Positive IOD is generally associated with stronger Indian Southwest Monsoon, often offsetting El Nino-induced deficit.
Which of the statements given above are correct?
- 1 and 2 only
- 2 and 3 only
- 1 and 3 only
- 1, 2 and 3
Show answer and explanation
Answer: 1, 2 and 3
Explanation.
Correct: d (1, 2 and 3). All three statements are correct. IOD is the irregular Indian-Ocean SST oscillation between western and eastern equatorial Indian Ocean. Positive IOD has warmer western and cooler eastern (relative to normal). Positive IOD typically supports Indian Southwest Monsoon, sometimes offsetting concurrent El Nino-induced deficit (2019 monsoon was a strong-positive-IOD year that mitigated weak-El Nino impact).
Q2. Consider the following statements about the Pacific Decadal Oscillation (PDO):
- PDO is a long-lived ENSO-like pattern of Pacific climate variability with characteristic timescales of 20-30 years.
- PDO modulates the frequency and intensity of ENSO events through its multi-decadal phase shifts.
Which of the statements given above is/are correct?
- 1 only
- 2 only
- Both 1 and 2
- Neither 1 nor 2
Show answer and explanation
Answer: Both 1 and 2
Explanation.
Correct: c (Both 1 and 2). Statement 1 is correct: PDO is the multi-decadal (20-30 year) ENSO-like Pacific climate variability pattern. Statement 2 is correct: PDO modulates ENSO frequency/intensity through its multi-decadal phase shifts; warm-PDO phases typically host more frequent strong El Ninos.
Q3. Consider the following statements about the Madden-Julian Oscillation (MJO):
- MJO is a 30-60 day tropical atmospheric oscillation involving eastward-propagating areas of enhanced and suppressed convection.
- MJO interacts with ENSO and the Indian Monsoon active-break cycle.
Which of the statements given above is/are correct?
- 1 only
- 2 only
- Both 1 and 2
- Neither 1 nor 2
Show answer and explanation
Answer: Both 1 and 2
Explanation.
Correct: c (Both 1 and 2). Statement 1 is correct: MJO is a 30-60 day tropical atmospheric oscillation with eastward-propagating convection cells. Statement 2 is correct: MJO interacts with both ENSO (some MJO events trigger El Nino warm-water surges) and the Indian Monsoon active-break cycle (MJO phases 2-3 favour active monsoon, 7-8 favour break).
Q4. Consider the following statements about the North Atlantic Oscillation (NAO):
- NAO is the pressure see-saw between the Icelandic low and Azores high in the North Atlantic.
- NAO shows a teleconnection signature with the Indian Western Disturbance winter-rainfall sub-system.
- NAO is the same phenomenon as the Southern Oscillation, just located in the Northern Hemisphere.
Which of the statements given above are correct?
- 1 and 2 only
- 2 and 3 only
- 1 and 3 only
- 1, 2 and 3
Show answer and explanation
Answer: 1 and 2 only
Explanation.
Correct: a (1 and 2 only). Statement 1 is correct: NAO is the pressure see-saw between Icelandic low and Azores high. Statement 2 is correct: NAO shows teleconnection signature with Indian Western Disturbance winter-rainfall sub-system over the Mediterranean and northwest India. Statement 3 is wrong: NAO and Southern Oscillation are SEPARATE atmospheric oscillations in different hemispheres, NOT the same phenomenon.
Q5. Consider the following statements about ENSO impacts on global weather patterns:
- El Nino events are generally associated with drought over Indonesia, eastern Australia, and southern Africa.
- El Nino events are generally associated with flooding over the western coast of South America and the southwestern United States.
- ENSO has no detectable teleconnection signature on any region outside the equatorial Pacific.
Which of the statements given above are correct?
- 1 and 2 only
- 2 and 3 only
- 1 and 3 only
- 1, 2 and 3
Show answer and explanation
Answer: 1 and 2 only
Explanation.
Correct: a (1 and 2 only). Statement 1 is correct: El Nino typically brings drought to Indonesia, eastern Australia, southern Africa. Statement 2 is correct: El Nino typically brings flooding to coastal Peru/Ecuador and southwestern US. Statement 3 is wrong: ENSO has STRONG teleconnections to multiple global regions (Indian Monsoon, African Sahel, Australian rainfall, North American Pacific Northwest); the entire study of ENSO impacts is built on these teleconnections.
Q6. Consider the following statements about Climate-Smart Agriculture institutional architecture relevant to ENSO-related research:
- The Climate-Smart Village (CSV) approach in India is led by the Climate Change, Agriculture and Food Security (CCAFS) programme.
- CCAFS operates under the Consultative Group on International Agricultural Research (CGIAR) network.
- The International Crops Research Institute for the Semi-Arid Tropics (ICRISAT) is one of the CGIAR research centres.
Which of the statements given above are correct?
- 1 and 2 only
- 2 and 3 only
- 1 and 3 only
- 1, 2 and 3
Show answer and explanation
Answer: 1, 2 and 3
Explanation.
Correct: d (1, 2 and 3). All three statements are correct (UPSC Prelims 2021 Q59). CSV is CCAFS-led; CCAFS under CGIAR; ICRISAT at Patancheru is a CGIAR research centre. The institutional chain is critical for ENSO-related climate-resilient agricultural research in India.
Sources and Further Reading
- NCERT Class 11 India: Physical Environment, Chapter 4 – Climate
- IPCC AR6 Working Group I, Chapter 4 (Future Global Climate) and Chapter 8 (Water Cycle Changes)
- NOAA Climate Prediction Center, ENSO diagnostic discussion
- India Meteorological Department, Long Range Forecast and Monsoon Mission outputs
- Indian Institute of Tropical Meteorology, Monsoon Mission and IITM-ESM
- Ministry of Earth Sciences, Mission Mausam
- Bureau of Meteorology Australia, ENSO Wrap-Up
- International Research Institute for Climate and Society, ENSO forecasts and analysis
- Wikipedia, El Niño-Southern Oscillation overview
- Wikipedia, Indian Ocean Dipole
Editorial Disclaimer
This explainer summarises ENSO global teleconnections, coral bleaching, and IPCC AR6 projections for UPSC preparation. Figures and assessments are drawn from the cited authoritative sources and should be checked against the latest primary releases before use. It is a study aid, not a substitute for the original IPCC, NOAA, and IMD documents.