Overview
Previous Year UPSC-CSE Questions By the end you will be able to draft model answers for the following UPSC questions. Each question carries a collapsible framework showing how to approach it in the exam.
- UPSC Mains 2020 GS-IIndia has immense potential for solar energy though there are regional variations in its developments. Elaborate.
How to structure the answer in the exam
Introduction: State that India has among the world's highest solar potential but uneven development across states (covered in sec-1).
Body (sub-themes to develop):
- Scale: solar is the fastest-growing source, 100 GW in Jan 2025 and over 150 GW by 2026. [Article ss-1-1]
- Regional variation: the sunny north-west and southern plateau lead, hosting the largest parks. [Article ss-1-2]
- Examples: Bhadla (Rajasthan), Pavagada (Karnataka), Kurnool (Andhra Pradesh). [Article ss-1-2]
- Why it is uneven: solar insolation, available land and state policy differ across India. [Article ss-1-2]
Conclusion: Conclude that realising the potential needs balanced development and the storage to use the power.
- UPSC Mains 2022 GS-IIIDo you think India will meet 50 percent of its energy needs from renewable energy by 2030? Justify your answer. How will the shift of subsidies from fossil fuels to renewables help achieve the above objective? Explain.
How to structure the answer in the exam
Introduction: State that India is on a strong trajectory, having crossed 50 per cent non-fossil capacity in 2025 (covered in sec-1, sec-4).
Body (sub-themes to develop):
- Progress: non-fossil capacity passed 50 per cent in 2025; the target is 500 GW by 2030. [Article ss-1-1, ss-4-1]
- Constraint: storage and grid limits, the duck curve and curtailment, must be solved. [Article sec-2, ss-4-2]
- Subsidy shift: moving support from fossil fuels to renewables lowers their relative cost and redirects investment. [Article ss-4-2]
- Result: faster clean-energy adoption and a level playing field against coal. [Article ss-4-2]
Conclusion: Conclude that the target is achievable if storage scales and subsidy reform reinforces the price advantage of clean energy.
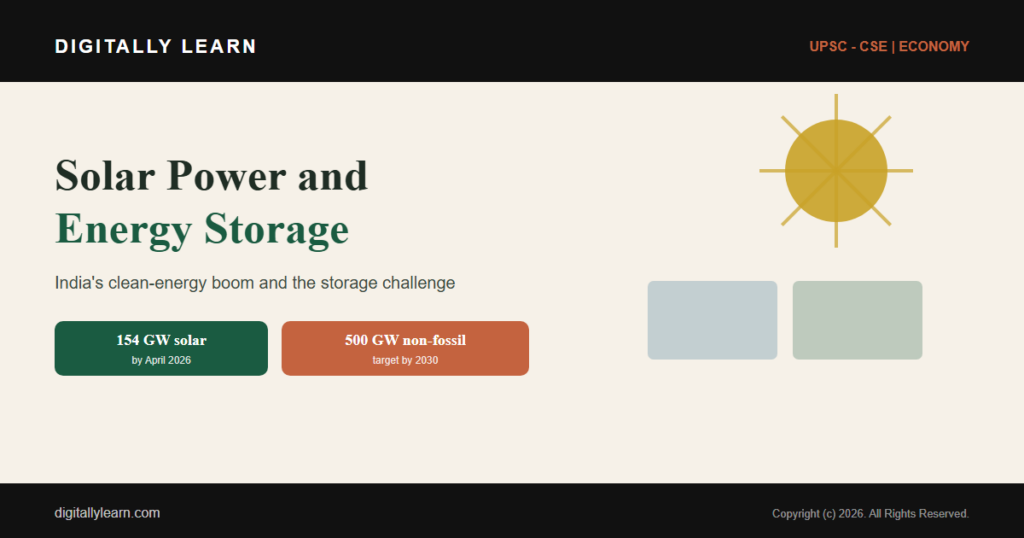
Solar power is India's fastest-growing electricity source, with installed capacity reaching 154.2 GW by April 2026; because solar generation peaks at midday while demand peaks in the evening (the duck curve), and surplus power is otherwise curtailed, energy storage such as batteries and pumped hydro is now central to meeting India's target of 500 GW of non-fossil capacity by 2030.
India's solar power: scale and spread
How far India's solar capacity has come
Solar has become India's fastest-growing source of electricity. The country met its target of 100 GW of installed solar capacity on 31 January 2025, and kept climbing: capacity stood at about 108 GW in April 2025 and reached 154.2 GW by April 2026.
This boom sits inside a wider clean-energy shift. By April 2026 India's renewable capacity had reached about 279 GW, and non-fossil sources crossed 50 per cent of total installed capacity, a milestone India reached in 2025.
Where India's solar power is generated
India's solar power is concentrated where the sun is strongest. The sunny north-west, above all Rajasthan and Gujarat, and the southern plateau states of Karnataka and Andhra Pradesh host the country's giant solar parks, which is why solar development shows marked regional variation.
| Solar park | Capacity | State |
|---|---|---|
| Bhadla | 2,245 MW | Rajasthan |
| Pavagada | 2,050 MW | Karnataka |
| Kurnool | 1,000 MW | Andhra Pradesh |
The flagship sites are huge. The Bhadla Solar Park in Rajasthan, at 2,245 MW, was the world's largest as of March 2020; the Pavagada park in Karnataka follows at 2,050 MW, and Kurnool in Andhra Pradesh at 1,000 MW. The leaders are the sun-rich, land-rich states.
Why solar power needs energy storage
The duck curve: when supply and demand do not match
Solar power has one built-in problem: it arrives when the sun is up, not when people need it most. Generation peaks at midday, but household and commercial demand peaks in the evening, after sunset, when solar output has fallen to zero.
Plotted over a day, the gap between midday supply and evening demand traces the shape engineers call the duck curve. Bridging it means capturing the midday surplus and releasing it in the evening, which is exactly what energy storage does.
Curtailment: when clean power is wasted
When the grid cannot absorb or carry away all the solar power on offer, some of it is simply switched off, a waste called curtailment. By 2025 this was happening in notable amounts; about 0.9 TWh of solar generation was curtailed in October 2025 alone.
Curtailment rises as the share of solar grows, because more midday power chases the same daytime demand. It is the clearest signal that generation has run ahead of the storage and grid capacity needed to use it, turning a clean-energy success into wasted electricity.
The energy-storage solutions
Battery energy storage systems (BESS)
The most flexible answer is the battery energy storage system, or BESS, which charges on cheap midday solar and discharges into the evening peak. Falling costs are making this practical: battery pack prices dropped to about 55 US dollars per kilowatt-hour by May 2025.
Cheaper storage is already reshaping the market. Combined solar-plus-storage bids fell to around 3.1 to 3.5 rupees per unit in 2025, and battery backup is widespread at the household level, with more than one crore homes using it during power cuts.
Pumped hydro and other forms of storage
Batteries are not the only option. Pumped hydro storage uses surplus power to pump water into an upper reservoir and then releases it through turbines to generate electricity when demand rises; India has a vast potential for it and it remains the largest form of grid storage.
Other approaches add flexibility. Surplus solar can be used to make green hydrogen as a storable fuel, while better grid evacuation and shifting demand to the daytime, known as demand-side management, reduce how much storage is needed in the first place.
Targets, policy and the storage imperative
The 2030 and 2070 clean-energy targets
India's solar push serves two headline pledges: 500 GW of non-fossil capacity by 2030, and net-zero emissions by 2070. Crossing 50 per cent non-fossil installed capacity in 2025 put the country ahead of schedule on the first milestone.
Solar is the workhorse of these targets because it is now the cheapest and fastest source to build. Reaching the 2030 goal, however, depends not only on adding panels but on being able to use the power they produce around the clock.
Why storage and subsidy reform decide the outcome
Without storage, every gigawatt of new solar adds to midday surplus and curtailment rather than to usable supply, and it strains a grid built for steady fossil-fuel output. Storage is therefore the enabler that turns installed capacity into a dependable, round-the-clock supply.
Policy choices matter just as much. Shifting public support away from fossil fuels and towards renewables and storage lowers their relative cost, redirects investment to clean energy, and removes the price advantage that locks in coal, which is how a reallocation of subsidies can accelerate the move to the 2030 target.
Institutions and India's solar leadership
Who runs India's solar programme
The solar push is steered by the Ministry of New and Renewable Energy, which sets policy and targets, with the Solar Energy Corporation of India tendering large projects and the Central Electricity Authority planning the grid that must carry the new power.
Government schemes spread solar beyond the big parks. Programmes for rooftop solar and for solar pumps in agriculture extend generation to homes and farms, broadening both the base of capacity and the constituency for clean energy.
The International Solar Alliance
India also leads on the world stage through the International Solar Alliance, launched in 2015 by Prime Minister Narendra Modi and President Francois Hollande of France, and headquartered in New Delhi.
The alliance brings together 121 sun-rich countries and aims to mobilise one trillion US dollars of solar investment by 2030. It is the centrepiece of India's solar diplomacy and its claim to leadership of the global clean-energy transition.
How this appears in the UPSC exam
Solar potential, the renewable target and storage
This topic spans both GS Paper I geography and GS Paper III economy and energy. The high-yield points worth fixing in memory are few.
- India crossed 100 GW of solar in January 2025 and over 150 GW by 2026, the fastest-growing power source.
- Solar potential is highest in the sunny north-west (Rajasthan, Gujarat) and the southern plateau, hence regional variation.
- The duck curve and curtailment explain why storage, battery and pumped hydro, is now essential.
- India targets 500 GW of non-fossil capacity by 2030 and net zero by 2070, and leads the International Solar Alliance.
A strong answer connects the three threads: India's huge but uneven solar potential, the storage and grid problem that limits its use, and the policy and subsidy choices that decide whether the 2030 target is met.
Prelims MCQ practice
Each question below tests one specific concept on the topic. Click to reveal the answer and a full option-wise explanation.
Q1. The Bhadla Solar Park, once the world's largest, is located in:
- Gujarat
- Rajasthan
- Karnataka
- Andhra Pradesh
Show answer and explanation
Answer: Rajasthan
Explanation.
The Bhadla Solar Park (2,245 MW) is in Rajasthan and was the world's largest solar park as of March 2020. Pavagada is in Karnataka and Kurnool in Andhra Pradesh. Hence (b).
Q2. The term 'duck curve' in the power sector refers to:
- the rise in coal demand in winter
- the mismatch between midday solar supply and evening demand
- the daily variation in hydropower
- the seasonal change in wind speed
Show answer and explanation
Answer: the mismatch between midday solar supply and evening demand
Explanation.
The duck curve describes how solar generation peaks at midday while electricity demand peaks in the evening, creating a supply-demand mismatch that storage must bridge. Hence (b).
Q3. With reference to India's renewable energy, consider the following statements:
- India crossed 50 per cent of its total installed capacity from non-fossil sources in 2025.
- India has a target of 500 GW of non-fossil capacity by 2030.
- India has committed to net-zero emissions by 2050.
Which of the statements given above is/are correct?
- 1 and 2 only
- 2 and 3 only
- 1 and 3 only
- 1, 2 and 3
Show answer and explanation
Answer: 1 and 2 only
Explanation.
Statements 1 and 2 are correct. Statement 3 is wrong: India's net-zero target year is 2070, not 2050. Hence 1 and 2 only.
Q4. The International Solar Alliance (ISA) is headquartered in:
- Paris
- Abu Dhabi
- New Delhi (Gurugram)
- Geneva
Show answer and explanation
Answer: New Delhi (Gurugram)
Explanation.
The ISA, launched in 2015 by India and France, is headquartered in India (Gurugram, near New Delhi). It brings together 121 solar-rich countries. Hence (c).
Q5. 'Curtailment' of solar power refers to:
- the gradual fall in panel efficiency over time
- switching off available solar generation the grid cannot absorb
- the cost of dismantling old solar plants
- the loss of power in transmission lines
Show answer and explanation
Answer: switching off available solar generation the grid cannot absorb
Explanation.
Curtailment is the deliberate reduction of available solar output when the grid cannot absorb or evacuate it, wasting clean power; about 0.9 TWh was curtailed in October 2025. Hence (b).
Q6. Consider the following statements about energy storage in India:
- Pumped hydro storage uses surplus power to pump water uphill and releases it to generate electricity later.
- Battery energy storage systems can charge on midday solar and discharge in the evening peak.
- Energy storage has no role in meeting India's non-fossil capacity target.
Which of the statements given above is/are correct?
- 1 and 2 only
- 2 and 3 only
- 1 and 3 only
- 1, 2 and 3
Show answer and explanation
Answer: 1 and 2 only
Explanation.
Statements 1 and 2 correctly describe pumped hydro and battery storage. Statement 3 is wrong: storage is central to using the solar power that meets the target. Hence 1 and 2 only.
Sources and Further Reading
Editorial Disclaimer
This article explains solar power and energy storage in India for UPSC preparation, drawing on standard government and reference sources. Figures reflect the cited authorities.