“The Ancient Origins of Printing: From China to Europe”

Sci-Five | The Hindu Science Quiz: On Printing

The Evolution of Printing: From Wooden Blocks to Moveable Type

Printing has played a crucial role in the dissemination of knowledge and the advancement of human civilization. Throughout history, various printing techniques have emerged, each with its own significance and impact. In this article, we will explore the evolution of printing, from the earliest known form in ancient China to the introduction of moveable type in Europe.

1. The Earliest Form of Printing: Xylography

The earliest known form of printing in ancient China was xylography, which involved cutting calligraphic texts into wooden blocks. This technique allowed for the reproduction of texts through the creation of prints. Xylography was developed by the Chinese around the 8th century and played a crucial role in preserving and spreading knowledge.

2. The Oldest Dated Printed Book: Diamond Sutra

In 868 CE, the oldest dated complete printed book using block printing was discovered in Dunhuang, China. This book, known as the Diamond Sutra, is considered a significant milestone in the history of printing. It bears the date of 11 May 868 CE, showcasing the Chinese mastery of block printing techniques during that time.

3. The Invention of Moveable Type: Johannes Gutenberg

In Europe, Johannes Gutenberg, a goldsmith from Mainz, Germany, revolutionized the printing industry by inventing the moveable type printing press. This allowed for the arrangement of individual metal letters to form words and sentences, making the printing process more efficient and versatile. Gutenberg’s invention paved the way for the mass production of books and the widespread dissemination of knowledge.

4. The Arrival of Printing in Britain: William Caxton

The printing press arrived in Britain in the 15th century, thanks to William Caxton. In 1476, Caxton printed Geoffrey Chaucer’s famous work, “The Canterbury Tales,” marking the beginning of the printing industry in Britain. This development played a vital role in making literature and information more accessible to the general public.

5. The Introduction of Lithography: Aloys Senefelder

Aloys Senefelder, an inventor from Germany, introduced a new printing method called lithography in the late 18th century. Lithography allowed for the reproduction of handwriting and drawings directly on a smooth stone surface. Senefelder’s technique, using a slightly waxy or greasy tool, offered an alternative to traditional printing methods and opened up new possibilities for artistic expression.

Significance and Features

The evolution of printing techniques has had a significant impact on society and culture:

  • Preservation of Knowledge: Printing has played a crucial role in preserving and disseminating knowledge, allowing information to be passed on from one generation to another.
  • Mass Production: The introduction of moveable type and printing presses facilitated the mass production of books, making them more affordable and accessible to a wider audience.
  • Spreading Ideas: Printing has been instrumental in spreading ideas, revolutions, and scientific discoveries, contributing to the advancement of human civilization.
  • Artistic Expression: Printing techniques like lithography have allowed artists to reproduce their artworks and expand the reach of their creativity.

Objectives of Printing

The primary objectives of printing include:

  • Disseminating Information: Printing enables the widespread distribution of information, ideas, and knowledge.
  • Preserving Cultural Heritage: Printing helps in preserving cultural heritage by reproducing important texts and artifacts.
  • Educational Purposes: Printing supports education by providing textbooks, study materials, and resources for students and teachers.
  • Commercial Applications: Printing plays a vital role in industries such as publishing, advertising, packaging, and manufacturing.

Effects of Printing

The impact of printing on society and civilization has been tremendous:

  • Knowledge Revolution: Printing has sparked a knowledge revolution, democratizing access to information and transforming the way people learn and acquire knowledge.
  • Social Change: The widespread availability of printed materials has fueled social movements, political revolutions, and cultural shifts throughout history.
  • Economic Growth: The printing industry has contributed to economic growth by creating job opportunities, fostering innovation, and supporting various sectors.
  • Global Connectivity: Printing has helped connect people from different regions and cultures, fostering cross-cultural understanding and exchange of ideas.

Pros and Cons of Printing

While printing has brought numerous benefits, it also presents some challenges:

  • Pros of Printing:
    • Wide dissemination of information and knowledge.
    • Promotion of literacy and education.
    • Preservation of cultural heritage.
    • Economic growth and job creation.
  • Cons of Printing:
    • Environmental impact due to paper consumption and waste.
    • Cost and resources required for printing materials and equipment.
    • Potential for misinformation and dissemination of false or biased information.
    • Dependency on printed materials, limiting accessibility for certain populations with limited resources.

Fun Fact

Did you know that the Gutenberg Bible, printed by Johannes Gutenberg in the 15th century, is considered one of the most valuable and iconic books in the world? Only around 180 copies were printed, and today, they are highly sought after by collectors, with some copies selling for millions of dollars.

Mutiple Choice Questions

1) What was the earliest known form of printing in ancient China, which involved cutting calligraphic texts into wooden blocks?
a) Typography
b) Xylography
c) Lithography
d) Engraving

Explanation: The earliest known form of printing in ancient China, which involved cutting calligraphic texts into wooden blocks, is called Xylography. Around the 8th century, the Chinese had found a way of cutting calligraphic texts into wooden blocks that could be used to make prints.

2) Which ancient text, dated to 868 CE, is considered the oldest dated complete printed book of block printing, found in Dunhuang, China?
a) Gutenberg Bible
b) The Canterbury Tales
c) Diamond Sutra
d) Mesopotamian Seal

Explanation: The oldest dated complete printed book of block printing is the Diamond Sutra, found at Dunhuang in China, which bears the date of 11 May 868 CE.

3) Who is credited with inventing the movable type printing press in Europe?
a) Aloys Senefelder
b) Johannes Gutenberg
c) Geoffrey Chaucer
d) William Caxton

Explanation: Johannes Gutenberg, a goldsmith from Mainz, Germany, is credited with inventing the movable type printing press in Europe. He was the first to print with moveable type.

4) In which century did the printing press come to Britain, thanks to William Caxton?
a) 1400s
b) 1500s
c) 1600s
d) 1700s

Explanation: The printing press came to Britain in the 1400s when William Caxton printed Geoffrey Chaucer’s The Canterbury Tales.

5) Which printing method, invented by Aloys Senefelder, allowed for the reproduction of handwriting and drawings directly on a smooth stone surface?
a) Typography
b) Xylography
c) Engraving
d) Lithography

Explanation: Lithography, invented by Aloys Senefelder in the 1790s, allowed for the reproduction of handwriting and drawings directly on a smooth stone surface. He devised techniques for writing on a surface using a tool that was slightly waxy or greasy.

Brief Summary | UPSC – IAS

The article discusses the history of printing and its various forms. It mentions that the earliest known form of printing in ancient China was xylography, which involved cutting calligraphic texts into wooden blocks. The oldest dated complete printed book of block printing is the Diamond Sutra, found in Dunhuang, China, which dates back to 868 CE. Johannes Gutenberg is credited with inventing the movable type printing press in Europe. The printing press came to Britain in the 15th century, thanks to William Caxton. Aloys Senefelder invented lithography, a printing method that allowed for reproducing handwriting and drawings directly on a smooth stone surface.

New Zealand’s Right-Wing Surge: Labour Party’s Support Plunges as National Party and ACT Triumph

Back in business: On the New Zealand election result 


Impact of New Zealand Election: A Shift to the Right

Impact of New Zealand Election: A Shift to the Right

Significance

The recent national election in New Zealand has resulted in a significant shift towards right-wing politics, with the conservative National Party and its libertarian ally ACT gaining the majority of votes. This election marked a major erosion of popular support for the Labour Party, which had enjoyed a sweeping victory three years earlier.

Features

The election saw a rise in the vote share for the National Party, which increased from 26% in 2020 to 39%. Meanwhile, the Labour Party’s vote share collapsed from 50% to 27%. The Green Party, a Labour ally, won 11% of the votes, and ACT secured 9%.

Objectives

The National Party, under the leadership of Christopher Luxon, campaigned on promises to address the country’s economic woes, focusing on cutting interest rates and government spending. Their main objective is to bring the economy back on track and tackle issues such as high inflation and high interest rates.

Effects

The shift to a right-wing government in New Zealand will likely result in a departure from Labour’s welfarism policies. The new government will have to address the cost of living crisis and work towards reducing homelessness, child poverty, and inequality that have plagued the country for decades. However, a pro-business approach must be balanced with incremental redistribution to avoid exacerbating social disparities.

Pros and Cons

Pros:
– Potential economic reforms to stimulate growth and reduce inflation.
– Focus on addressing long-standing issues such as homelessness and child poverty.

Cons:
– Potential reduction in welfare programs, which may negatively impact vulnerable sections of society.
– Uncertainty around how the new government will handle foreign policy challenges, particularly balancing relations with the U.S. and China.

Fun Fact

New Zealand moved to a proportional representation system in 1993, with 2020 being the only time a single party secured an absolute majority in the country’s elections. The charismatic leadership of Jacinda Ardern during her handling of the COVID-19 crisis played a significant role in her party’s victory at that time.


Brief Summary | UPSC – IAS

New Zealand’s conservative National Party and libertarian ACT have won the majority of votes in the recent national election, indicating the country’s shift towards a right-wing government. The Labour Party of Prime Minister Chris Hipkins saw a significant decline in popular support, with its vote share dropping from 50% to 27%. The Green Party, a Labour ally, won 11% of the votes, and ACT secured 9%. This result marks a change from the previous election, where Labour dominated under the leadership of Jacinda Ardern. The economy was a key concern for voters, leading to the rise of National Party leader Christopher Luxon, who promises to address economic issues and reduce government spending.

“State of Working India 2023: Job Creation, Social Security, and Economic Challenges”

Did EFLU release backdated circulars during protests?

The Changing Landscape of Regular Wage Jobs in India

The share of workers with regular wages in India has experienced significant growth since 2004, according to a report titled “State of Working India 2023: Social Identities and Labour Market Outcomes” prepared by economists and researchers at the Azim Premji University. The report highlights the increase in regular job creation, with the country producing three million regular jobs annually between 2004 and 2017, and five million jobs from 2017 to 2019. However, the report also sheds light on the recent slowdown in job creation due to economic downturns and the COVID-19 pandemic.

The researchers discovered that only 6% of these regular wage jobs provide any form of social security, such as health insurance or accidental care insurance. The findings are based on data sourced from National Statistical Organisation surveys, census reports, periodic labour force surveys, and other government sources.

Over the years, the percentage of men working in regular jobs with fixed monthly or bi-weekly salaries has increased from 18% to 25%, while the proportion of women in such jobs has jumped from 10% to 25%.

Caste-based Segregation

The report also examines caste-based segregation in employment. In 2004, more than 80% of sons of casual wage workers engaged in casual employment, regardless of their caste. However, the incidence of better-quality work, such as regular salaried jobs, increased for non-SC/ST castes, reducing the percentage to 53% by 2018. Even among SC/ST castes, the percentage decreased, though to a lesser extent, from 86% to 76%. The study recognizes a decline in caste-based segregation and highlights that representation of SCs in waste management and sewerage decreased but increased slightly again in 2011.

Gender-based Earnings Disparities

The report suggests a reduction in gender-based earnings disparities over the past 20 years. In 2004, salaried women workers earned only 70% of what men earned. By 2017, this gap had narrowed, and women were earning 76% of men’s salaries. Since then, the gender pay gap has remained relatively constant till 2021-22, indicating some progress in addressing gender inequality in the labor market.

Effects of the COVID-19 Pandemic

The report delves into the impact of the COVID-19 pandemic on employment rates. Surprisingly, the unemployment rate was lower post-COVID than it was before the pandemic for all education levels. However, it remained above 15% for graduates, particularly concerning was the fact that it spiked to a staggering 42% for graduates under 25 years old. Additionally, the rate of women unemployment has risen due to a distress-led increase in self-employment. Prior to the pandemic, 50% of women were self-employed, but this number increased to 60% in the aftermath of COVID-19. Consequently, earnings from self-employment declined in real terms during this period, reaching only 85% of the pre-pandemic levels by the second quarter of 2021.

Significance

The findings of this report provide crucial insights into the changing dynamics of the Indian labor market, highlighting both the progress made in terms of regular wage job creation and the challenges the country faces in terms of providing social security benefits for workers. The report sheds light on the need for policies and interventions to bridge the ongoing gender-based earnings disparities and address caste-based segregation in employment. Additionally, the impact of the COVID-19 pandemic amplifies the urgency to prioritize employment opportunities for graduates, especially women, and ensure their financial stability.

Fun Fact

Did you know that the number of regular wage jobs created annually in India increased from three million between 2004 and 2017 to five million between 2017 and 2019? This signifies the efforts made to generate stable employment opportunities in the country and improve the livelihoods of its citizens.

Mutiple Choice Questions

1. According to the report, the share of workers with regular wage has increased since which year?
a) 2004
b) 2017
c) 2019
d) 2023

Explanation: According to the report, the share of workers with regular wage has increased since 2004.

2. How many regular jobs did the country create annually till 2017, according to the report?
a) 1 million
b) 3 million
c) 5 million
d) 10 million

Explanation: According to the report, the country created three million regular jobs annually till 2017.

3. Why did the pace of regular wage jobs creation decrease since 2019, according to the report?
a) Economic growth
b) Government policies
c) Economic slowdown and the pandemic
d) Increase in automation

Explanation: According to the report, the pace of regular wage jobs creation decreased since 2019 due to economic slowdown and the pandemic.

4. What percentage of regular wage jobs provide social security, according to the report?
a) 20%
b) 35%
c) 50%
d) 6%

Explanation: According to the report, only 6% of regular wage jobs provide any kind of social security.

5. What is the percentage increase in men working in regular jobs over the years, according to the report?
a) 7%
b) 10%
c) 18%
d) 25%

Explanation: According to the report, the percentage of men working in regular jobs has increased from 18% to 25% over the years.

6. How has gender-based earnings disparity changed in the last 20 years, according to the report?
a) Decreased
b) Increased
c) Remained constant
d) Fluctuated

Explanation: According to the report, gender-based earnings disparities have reduced in the last 20 years.

7. What is the unemployment rate among graduates under 25 years, according to the report?
a) 15%
b) 25%
c) 42%
d) 50%

Explanation: According to the report, the unemployment rate among graduates under 25 years is 42%.

8. What is the percentage of women who were self-employed before COVID, according to the report?
a) 40%
b) 50%
c) 60%
d) 70%

Explanation: According to the report, before COVID, 50% of women were self-employed.

9. What has happened to self-employment earnings post-COVID, according to the report?
a) Increased
b) Stayed the same
c) Decreased
d) Fluctuated

Explanation: According to the report, earnings from self-employment declined in real terms post-COVID.

Brief Summary | UPSC – IAS

A report from Azim Premji University reveals that the rate of regular wage job creation in India has slowed down since 2019 due to economic downturn and the pandemic. Only 6% of these jobs offer any form of social security, such as health insurance. However, the share of workers with regular wages has increased over the years, with men increasing from 18% to 25% and women increasing from 10% to 25%. Caste-based segregation in employment has also decreased, particularly among non-SC/ST castes. Gender-based earnings disparities have reduced, but unemployment rates remain high, especially for graduates and young women in self-employment.

Indian Economy to Grow at 6.5% Despite Oil Price & Climate Uncertainty, says NITI Aayog Official

Did EFLU release backdated circulars during protests?

The Indian Economy Set to Grow at 6.5% in the Current Fiscal Year, Says NITI Aayog Member

The Indian economy is projected to grow at around 6.5% in the current fiscal year, according to Arvind Virmani, a member of NITI Aayog. This growth is expected despite challenges such as high crude oil prices and increased uncertainty due to climate change. Mr. Virmani highlights the consistent increase in gross household savings in India as a positive indicator.

Significance

The projected growth of the Indian economy is significant as it indicates stability and resilience in the face of external challenges. It demonstrates the ability of the Indian economy to navigate through global fluctuations and maintain a reasonable growth rate. The increase in gross household savings also reflects the financial consciousness and saving habits of Indian households.

Features

According to Mr. Virmani, the fluctuations in global GDP have more or less balanced out for India, assuming normal changes. This suggests that India’s growth projection of 6.5% has been calculated by taking into account global economic fluctuations. He also emphasizes the importance of understanding how GDP is constructed to avoid misunderstandings and claims of inflated economic growth.

Objectives

The objective of projecting a 6.5% GDP growth rate is to provide a realistic outlook for the Indian economy in the current fiscal year. This projection serves as a guide for policymakers, businesses, and individuals to make informed decisions based on the expected economic growth. It also reassures investors and international agencies about India’s economic potential.

Effects

The projected GDP growth rate of 6.5% has several effects on different aspects of the economy. It instills confidence in businesses, leading to increased investments and expansion plans. It also creates job opportunities and promotes consumer spending, contributing to overall economic growth. Additionally, the increase in gross household savings reflects a healthier financial position for households, providing a cushion against unforeseen expenses.

Pros and Cons

The projected GDP growth rate of 6.5% has several pros, including economic stability, job creation, and increased investments. It indicates that the Indian economy is resilient and can withstand external challenges. However, there may be cons associated with high inflation due to rising crude oil prices. Inflation can impact the purchasing power of consumers, leading to decreased discretionary spending and potential economic slowdown.

Fun Fact

A fun fact related to the Indian economy is that it is the world’s sixth-largest economy by nominal GDP and the third-largest by purchasing power parity. India has made significant progress in recent years, becoming a major player in global trade and investment.

In conclusion, the projected GDP growth rate of 6.5% for the current fiscal year demonstrates the resilience and stability of the Indian economy. It highlights the increase in gross household savings and reaffirms India’s economic potential. However, challenges such as high crude oil prices and inflation should be effectively managed to ensure sustained economic growth.

Mutiple Choice Questions

1. According to NITI Aayog member Arvind Virmani, what is the projected GDP growth for the Indian economy in the current fiscal year?
a) 6.5% plus minus 0.5%
b) 7.2%
c) 9.1%
d) 6.83%

Explanation: Arvind Virmani projected that the GDP growth for the Indian economy in the current fiscal year is 6.5% plus minus 0.5%.

2. Which factor presents a risk for India’s economy, according to Arvind Virmani?
a) Climate change
b) Consumer debt
c) Crude oil prices
d) Falling household savings

Explanation: Arvind Virmani mentioned that the risk for India’s economy is crude oil prices, as they have increased in recent years.

3. How did the Finance Ministry respond to the criticism of inflated GDP?
a) By dismissing the criticism and stating that income side estimates were used
b) By acknowledging the criticism and promising to revise their GDP calculations
c) By ignoring the criticism and refusing to provide any explanation
d) By blaming international agencies for the inflated GDP figures

Explanation: The Finance Ministry dismissed the criticism of inflated GDP by stating that they have followed the consistent practice of using income side estimates to compute economic growth. They also highlighted that many international agencies have revised upwards their forecast after seeing the first quarter data.

4. According to Arvind Virmani, why is the net household savings ratio in India falling?
a) Increased debt-to-GDP ratio
b) Decreased gross household savings
c) Falling consumer debt
d) Rise in crude oil prices

Explanation: Arvind Virmani explained that the net household savings ratio in India is falling because consumer debt is increasing faster, but the gross household savings ratio has consistently gone up.

5. How has the rise in crude oil prices impacted inflation, according to Arvind Virmani?
a) It has led to a decrease in inflation
b) It has had no impact on inflation
c) It has caused inflation to increase
d) It has stabilized inflation at a moderate level

Explanation: Arvind Virmani stated that the rise in crude oil prices will have some inflationary impact, as the income of the people goes down. However, he also mentioned that the government has managed food inflation reasonably well.

6. How did former Chief Economic Advisor Arvind Subramanian argue that India’s GDP should be measured?
a) From the expenditure side
b) From the productivity side
c) From the income side
d) From the savings side

Explanation: Arvind Subramanian argued that India’s GDP should be measured from the expenditure side rather than the productivity side.

7. How did Chief Economic Advisor V Anantha Nageswaran respond to criticism of “statistical discrepancy” in the first quarter GDP data?
a) He acknowledged the discrepancy and promised to address it
b) He dismissed the criticism and referred to past data
c) He blamed the statistical authority for the discrepancy
d) He called for a revision in the methodology of calculating GDP

Explanation: Chief Economic Advisor V Anantha Nageswaran rejected criticism of “statistical discrepancy” in the first quarter GDP data by referring to past data. He stated that when the same statistical authority reported the severest contraction in the first quarter of 2020, the naysayers had called it credible as it suited their narrative.

Brief Summary | UPSC – IAS

The Indian economy is expected to grow at around 6.5% in the current fiscal year, despite challenges such as high crude oil prices and increased uncertainty due to climate change, according to NITI Aayog member Arvind Virmani. He stated that fluctuations in global GDP have balanced out for India. Virmani dismissed claims by US-based economists that India is overstating economic growth, arguing that they lack an understanding of how GDP is constructed. The Finance Ministry also defended the country’s GDP data, highlighting other indicators such as purchasing managers’ indices and bank credit growth. High crude oil prices and climate change were highlighted as risks. Gross household savings in India have consistently increased, although net household savings have fallen due to rising consumer debt. Virmani noted that India’s debt-to-GDP ratio is low compared to other countries and said the government has managed food inflation reasonably well.

“Difference Between Anticline and Syncline: Geological Folds in Earth’s Crust”

Understanding the Difference Between Anticline and Syncline

Anticlines and synclines are two fundamental geological structures commonly found in folded rock layers within the Earth’s crust. They are essential components of structural geology and provide valuable information about the history of rock deformation.

Difference Between Anticline and Syncline

What is Anticline?

  • An anticline is a type of geological fold where rock layers or strata are folded into an arch or convex shape, resembling an upside-down “U” or a hill. The oldest rock layers are typically found in the center of the fold, while the younger layers are on the outer edges.
  • Anticlines are often associated with compressional forces within the Earth’s crust, typically resulting from tectonic plate movements.
  • These structures are important because they can trap and accumulate hydrocarbons (such as oil and gas) due to their upward-arching shape, forming potential reservoirs for these resources.

What is Syncline?

  • A syncline is the adversary of an anticline. It’s a geological fold where rock layers are folded into a concave shape, resembling a “U” or a trough. In synclines, the youngest rock layers are usually in the center, while the older layers are found on the outer parts of the fold.
  • Synclines often form in response to tectonic forces that result in stretching or extension of the Earth’s crust. These forces can cause rocks to bend downward and create synclinal structures.
  • In contrast to anticlines, synclines are less likely to trap hydrocarbons, as they tend to have a more downward-facing structure.

What is Monocline?

A monocline is a type of geological fold or flexure in the Earth’s crust characterized by a single, steeply inclined set of rock layers or strata.

Unlike anticlines and synclines, which involve bending in both horizontal and vertical directions, monoclines primarily exhibit a simple, one-sided incline or dip in the rock layers.

Monoclines are often associated with regional tectonic forces and can be significant features in structural geology.

Key Characteristics of a Monocline:

  1. Steep Inclination: In a monocline, the rock layers are tilted or folded at a relatively steep angle, typically greater than 30 degrees, but it can be even steeper. This tilt is primarily in one direction, creating a step-like appearance in the landscape.
  2. Unidirectional: Unlike anticlines and synclines, which involve folding in both horizontal and vertical directions, monoclines primarily exhibit a single vertical or near-vertical flexure. This means that the rock layers are tilted along one main axis.
  3. Surface Expression: Monoclines can be seen on the Earth’s surface as topographic features where a relatively flat layer of rock is uplifted and inclined along one side, creating a step or ridge in the landscape. They can also be exposed in canyons, cliffs, or mountain ranges.
  4. Formation: Monoclines typically form in response to tectonic forces and stress within the Earth’s crust. These forces can cause the crust to bend and uplift, leading to the creation of monoclines.

Monoclines are essential in understanding the structural geology of a region and can have various geological implications, such as the potential for the localization of mineral deposits or the influence on groundwater flow patterns. They are also of interest to geologists and researchers studying the Earth’s history and the processes that shape its surface.

Fun Fact: The term “anticline” comes from the Greek words “anti,” meaning “opposite” or “against,” and “klinein,” meaning “to bend.” In contrast, the term “syncline” comes from the Greek words “syn,” meaning “together,” and “klinein,” meaning “to bend.”

Significance of Anticlines and Synclines in Geology

Anticlines and synclines play a crucial role in understanding the geological history of an area. They provide valuable information about the forces that have shaped the Earth’s crust and help geologists determine the sequence of rock layers in folded mountain belts or sedimentary basins. Understanding the characteristics and formation processes of these structures

Mutiple Choice Questions

1. What is an anticline?
a) A type of geological fold where rock layers are folded into a concave shape.
b) A type of geological fold where rock layers are folded into an arch or convex shape.
c) A single, steeply inclined set of rock layers or strata.
d) A type of geological fold where rock layers are gently inclined in one direction.

Explanation: An anticline is a type of geological fold where rock layers are folded into an arch or convex shape, resembling an upside-down “U” or a hill. The oldest rock layers are typically found in the center of the fold, while the younger layers are on the outer edges.

2. What is the main characteristic of an anticline?
a) It is associated with compressional forces within the Earth’s crust.
b) It is the adversary of a syncline.
c) It tends to trap and accumulate hydrocarbons.
d) It is less likely to trap hydrocarbons.

Explanation: The main characteristic of an anticline is that it is associated with compressional forces within the Earth’s crust, typically resulting from tectonic plate movements.

3. What is a syncline?
a) A type of geological fold where rock layers are folded into an arch or convex shape.
b) A type of geological fold where rock layers are folded into a concave shape.
c) A single, steeply inclined set of rock layers or strata.
d) A type of geological fold where rock layers are gently inclined in one direction.

Explanation: A syncline is a geological fold where rock layers are folded into a concave shape, resembling a “U” or a trough. In synclines, the youngest rock layers are usually in the center, while the older layers are found on the outer parts of the fold.

4. What is the main characteristic of a syncline?
a) It is associated with compressional forces within the Earth’s crust.
b) It is the adversary of an anticline.
c) It tends to trap and accumulate hydrocarbons.
d) It is less likely to trap hydrocarbons.

Explanation: The main characteristic of a syncline is that it is the adversary of an anticline. It forms in response to tectonic forces that result in the stretching or extension of the Earth’s crust, causing rocks to bend downward and create synclinal structures.

5. What is a monocline?
a) A type of geological fold where rock layers are folded into an arch or convex shape.
b) A type of geological fold where rock layers are folded into a concave shape.
c) A single, steeply inclined set of rock layers or strata.
d) A simple, one-sided incline or dip in the rock layers.

Explanation: A monocline is a type of geological fold or flexure characterized by a single, steeply inclined set of rock layers or strata. It primarily exhibits a simple, one-sided incline or dip in the rock layers.

6. What is the main characteristic of a monocline?
a) Steep inclination
b) Folding in both horizontal and vertical directions
c) Formation from compressional forces within the Earth’s crust
d) Localization of mineral deposits

Explanation: The main characteristic of a monocline is its steep inclination. The rock layers are tilted or folded at a relatively steep angle, typically greater than 30 degrees, creating a step-like appearance in the landscape.

7. What can monoclines tell us about a region?
a) The potential for the localization of mineral deposits
b) The history of rock deformation
c) The influence on groundwater flow patterns
d) The processes that shape the Earth’s surface

Explanation: Monoclines are essential in understanding the structural geology of a region and can have various geological implications, such as the potential for the localization of mineral deposits or the influence on groundwater flow patterns. They also help researchers study the Earth’s history and the processes that shape its surface.

Brief Summary | UPSC – IAS

Anticlines and synclines are geological structures found in folded rock layers. Anticlines are arch-shaped folds with older rock layers in the center and are often associated with compressional forces. They can trap hydrocarbons and form reservoirs. Synclines are concave folds with younger rock layers in the center, formed by stretching forces. They are less likely to trap hydrocarbons. Monoclines are steeply inclined folds with a single direction of tilt and are formed by tectonic forces. They can be important for understanding structural geology, mineral deposits, and groundwater flow patterns.

“The Surprising Age and Formation of the Moon Revealed Through Lunar Rock Samples”

Rock collected by Apollo 17 astronaut in 1972 reveals moon’s age

The Moon’s Formation: Insights from Apollo 17 Samples

Introduction

The crescent Earth rises above the lunar horizon in this undated NASA handout photograph taken from the Apollo 17 spacecraft in lunar orbit during the final lunar landing mission in the Apollo program in 1972.

The crescent Earth rises above the lunar horizon in this undated NASA handout photograph taken from the Apollo 17 spacecraft in lunar orbit during the final lunar landing mission in the Apollo program in 1972.
| Photo Credit: Reuters

During the Apollo 17 mission in 1972 – the last time people walked on the moon – U.S. astronauts Harrison Schmitt and Eugene Cernan collected about 243 pounds (110.4 kg) of soil and rock samples that were returned to Earth for further study.

A half century later, crystals of the mineral zircon inside a coarse-grained igneous rock fragment collected by Schmitt are giving scientists a deeper understanding about the moon’s formation and the precise age of Earth’s celestial partner.

The moon is about 40 million years older than previously thought – forming more than 4.46 billion years ago, within 110 million years after the solar system’s birth, scientists said on Monday, based on analyses of the crystals.

Significance of Apollo 17 Samples

The Apollo 17 samples provide invaluable information about the moon’s formation and its relationship to the Earth. By studying the crystals of zircon found in the samples, scientists are able to determine the moon’s age with greater precision.

Features and Objectives

The leading hypothesis for lunar formation is that during the solar system’s chaotic early history, a Mars-sized object called Theia collided with primordial Earth. This impact caused magma, or molten rock, to be ejected into space, forming a debris disk that eventually coalesced to form the moon. The objective of studying the Apollo 17 samples is to confirm the timing and process of this moon formation event.

Effects of the Study

By establishing the moon’s formation date, scientists can better understand the impact it has had on Earth’s rotational speed and stability. The moon’s formation played a crucial role in stabilizing Earth’s axis and creating a habitable environment. Additionally, the moon’s gravitational pull influences ocean ecosystems and helps shape our climate.

Pros and Cons

The study of the Apollo 17 samples and the insights gained from them have several benefits. It allows us to understand our solar system’s history, gain knowledge about the moon’s geology, and lay the groundwork for future deep-space explorations. However, the availability of a limited number of Apollo samples restricts the scope of research and requires scientists to make the most of the available resources.

Fun Fact

All the oldest minerals found on Earth, Mars, and the moon are zircon crystals. Zircon, a durable mineral, provides valuable information about the history of celestial bodies and their formation.

References:

  1. The Hindu – Moon formed 4.44 billion years ago, 40 million years earlier than thought: Researchers
  2. NASA – Moon (Natural Satellite)

Mutiple Choice Questions

1. What mission collected soil and rock samples from the moon?
a) Apollo 11
b) Apollo 12
c) Apollo 17
d) Apollo 20

Explanation: The correct answer is c) Apollo 17. During the Apollo 17 mission in 1972, U.S. astronauts Harrison Schmitt and Eugene Cernan collected about 243 pounds of soil and rock samples from the moon.

2. What mineral were scientists able to find inside a rock fragment collected during the Apollo 17 mission?
a) Quartz
b) Zircon
c) Diamond
d) Feldspar

Explanation: The correct answer is b) Zircon. Scientists were able to find crystals of the mineral zircon inside a coarse-grained igneous rock fragment collected by Harrison Schmitt during the Apollo 17 mission.

3. How old is the moon based on the analysis of zircon crystals?
a) Approximately 40 million years old
b) Approximately 4.46 billion years old
c) Approximately 110 million years old
d) Approximately 51 years old

Explanation: The correct answer is b) Approximately 4.46 billion years old. Based on the analysis of zircon crystals found in a rock fragment collected during the Apollo 17 mission, scientists determined that the moon formed more than 4.46 billion years ago, within 110 million years after the solar system’s birth.

4. What is the leading hypothesis for lunar formation?
a) Impact of a meteor
b) Volcanic eruption
c) Collision with another planet
d) Gradual accretion of space debris

Explanation: The correct answer is c) Collision with another planet. The leading hypothesis for lunar formation is that a Mars-sized object called Theia collided with primordial Earth, blasting magma into space. This magma eventually coalesced into the moon.

5. What method was used to confirm the age of the zircon crystals?
a) Atom probe tomography
b) Ion microprobe analysis
c) Radiocarbon dating
d) Carbon-14 analysis

Explanation: The correct answer is a) Atom probe tomography. Scientists used atom probe tomography to confirm the age of the zircon crystals found in the rock fragment collected during the Apollo 17 mission. This method helped determine that there were no complications involving the lead atoms, confirming the age of the crystals.

6. How does the moon stabilize Earth’s axis and rotational speed?
a) By exerting gravitational pulls on Earth
b) By absorbing excess heat from Earth
c) By regulating ocean currents
d) By emitting low-frequency vibrations

Explanation: The correct answer is a) By exerting gravitational pulls on Earth. The moon’s gravitational pulls help stabilize Earth’s rotational axis and slow down its rotational speed. This stabilization is important for maintaining a stable climate on Earth.

7. How does the moon contribute to future deep-space explorations?
a) By providing a stable climate for space travel
b) By serving as a stepping stone for space missions
c) By supplying resources for space missions
d) By supporting human cultures and inspirations

Explanation: The correct answer is b) By serving as a stepping stone for space missions. NASA and other space agencies view the moon as a stepping stone for future deep-space explorations. The moon’s proximity to Earth makes it an ideal location for testing technologies and conducting research before venturing further into space.

Brief Summary | UPSC – IAS

The moon is about 40 million years older than previously thought, forming more than 4.46 billion years ago, according to a study based on an analysis of crystals of the mineral zircon collected by U.S. astronauts during the Apollo 17 mission in 1972. The findings provide scientists with a deeper understanding of the moon’s formation and the precise age of Earth’s celestial partner. The study used atom probe tomography to confirm the age of the zircon crystals, which were found in a rock fragment collected from the moon’s surface. The moon’s formation is believed to have resulted from a giant impact between Earth and a Mars-sized object called Theia.

“GDP Growth: Unveiling the Nuances and Disparities in India’s Economic Performance”

Tracking India’s growth trajectory - The Hindu

The Nuanced Story of India’s GDP Growth Rate: A Comprehensive Analysis


For representative purposes.

For representative purposes.
| Photo Credit: Getty Images

The conventional way to assess a country’s economic situation is to look at the quarterly (three-month) and annual (12-month) GDP (gross-domestic-product) growth rate and compare it to previous quarters as well as years. In the quarterly release of GDP figures by the NSO (National Statistical Office), the country’s performance is likened to reviewing a report card of its economic performance. However, a critical difference between reviewing a report card and India’s economic figures is that the latter tells a far more nuanced story.

The Q1 data covering the GDP growth rate from April to June of FY24 boasts a nominal growth rate of 8% and a real growth rate of 7.8%. The growth story currently posits that the numbers reflect an uptick in the agriculture sector growing at 3.5%, unlikely to be sustained due to pressure from the El Niño phenomenon, and the services industry, with financial, real estate, and professional services growing at 12.2%. Moreover, there is also talk of sustaining a close to 6.5% growth rate for the current financial year. However, a closer look at the numbers provides a far more interesting interpretation of the growth.

Calculating GDP

The first factor to consider is that calculating the GDP growth rate involves many complex statistical choices and sophisticated statistical operations. One such decision the NSO made while conducting their research was to use the income approach of calculating GDP rather than the expenditure approach. The income approach involves summing up all national incomes from the factors of production and accounting for other elements such as taxes, depreciation, and net foreign factor income. The assumption generally is that both methods lead to similar results.

However, the expenditure approach dictates headline growth to be 4.5% rather than 7.8% which is a large discrepancy. Moreover, another essential statistical operation is the adjusting for inflation using the price deflator. Typically, the deflator is meant to adjust growth figures when they are overstated by inflation. In this case, deflation due to falling commodity prices, reflected in the wholesale price index, has worked to overstate the real growth. Furthermore, there is a base effect from the COVID-19 degrowth period, which continues to plague India’s growth figures. Although less pronounced in FY24, the base effect has a role in comparative statistics due to sporadic growth in the years following FY20-21.

Additionally, one must consider whether the proposed, supposedly cooled, inflation rate calculated through the consumer price index can be sustained at current levels with the impending depreciation of the Indian rupee against the dollar due to capital outflow pressures resulting from the RBI’s reluctance to raise interest rates. India is a net importer, and its most significant import consists of crude petroleum, whose price seems to be rising due to Saudi’s $100 per barrel push and rupee depreciation. The domestic consumption of diesel, a proxy for economic activity in India, fell by 3% in August, which, if sustained, does not paint a rosy growth picture for the coming quarters.

Revenue from taxes

Moreover, the government’s tax revenue from direct taxes has weakened over the previous quarter while the indirect tax revenue remained strong, indicating a K-shaped pattern. The income streams from progressive taxation (more significant tax burden on those higher on the income ladder) seem to be a laggard compared to its regressive counterpart. A muted growth of direct tax collected in an economy boosted by the services industry is a statistical discrepancy that remains unexplained in the proposed GDP growth story. Direct and personal taxes should (in the absence of any significant policy changes) have grown closer to the nominal growth rate than it has currently. Narrowing revenue streams indicate forced austerity measures, as the government intends to control the budget deficit, and hence the interest rate. Therefore, growth in FY24 stemming from government expenditure seems to be a pipe dream.

A nuanced approach

In conclusion, after a meticulous analysis of India’s Q1 FY24 economic transcript, it becomes palpable that the reported growth narrative might be somewhat overembellished. The divergence in growth figures brought forth by the income and expenditure approaches manifest a significant disparity, raising fundamental questions about the veracity of the promulgated optimistic narrative. Moreover, the underpinnings of this growth story, nuanced by inflationary adjustments and conspicuous fluctuations in tax revenue streams, signal a cautious trajectory. Additionally, the apprehensive outlook on the agriculture sector and potential fiscal constraints paint an arguably more restrained picture than initially portrayed. Therefore, it seems prudent to assert that India’s economic performance, although showing signs of resilience, does not quite emerge as the unequivocal success story depicted in initial observations, urging a more nuanced and critical approach in assessing the trajectory ahead.

Anand Srinivasan is a consultant and Sashwath Swaminathan is a research assistant at Aionion Investment Services

Significance of India’s GDP Growth Rate

India’s GDP growth rate is a crucial metric used to assess the country’s economic performance. It provides insights into the overall health and sustainability of the economy. The growth rate influences investor confidence, policy decisions, and public sentiment. Understanding the nuances of these figures is essential to make informed judgments and predictions about the future trajectory of the economy.

Key Features of India’s GDP Growth Rate

  • The nominal growth rate for Q1 FY24 is reported at 8%, while the real growth rate stands at 7.8%.
  • The growth is driven by the agriculture sector (3.5%) and the services industry, particularly financial, real estate, and professional services (12.2%).
  • Growth figures are adjusted for inflation using the price deflator.
  • The income approach is used for calculating GDP, taking into account factors like national incomes and taxes.
  • The divergence between income and expenditure approaches results in significant disparities in growth figures.

Objectives and Effects of GDP Growth Rate

The primary objective of achieving a positive GDP growth rate is to ensure economic stability, improve living standards, and reduce unemployment. Sustainable and robust growth can lead to increased investment, higher incomes, and improved infrastructure. However, an overly optimistic or misrepresented growth narrative can result in misallocation of resources, policy misjudgments, and inaccurate economic forecasts.

Pros and Cons

Pros:

  • Positive GDP growth rate reflects economic progress and potential for development.
  • Increased growth can attract foreign investment and boost exports.
  • Provides opportunities for job creation and poverty alleviation.

Cons:

  • Overstated growth figures can lead to unrealistic expectations and misinformed policy decisions.
  • Unequal distribution of growth benefits can exacerbate income inequality.
  • Environmental implications of growth, such as increased carbon emissions, resource depletion, and ecological degradation.

Fun Fact

India is the world’s seventh-largest economy by nominal GDP and third-largest by purchasing power parity. Its GDP growth rate has been a topic of significant interest and debate among economists, policymakers, and investors due to its potential to drive global economic performance.

Mutiple Choice Questions

1. What is the conventional way to assess a country’s economic situation?
A) Analyzing the quarterly and annual GDP growth rates
B) Reviewing the report card of the country’s economic performance
C) Comparing the current GDP figures with previous quarters and years
D) All of the above

Explanation: The conventional way to assess a country’s economic situation is by looking at the quarterly and annual GDP growth rates and comparing them to previous quarters and years, similar to reviewing a report card of its economic performance.

2. What is the nominal growth rate of India’s GDP in Q1 of FY24?
A) 4.5%
B) 7.8%
C) 8%
D) 12.2%

Explanation: The nominal growth rate of India’s GDP in Q1 of FY24 is 8%.

3. Which sector of the Indian economy is unlikely to sustain its growth due to the El Niño phenomenon?
A) Agriculture sector
B) Services industry
C) Financial sector
D) Real estate sector

Explanation: The agriculture sector is unlikely to sustain its growth due to the pressure from the El Niño phenomenon.

4. Which approach did the NSO use to calculate India’s GDP growth rate?
A) Income approach
B) Expenditure approach
C) Both approaches
D) None of the above

Explanation: The NSO used the income approach to calculate India’s GDP growth rate.

5. What is the headline growth rate of India’s GDP according to the expenditure approach?
A) 4.5%
B) 7.8%
C) 8%
D) 12.2%

Explanation: According to the expenditure approach, the headline growth rate of India’s GDP is 4.5%.

6. What is the purpose of using the price deflator in adjusting growth figures?
A) To overstate the real growth
B) To adjust for inflation
C) To calculate the nominal growth rate
D) To calculate the GDP per capita

Explanation: The purpose of using the price deflator is to adjust growth figures when they are overstated by inflation.

7. What is the significance of the base effect on India’s growth figures?
A) It causes inflationary adjustments
B) It reflects the impact of the El Niño phenomenon
C) It is a result of falling commodity prices
D) It affects comparative statistics

Explanation: The base effect from the COVID-19 degrowth period has a role in comparative statistics due to sporadic growth in the years following FY20-21.

8. Why is the impending depreciation of the Indian rupee against the dollar a concern for India’s growth?
A) It leads to capital outflow pressures
B) It increases import costs
C) It affects the consumer price index
D) It causes a decline in direct tax revenue

Explanation: The impending depreciation of the Indian rupee against the dollar leads to capital outflow pressures and increases import costs, which can impact India’s growth.

9. Which sector serves as a proxy for economic activity in India?
A) Agriculture sector
B) Services industry
C) Financial sector
D) Crude petroleum sector

Explanation: The domestic consumption of diesel serves as a proxy for economic activity in India.

10. What does the weakening of direct tax revenue compared to indirect tax revenue indicate?
A) A progressive taxation system
B) A regressive taxation system
C) A K-shaped pattern
D) A decline in government expenditure

Explanation: The weakening of direct tax revenue compared to indirect tax revenue indicates a K-shaped pattern, where progressive taxation is lagging behind.

Brief Summary | UPSC – IAS

India’s reported GDP growth rate of 7.8% for Q1 of FY24 may be overstated due to various factors, including the use of the income approach instead of the expenditure approach, which would result in a lower growth rate of 4.5%. The adjustment for inflation using the price deflator has also worked to overstate real growth, and there is a base effect from the COVID-19 pandemic that continues to impact growth figures. In addition, there are concerns about sustaining low inflation rates and the impact of rising crude oil prices and a depreciating rupee. Furthermore, tax revenue streams indicate forced austerity measures and government expenditure may not contribute significantly to growth in the current financial year. Overall, a nuanced and critical approach is needed when assessing India’s economic trajectory.

Ministry defends inclusion of mythology in Chandrayaan-3 reading module

Exploring Mythology and Science: The Significance of Including References to Mythology in the Chandrayaan-3 Reading Module


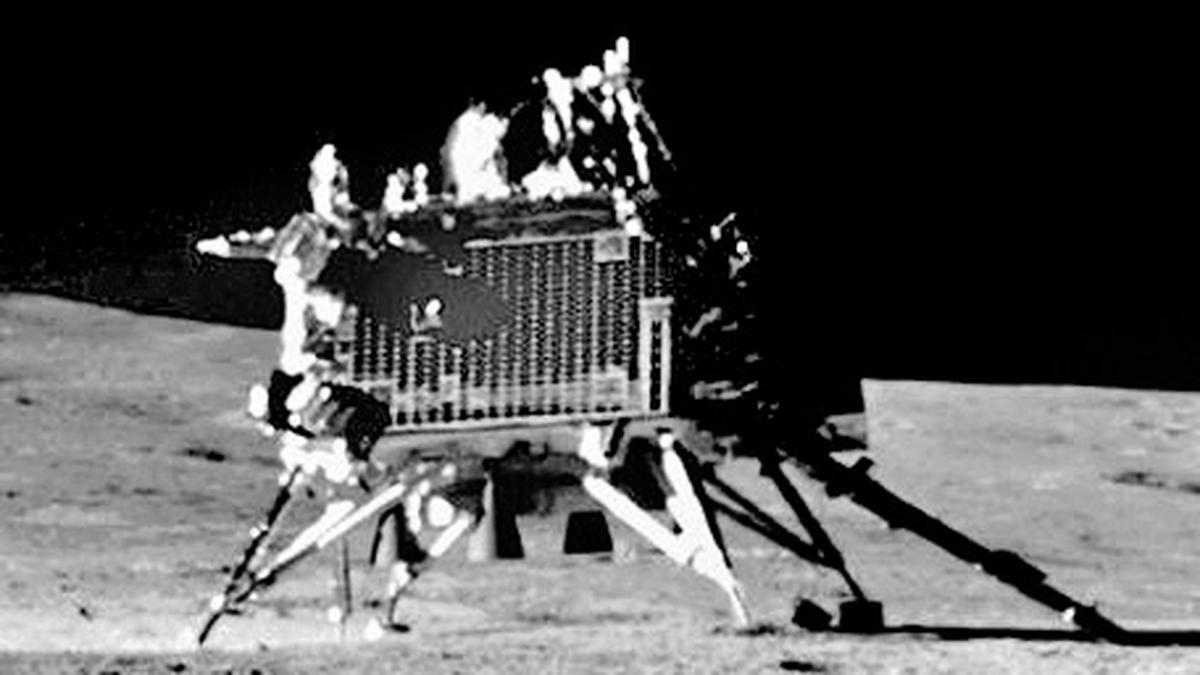
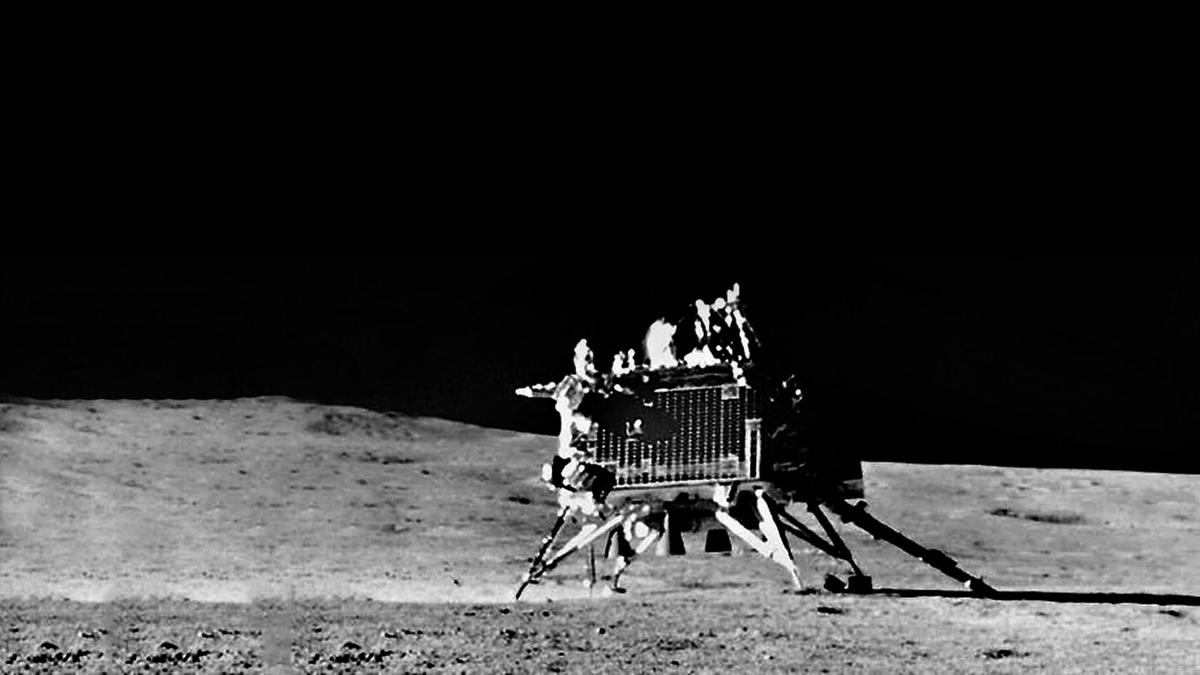
The Vikram Lander of Chandrayaan-3 mission seen on the moon’s surface in this image clicked through Pragyan Rover’s navigation camera.

The Vikram Lander of Chandrayaan-3 mission seen on the moon’s surface in this image clicked through Pragyan Rover’s navigation camera. | Photo Credit: ISRO

The Union Ministry of Education has defended the inclusion of references to mythology in the special reading module crafted by the National Council of Educational Research and Training (NCERT) on Chandrayaan-3 for schoolchildren.

In its clarification regarding news reports on this special module, the Ministry of Education said, “NCERT has meticulously crafted ten special modules on Chandrayaan-3 which offer a comprehensive overview of various facets of this mission, encompassing scientific, technological, cultural, and social aspects. Content within these modules has been thoughtfully designed to be interactive and engaging.”

Cultural Fabric

“The mythology and philosophy put forward ideas, and ideas lead to innovation and research. Numerous research studies emphasize that mythology plays an indispensable role in the cultural fabric of any country, including Bharat. Furthermore, the integration of culture into education not only fosters a profound understanding of a nation’s historical legacy but also bolsters creativity and problem-solving skills among students. It’s the whole gestalt of India’s association with sky and space,” the statement said.

Through this initiative, NCERT seeks to not only promote scientific temper but also instill a sense of pride, inspiration, and an understanding of our country’s achievements among the educational community and the public at large, the ministry said, defending the reading module.

To create awareness among students about the success of Chandrayaan-3, NCERT prepared a special reading module for schoolchildren and released it on October 17. In the explanation of this scientific achievement, the reading module had references to Vymaanika Shastra, Pushpakavimana in Indian mythology. However, this drew the ire of several educationists, students, and rationalists. The Hindu had reported on the same on October 25.

  • The Union Ministry of Education has defended the inclusion of references to mythology in the special reading module crafted by the National Council of Educational Research and Training (NCERT) on Chandrayaan-3 for schoolchildren.
  • Through this initiative, NCERT seeks to not only promote scientific temper but also instill a sense of pride, inspiration, and an understanding of our country’s achievements among the educational community and the public at large, the ministry said, defending the reading module.
  • To create awareness among students about the success of Chandrayaan-3, NCERT prepared a special reading module for schoolchildren and released it on October 17.

The Significance of Including Mythology in the Chandrayaan-3 Reading Module

Recently, the National Council of Educational Research and Training (NCERT) released a special reading module on Chandrayaan-3 for schoolchildren, which sparked a debate due to its inclusion of references to mythology. The Union Ministry of Education has defended this decision, stating that mythology plays an indispensable role in a country’s cultural fabric and contributes to fostering creativity, problem-solving skills, and a sense of pride and inspiration among students.

Features and Objectives of the Reading Module

The reading module on Chandrayaan-3 meticulously crafted by NCERT offers a comprehensive overview of various facets of this mission. It encompasses scientific, technological, cultural, and social aspects, providing students with an interactive and engaging learning experience. The module aims not only to promote scientific temper but also to instill a deep understanding of India’s historical legacy and achievements in space exploration.

Effects and Benefits of Including Mythology

Integrating mythology into education has proven to have several positive effects on students. Research studies have highlighted that mythology fosters a profound understanding of a nation’s cultural heritage. It stimulates creativity and nurtures problem-solving skills by presenting diverse ideas and perspectives. Including references to mythology in the reading module helps students develop a sense of pride, inspiration, and curiosity about India’s association with the sky and space exploration.

Promoting Scientific Temper and Cultural Identity

The inclusion of mythology in the reading module serves the dual purpose of promoting scientific temper and preserving cultural identity. By blending scientific facts with mythical stories and concepts, students gain a holistic understanding of India’s rich scientific and cultural heritage. This approach inspires them to pursue scientific inquiry and research by appreciating the intersection of mythology and science.

Fun Fact: Vymaanika Shastra and Pushpakavimana

In the reading module, references were made to mythical concepts like Vymaanika Shastra and Pushpakavimana. Vymaanika Shastra is an ancient text that discusses various types of aircraft and flying machines. Pushpakavimana is a mythical vehicle mentioned in Hindu epics like the Ramayana. Including these fun and intriguing elements from mythology can capture the imagination of students and make the learning experience more enjoyable.

Pros and Cons of Including Mythology in Education

While the inclusion of mythology in education has its merits, it is important to consider some potential drawbacks as well.

Pros:

  • Promotes a deeper understanding of cultural heritage
  • Enhances creativity and problem-solving skills
  • Inspires curiosity and interest in scientific exploration
  • Encourages critical thinking and a multidimensional approach to learning

Cons:

  • Possibility of confusion between mythological stories and scientific facts
  • Challenge of balancing scientific accuracy with mythical interpretations
  • May reinforce superstitions and pseudoscience if not approached critically
  • Can lead to controversy and debate among educators and rationalists

Considering both the positive and negative aspects, it is crucial for educators to strike a balance when incorporating mythology into the curriculum. By providing proper context, encouraging critical thinking, and emphasizing the distinction between mythology and scientific facts, educators can harness the benefits of mythology while promoting a solid scientific foundation.

In conclusion, the inclusion of references to mythology in the Chandrayaan-3 reading module serves to engage students, promote a profound understanding of India’s cultural heritage, and inspire scientific curiosity. Mythology can be a valuable tool to stimulate creativity and problem-solving skills. However, it is essential to approach mythology in education with caution and ensure a balanced integration of scientific knowledge.

Mutiple Choice Questions

1. What is the purpose of the special reading module on Chandrayaan-3 prepared by NCERT?
a) To promote scientific temper and awareness among schoolchildren
b) To provide a comprehensive overview of various facets of the mission
c) To instill a sense of pride and inspiration in students
d) All of the above

Explanation: The special reading module aims to promote scientific temper, provide a comprehensive overview of the mission, and instill a sense of pride and inspiration among students.

2. Why did the Ministry of Education defend the inclusion of references to mythology in the reading module?
a) Mythology plays an indispensable role in the cultural fabric of any country.
b) Ideas from mythology lead to innovation and research.
c) Integration of culture in education fosters understanding, creativity, and problem-solving skills.
d) All of the above

Explanation: The Ministry of Education defended the inclusion of mythology, stating that it plays a role in the cultural fabric, leads to innovation and research, and fosters understanding, creativity, and problem-solving skills.

3. What drew criticism regarding the reading module?
a) Inclusion of mythology and references to Vymaanika Shastra and Pushpakavimana
b) Lack of scientific content and focus on cultural aspects
c) Insufficient information about Chandrayaan-3 mission
d) None of the above

Explanation: The reading module received criticism due to the inclusion of mythology and references to Vymaanika Shastra and Pushpakavimana, which drew ire from educationists, students, and rationalists.

Note: The detailed explanation provides context and clarifies the answers by referencing the information given in the provided text.

Brief Summary | UPSC – IAS

The Union Ministry of Education is defending the inclusion of mythology in a reading module on the Chandrayaan-3 mission for schoolchildren. The special module, crafted by the NCERT, aims to promote scientific interest and instill pride in India’s achievements. The ministry argues that mythology plays a significant role in the country’s cultural fabric and integrating it into education fosters creativity and problem-solving skills among students. The module, released on October 17, includes references to Vymaanika Shastra and Pushpakavimana from Indian mythology, which has drawn criticism from some educationists and rationalists.

“ISRO’s Chandrayaan-3 Success Spurs Interest in Space Collaboration”

Inter-ministerial discussion under way to ease FDI norms in space sector: Official

The Liberalization of Foreign Direct Investment in India’s Space Sector


After the touchdown by ISRO’s Chandrayaan-3 spacecraft near the moon’s South pole, three G-20 countries have expressed interest in possible collaborations or partnerships with India in the space sector.

After the touchdown by ISRO’s Chandrayaan-3 spacecraft near the moon’s South pole, three G-20 countries have expressed interest in possible collaborations or partnerships with India in the space sector.
| Photo Credit: PTI

Significance

The liberalization of foreign direct investment (FDI) norms in India’s space sector holds immense significance as it aims to attract overseas players and private companies. With the recent success of ISRO’s Chandrayaan-3 spacecraft, India has become an attractive partner for potential collaborations and partnerships in the space industry.

Features

The proposed changes in FDI norms in the space sector are currently being discussed among different ministries. The objective is to create a favorable environment for foreign companies to invest in India’s rapidly growing space sector. The exact details of the proposed changes have not been disclosed yet.

Objectives

The main objective of liberalizing FDI norms in the space sector is to attract more foreign investments, which will spur technological advancements, enhance research and development capabilities, and foster collaborations in space exploration and related activities. This move also aligns with the Indian Space Policy 2023, which focuses on increasing private sector participation in the space industry.

Effects

If implemented successfully, the liberalization of FDI norms in the space sector can have several positive effects. It can stimulate economic growth through increased investments and job creation. It can also lead to the transfer of advanced space technologies from foreign companies to India, boosting the country’s space capabilities. Furthermore, collaborations with international partners can accelerate space exploration and contribute to scientific discoveries.

Pros and Cons

While the liberalization of FDI norms in the space sector has numerous advantages, there are also potential drawbacks to consider. Pros include attracting capital inflow, fostering a robust private space ecosystem, and establishing sustainable market demand for startups. However, cons may involve concerns about foreign influence on the country’s space agenda and the need to safeguard national interests and security.

Fun Fact

According to a Deloitte-CII report, the global space economy is valued at about USD 546 billion in 2022, projected to reach about USD 1 trillion by 2040. This growth is driven by cost reduction efforts and technological advancements.

Mutiple Choice Questions

1. Which sector is the Indian government looking to further liberalize foreign direct investment (FDI) norms?
a) Education sector
b) Health sector
c) Space sector
d) Automotive sector

Explanation: The Indian government is looking to further liberalize foreign direct investment (FDI) norms in the space sector to attract overseas players and private companies.

2. What is the current limit for FDI in the space sector?
a) 50%
b) 75%
c) 100%
d) No limit

Explanation: Currently, FDI in the space sector is allowed up to 100% in the area of satellite establishment and operations through government route only.

3. Which countries have expressed interest in possible collaborations or partnerships with India in the space sector?
a) G-7 countries
b) BRICS countries
c) G-20 countries
d) ASEAN countries

Explanation: After the touchdown by ISRO’s Chandrayaan-3 spacecraft near the moon’s South pole, three G-20 countries have expressed interest in possible collaborations or partnerships with India in the space sector.

4. What is the estimated value of the global space economy in 2022?
a) USD 100 billion
b) USD 546 billion
c) USD 1 trillion
d) USD 2 trillion

Explanation: The global space economy is valued at about USD 546 billion in 2022 and is projected to reach about USD 1 trillion by 2040.

5. What is the purpose of the Indian Space Policy 2023?
a) To promote space tourism
b) To institutionalize private sector participation in the space sector
c) To establish a moon base
d) To discover extraterrestrial life

Explanation: The Indian Space Policy 2023 seeks to institutionalize private sector participation in the space sector, with ISRO focusing on research and development of advanced space technologies.

6. What is the role of NewSpace India Limited (NSIL) according to the Indian Space Policy-2023?
a) Research and Development (R&D) outfits
b) Manufacturers of space hardware
c) Providers of space-enabled products and services
d) Space sector PSU

Explanation: The Indian Space Policy-2023 delineated the roles and responsibilities of ISRO, space sector PSU NewSpace India Limited (NSIL), and Indian National Space Promotion and Authorization Center (IN-SPACe).

7. How can the Indian government incentivize companies engaged in space sector activities?
a) Tax exemptions
b) Tax holidays
c) Accelerated depreciation
d) All of the above

Explanation: The Indian government can provide tax exemptions, tax holidays, and accelerated depreciation for companies directly or indirectly engaged in space sector activities to incentivize them.

8. According to a report, what is the need for creating a sustainable market demand for private startups in the space sector?
a) To attract investors
b) To establish a robust private space ecosystem in India
c) To enhance government contracts
d) To drive cost reduction efforts

Explanation: There is a need for creating a sustainable market demand for the private startups, which in turn contributes to the establishment of a robust private space ecosystem in India.

9. What is the initial customer base for numerous startups in the space sector?
a) General consumers
b) Governments
c) Investors
d) Space agencies

Explanation: Within the space industry, governments often serve as the initial customers for numerous startups, while also acting as stable clients for companies engaged in strategic space and national security initiatives.

10. How are space agencies fostering capital inflow in the space sector?
a) Offering government contracts
b) Providing tax incentives
c) Attracting foreign investors
d) All of the above

Explanation: Space agencies are fostering capital inflow in the space sector by offering government contracts, providing tax incentives, and attracting foreign investors.

Brief Summary | UPSC – IAS

Three G-20 countries have expressed interest in collaborating with India in the space sector following the successful touchdown of ISRO’s Chandrayaan-3 spacecraft near the moon’s South pole. To attract foreign players and private companies, the Indian government is currently discussing the liberalisation of foreign direct investment (FDI) norms in the space sector. Presently, FDI is allowed up to 100% for satellite establishment and operations through the government route only. The Indian Space Policy 2023, which aims to involve the private sector in the space industry, has already been approved. The global space economy is projected to reach $1 trillion by 2040.

“Factors Influencing Industrial Location Decisions: A Comprehensive Analysis”

Factors Affecting Industrial Location Decisions

Industrial location decisions are critical for businesses as they determine the optimal location for their facilities. The choice of location can significantly impact the company’s efficiency, cost-effectiveness, and overall success. Various factors influence industrial location decisions, and understanding them is crucial for companies and policymakers alike.

Significance of Industrial Location Decisions

Choosing the right industrial location is essential for several reasons:

  1. Cost Reduction: A strategically chosen location can help minimize transportation costs, reduce supply chain expenses, and improve operational efficiency.
  2. Market Access: Proximity to consumers and markets ensures easy access to target customers and enables quick response to their demands.
  3. Labor Availability: An appropriate location can provide access to a skilled and unskilled labor force, ensuring smooth production processes.
  4. Government Incentives: Governments often offer incentives, tax breaks, and subsidies to attract businesses. Choosing a location that offers such benefits can lead to cost savings.
  5. Resource Optimization: Strategic industrial location decisions help optimize the use of resources, such as raw materials, energy, and utilities.

Features Affecting Industrial Location

Several features influence industrial location decisions:

  1. Proximity to Raw Materials: Industries that rely on specific raw materials, such as mining or agriculture, often locate close to their sources to minimize transportation costs.
  2. Transportation and Infrastructure: Access to transportation networks, including roads, highways, railways, ports, and airports, is crucial for efficient movement of goods and employees.
  3. Labor Supply: Availability of skilled and unskilled labor is a significant factor as industries require a suitable workforce for production.
  4. Market Access: The proximity to consumers and markets is essential for industries focused on serving local or regional markets.
  5. Energy Supply: Reliable and cost-effective access to energy sources, such as electricity and natural gas, is critical for many industrial processes.
  6. Government Policies and Incentives: Government regulations, tax incentives, and subsidies can influence industrial location decisions.
  7. Land and Real Estate Costs: The cost of land and industrial real estate can significantly impact the location choice.
  8. Environmental Regulations: Environmental considerations, such as emissions restrictions, waste disposal regulations, and sustainability goals, play a role in location decisions.
  9. Infrastructure and Utility Costs: Access to water, wastewater treatment, and other utilities can affect the feasibility of industrial operations.
  10. Proximity to Suppliers and Customers: Being close to suppliers and customers can reduce lead times and transportation costs.
  11. Political Stability: A stable political environment is important for long-term investments and operations.
  12. Quality of Life: Factors like the availability of education, healthcare, and cultural amenities can influence the ability to attract and retain a skilled workforce.
  13. Clusters and Industry Agglomeration: Many industries cluster together in specific regions to take advantage of a shared labor pool, suppliers, and knowledge spillovers.
  14. Regulatory and Compliance Considerations: Industries with specific regulatory requirements may need to consider proximity to regulatory agencies.
  15. Risk and Resilience: Industrial facilities consider factors like natural disaster risk, climate resilience, and supply chain vulnerabilities in their location decisions.
  16. Economic Incentives: Governments may offer tax breaks, grants, or other incentives to attract businesses to a particular area.
  17. Access to Research and Development: Industries requiring innovation often locate near universities, research centers, or innovation hubs.
  18. Regional Economic Conditions: The local business environment and economic stability of a region can influence location choices.
  19. Transportation Costs: The cost of transporting raw materials and finished products is a significant factor for some industries.
  20. Regulatory Environment: Industries may consider the ease of complying with local, state, and national regulations when choosing a location.

Objectives and Effects of Industrial Location Decisions

The objectives of industrial location decisions include:

  • Optimizing operational efficiency
  • Reducing costs
  • Improving market access and customer responsiveness
  • Ensuring access to skilled labor
  • Complying with regulatory requirements

Industrial location decisions have several effects:

  • Economic Growth: Strategic industrial locations contribute to regional and national economic growth.
  • Employment Opportunities: Industrial facilities create job opportunities for the local population.
  • Infrastructure Development: Industrial locations drive the development of transportation networks, utilities, and other infrastructure.
  • Trade and Supply Chains: Optimal industrial locations facilitate efficient global trade and supply chains.

Pros and Cons of Industrial Location Decisions

Pros:

  • Cost Savings: Well-planned industrial locations can lead to cost savings through reduced transportation expenses and access to government incentives.
  • Efficient Operations: Strategic locations improve operational efficiency, supply chain management, and customer responsiveness.
  • Access to Resources: Proximity to raw materials, labor, and markets ensures easy access to essential resources.
  • Economic Growth: Industrial locations contribute to regional and national economic growth, creating employment opportunities.

Cons:

  • High Initial Investment: Establishing industrial facilities in prime locations often requires substantial upfront investments.
  • Environmental Impact: Industrial activities can have adverse environmental effects if not managed properly.
  • Dependence on Government Support: Reliance on government incentives and policies may introduce uncertainties in the long run.

Fun Fact: Clustering and Industry Agglomerations

Did you know that many industries cluster together in specific regions to benefit from shared resources and knowledge spillovers? These clusters, also known as industry agglomerations, promote collaboration, innovation, and competitiveness within the industry. Silicon Valley, the hub of the technology industry, is a prime example of such a cluster.

In conclusion, industrial location decisions involve considering various factors such as proximity to raw materials, labor availability, market access, infrastructure, government policies, and environmental considerations. By carefully evaluating these factors, companies can make informed decisions that optimize their operations, reduce costs, and contribute to economic growth.

So, the next time you see a factory or industrial facility, remember that its location was chosen based on a careful analysis of numerous factors!

Mutiple Choice Questions

1. Which factor plays a significant role in determining the location of industrial facilities?
a) Proximity to raw materials
b) Access to transportation networks
c) Availability of skilled and unskilled labor
d) All of the above

Explanation: The correct answer is d) All of the above. Proximity to raw materials, access to transportation networks, and availability of skilled and unskilled labor are all common factors that often play a significant role in determining the location of industrial facilities.

2. Why is proximity to raw materials important for some industries?
a) It reduces transportation costs
b) It increases production efficiency
c) It improves market access
d) It ensures political stability

Explanation: The correct answer is a) It reduces transportation costs. Industries that rely on specific raw materials, like mining or agriculture, are often located close to their sources to reduce transportation costs.

3. Which factor is crucial for the efficient movement of goods and employees?
a) Proximity to raw materials
b) Labor supply
c) Transportation and infrastructure
d) Quality of life

Explanation: The correct answer is c) Transportation and infrastructure. Access to transportation networks, including roads, highways, railways, ports, and airports, is crucial for the efficient movement of goods and employees.

4. What is the significance of market access for industrial facilities?
a) It ensures political stability
b) It reduces lead times and transportation costs
c) It improves access to research and development
d) It minimizes environmental regulations

Explanation: The correct answer is b) It reduces lead times and transportation costs. Proximity to consumers and markets is essential for industries focused on serving local or regional markets, as it can reduce lead times and transportation costs.

5. Which factor is critical for many industrial processes?
a) Energy supply
b) Government policies and incentives
c) Land and real estate costs
d) Environmental regulations

Explanation: The correct answer is a) Energy supply. Reliable and cost-effective access to energy sources, such as electricity and natural gas, is critical for many industrial processes.

6. How can government policies and incentives influence industrial location decisions?
a) They can increase transportation costs
b) They can decrease land and real estate costs
c) They can offer tax incentives and subsidies
d) They can restrict access to skilled labor

Explanation: The correct answer is c) They can offer tax incentives and subsidies. Government regulations, tax incentives, and subsidies can influence industrial location decisions by providing economic benefits and incentives for businesses to operate in a particular area.

7. What factor can significantly impact the location choice of industrial facilities?
a) Environmental regulations
b) Land and real estate costs
c) Proximity to suppliers and customers
d) Political stability

Explanation: The correct answer is b) Land and real estate costs. The cost of land and industrial real estate can significantly impact the location choice of industrial facilities.

8. Which factor can affect the feasibility of industrial operations?
a) Proximity to raw materials
b) Government policies and incentives
c) Infrastructure and utility costs
d) Risk and resilience

Explanation: The correct answer is c) Infrastructure and utility costs. Access to water, wastewater treatment, and other utilities can affect the feasibility of industrial operations.

9. What role does political stability play in industrial location decisions?
a) It ensures access to research and development
b) It reduces transportation costs
c) It minimizes environmental regulations
d) It provides a stable environment for long-term investments and operations

Explanation: The correct answer is d) It provides a stable environment for long-term investments and operations. A stable political environment is important for industrial facilities as it provides a favorable and predictable environment for long-term investments and operations.

10. Which factor can influence the ability to attract and retain a skilled workforce?
a) Quality of life
b) Clusters and industry agglomeration
c) Regulatory and compliance considerations
d) Economic incentives

Explanation: The correct answer is a) Quality of life. Factors like the availability of education, healthcare, and cultural amenities can influence the ability to attract and retain a skilled workforce.

11. Why do many industries cluster together in specific regions?
a) To reduce transportation costs
b) To increase production efficiency
c) To take advantage of shared resources and knowledge spillovers
d) To minimize environmental regulations

Explanation: The correct answer is c) To take advantage of shared resources and knowledge spillovers. Many industries cluster together in specific regions to take advantage of a shared labor pool, suppliers, and knowledge spillovers, which can lead to increased efficiency and innovation.

12. What should industries with specific regulatory requirements consider when choosing a location?
a) Proximity to raw materials
b) Risk and resilience
c) Economic incentives
d) Proximity to regulatory agencies

Explanation: The correct answer is d) Proximity to regulatory agencies. Industries with specific regulatory requirements, such as pharmaceuticals or aerospace, may need to consider proximity to regulatory agencies to ensure compliance with regulations.

13. What factors should industrial facilities consider in terms of risk and resilience?
a) Proximity to raw materials
b) Access to research and development
c) Risk of natural disasters and climate resilience
d) Transportation costs

Explanation: The correct answer is c) Risk of natural disasters and climate resilience. Industrial facilities should consider factors like natural disaster risk, climate resilience, and supply chain vulnerabilities in their location decisions to ensure their operations are not significantly affected by external risks.

14. What incentives can governments offer to attract businesses to a particular area?
a) Tax breaks, grants, or other incentives
b) Access to transportation networks
c) Availability of skilled labor
d) Quality of life amenities

Explanation: The correct answer is a) Tax breaks, grants, or other incentives. Governments may offer tax breaks, grants, or other incentives to attract businesses to a particular area and promote economic development.

15. Where might industries requiring innovation and research facilities locate?
a) Near transportation networks
b) Near universities, research centers, or innovation hubs
c) In regions with low land and real estate costs
d) Near suppliers and customers

Explanation: The correct answer is b) Near universities, research centers, or innovation hubs. Industries that require innovation and research facilities may locate near universities, research centers, or innovation hubs to facilitate collaboration and access to research resources.

16. How can regional economic conditions influence industrial location choices?
a) They can increase transportation costs
b) They can decrease the availability of skilled labor
c) They can affect the local business environment and economic stability
d) They can minimize regulatory and compliance considerations

Explanation: The correct answer is c) They can affect the local business environment and economic stability. Regional economic conditions, including the local business environment and economic stability, can influence industrial location choices by affecting the overall economic viability and competitiveness of a region.

17. What factor is significant for industries that rely on transporting raw materials and finished products?
a) Proximity to raw materials
b) Access to research and development
c) Quality of life
d) Transportation costs

Explanation: The correct answer is d) Transportation costs. The cost of transporting raw materials to the facility and finished products to the market is a significant factor for industries that rely on transportation.

18. Why is the regulatory environment important for some industries?
a) It reduces transportation costs
b) It ensures energy supply
c) It influences the ease of complying with regulations
d) It minimizes land and real estate costs

Explanation: The correct answer is c) It influences the ease of complying with regulations. Industries may consider the ease of complying with local, state, and national regulations when choosing a location to minimize the regulatory burden on their operations.

Overall Explanation: Industrial location decisions are complex and involve a combination of factors such as proximity to raw materials, transportation and infrastructure, labor supply, market access, energy supply, government policies and incentives, land and real estate costs, environmental regulations, infrastructure and utility costs, proximity to suppliers and customers, political stability, quality of life, clusters and industry agglomeration, regulatory and compliance considerations, risk and resilience, economic incentives, access to research and development, regional economic conditions, transportation costs, and the regulatory environment. Companies often conduct comprehensive site selection studies to evaluate the suitability of potential locations based on these and other criteria in order to optimize their operations and reduce costs.

Brief Summary | UPSC – IAS

Industrial location decisions are influenced by a variety of factors including proximity to raw materials, transportation and infrastructure, labor supply, market access, energy supply, government policies, land and real estate costs, environmental regulations, infrastructure and utility costs, proximity to suppliers and customers, political stability, quality of life, industry clusters, regulatory and compliance considerations, risk and resilience, economic incentives, access to research and development, regional economic conditions, and transportation costs. Companies often conduct site selection studies to evaluate potential locations based on these factors to optimize their operations and reduce costs.

“The Surprising Role of Haemoglobin in Cartilage Cell Survival”

Haemoglobin isn’t used only in blood, scientists find in major

The Surprising Discovery: Haemoglobin in Cartilage Cells

Haemoglobin has long been known as a vital component of red blood cells, responsible for carrying oxygen throughout our body. However, a recent study published in Nature has shed light on a new and unexpected role for haemoglobin. Chinese scientists have discovered that chondrocytes, the cells responsible for cartilage production, also produce and rely on haemoglobin for their survival.

‘Haemoglobin bodies’ in Cartilage Cells

Dr. Feng Zhang, a pathologist at the Fourth Military Medical University in China, stumbled upon this intriguing phenomenon while studying bone development. During his research on growth plates, the cartilaginous tissue at the ends of long bones, he noticed spherical structures resembling red blood cells. These structures, which he called haemoglobin bodies or ‘Hedy’, were found to contain haemoglobin.

In collaboration with Dr. Quiang Sun from the Beijing Institute of Biotechnology, advanced microscopy techniques were used to investigate the haemoglobin bodies further. Similar to oil separating into globules in water, the chondrocytes in cartilage exhibited phase separation, resulting in the formation of large haemoglobin blobs without a membrane.

The Importance of Haemoglobin in Cartilage Cells

The scientists sought to determine the functionality of these haemoglobin bodies. To do so, they conducted experiments using genetically modified mice that lacked the gene responsible for haemoglobin production. These mice showed a severe deficiency in haemoglobin and died as embryos. Additionally, when the gene was specifically removed in the cartilage tissue, the chondrocytes experienced cell death. This indicated that haemoglobin is essential for the survival of chondrocytes.

In red blood cells, haemoglobin carries and delivers oxygen to various parts of the body. The researchers hypothesized that haemoglobin in chondrocytes might also function in oxygen transport. They found that chondrocytes lacking haemoglobin exhibited signs of low oxygen or hypoxic stress. This led them to believe that the haemoglobin in chondrocytes likely stored oxygen and supplied it to the cells when needed.

Haemoglobin’s Role in Joint Diseases and Beyond

This groundbreaking discovery bridges the fields of haematology and skeletal biology, revealing their interconnectedness. It opens up new possibilities for understanding the mechanisms underlying joint diseases and bone deformities. Defects in chondrocytes can lead to various bone deformities, and this study suggests that abnormalities in chondrocyte haemoglobin may contribute to increased cell death in certain conditions.

The findings also raise interesting questions about the role of haemoglobin in other regions of cartilage, such as the ribs or spine. Further research is needed to determine if haemoglobin plays a similar role in these areas.

Fun Fact: Haemoglobin in Unexpected Places

The discovery that chondrocytes produce functional haemoglobin highlights the complexity of the human body. It showcases how even well-established scientific understanding can be challenged and expanded by new discoveries.

Conclusion

The serendipitous discovery of haemoglobin in cartilage cells has unveiled an unexpected function of this important molecule. Chondrocytes, the cells responsible for producing cartilage, rely on haemoglobin for survival. This finding not only offers insights into the mechanisms of joint diseases but also emphasizes the interconnectedness of different biological processes within our bodies. Through ongoing research, scientists hope to uncover further roles and effects of haemoglobin in various tissues and cells.

Mutiple Choice Questions

1. What is the main function of haemoglobin in red blood cells (RBCs)?
a) It makes blood red
b) It carries oxygen
c) It makes RBCs survive
d) It connects tissue between bones

Explanation: Haemoglobin in red blood cells carries oxygen to different parts of the body to ensure proper functioning.

2. Which type of cells other than red blood cells produce haemoglobin according to the study?
a) Nerve cells
b) Liver cells
c) Chondrocytes
d) Skin cells

Explanation: The study reveals that chondrocytes, which make cartilage, also produce haemoglobin.

3. What are the spherical blob-like structures containing haemoglobin called?
a) Erythrocytes
b) Haemoglobin bodies
c) Globules
d) Chondrocytes

Explanation: The scientists refer to the spherical blob-like structures containing haemoglobin as haemoglobin bodies or Hedy.

4. What happens to chondrocytes when the gene that makes haemoglobin is removed?
a) They become healthier
b) They start multiplying
c) They die
d) They grow larger

Explanation: When the gene that makes haemoglobin is removed, the chondrocytes start dying.

5. What did the experiments reveal about the role of haemoglobin in chondrocytes?
a) Haemoglobin carries oxygen in chondrocytes
b) Haemoglobin protects chondrocytes from stress
c) Haemoglobin helps in cell division
d) Haemoglobin regulates cell growth

Explanation: The experiments indicate that haemoglobin in chondrocytes carries oxygen and helps in overcoming low-oxygen conditions.

6. What did the researchers observe about the behavior of haemoglobin-free chondrocytes in a low-oxygen environment?
a) They release more oxygen
b) They adapt to the conditions
c) They become healthier
d) They die

Explanation: Haemoglobin-free chondrocytes started dying in a low-oxygen, or hypoxic, environment, confirming the importance of haemoglobin in their survival.

7. Where else in the body, apart from cartilage, was haemoglobin found according to the study?
a) Nerve cells
b) Muscle cells
c) RBCs
d) Ribs and spine

Explanation: The study found haemoglobin in cartilage outside of the growth plate, such as in the ribs and spine.

8. What did Gerard Karsenty, a professor studying skeletal biology, mention about the discovery?
a) It connects haematology and skeletal biology
b) It explains the mechanism of joint diseases
c) It changes the stem cells’ fate in the growth plate
d) It reveals more about cell death in joint diseases

Explanation: Gerard Karsenty states that the discovery breaks down barriers between haematology and skeletal biology, showing their connection.

9. How does the discovery of functional haemoglobin in cartilage contribute to understanding joint diseases?
a) It explains the cause of joint diseases
b) It reveals the role of chondrocytes in joint diseases
c) It helps interpret the mechanisms underlying joint diseases
d) It leads to the prevention of joint diseases

Explanation: The discovery of functional haemoglobin in cartilage opens up possibilities for understanding and interpreting the mechanisms of joint diseases.

10. Who made the discovery of functional haemoglobin in chondrocytes?
a) Noriaki Ono
b) Gerard Karsenty
c) Feng Zhang
d) Rohini Subrahmanyam

Explanation: The discovery of functional haemoglobin in chondrocytes was made by Dr. Zhang in collaboration with Quiang Sun.

Brief Summary | UPSC – IAS

Scientists have discovered that chondrocytes, the cells responsible for making cartilage, produce not only haemoglobin but also depend on it for survival. The team used advanced microscopy techniques and genetically modified mice to investigate the role of haemoglobin within chondrocytes, finding that it stores oxygen and releases it as necessary, maintaining normal cell function. Interestingly, the study also found haemoglobin in cartilage outside of the growth plate, such as in the ribs and spine. While the study opens up new possibilities for understanding joint diseases and the role of haemoglobin in the body, further research is needed to uncover the full scope of its functions.

“India Supreme Court denies legal recognition to same-sex marriages, impacting LGBTQIA+ rights”

Law and custom: On the Supreme Court’s verdict on same-sex marriage

The Supreme Court’s Refusal to Recognize Same-Sex Marriages in India: A Legal Setback for the Queer Community

Introduction

The recent decision by the Supreme Court of India to deny legal recognition to marriages between individuals of the same sex has dealt a significant blow to the rights of the queer community in the country. Despite the progress made in recent years towards recognizing individual rights, there were high hopes that the Court would interpret the Special Marriage Act (SMA) in a gender-neutral manner, allowing same-sex individuals to marry. However, the Court has instead left it to the legislature to pass a law in this regard.

Significance

The refusal to recognize same-sex marriages has far-reaching implications for the LGBTQIA+ community in India. It perpetuates discrimination against queer couples and denies them the right to marry and seek legal and social validation through marriage. This decision underscores the need for legislative action to address the inherent inequality faced by the queer community.

Features

The Special Marriage Act (SMA), under consideration, currently allows any two individuals to marry, but the Court has refrained from extending this provision to include same-sex couples. While some judges have acknowledged the right of queer couples to seek recognition for their unions, they have stopped short of interpreting the law to that effect. Furthermore, the Court has held that statutory limitations prevail over individual rights when it comes to marriage.

Objectives

The objective of the queer community and advocates of LGBTQIA+ rights is to achieve legal recognition and equal treatment for same-sex marriages in India. The Special Marriage Act, if interpreted to include same-sex unions, could have provided a significant step toward this objective. However, the Court’s decision has now placed the responsibility on the legislature to enact a law addressing the rights of queer couples.

Effects

The Supreme Court’s verdict indicates that there is no fundamental right to marry for the LGBTQIA+ community in India. This decision perpetuates the discrimination faced by same-sex couples and denies them the legal and social benefits that come with marriage. The ruling also casts doubt on the ability of queer couples to adopt children, although it does not prohibit transgender individuals from entering into heterosexual marriages.

Pros and Cons

Pros:
– The Court’s decision highlights the need for legislative action on same-sex marriages, which could pave the way for future recognition and equality.
– The direction given to the government to form a committee to decide the rights and entitlements of queer couples is a positive step towards addressing their concerns.

Cons:
– The denial of legal recognition to same-sex marriages perpetuates inequality and discrimination.
– The Court’s decision leaves the LGBTQIA+ community with an ongoing struggle for equality, as they await legislative action.

Fun Fact

While India has yet to legalize same-sex marriages, it is interesting to note that the country has made significant progress in recognizing the rights of transgender individuals. In 2014, the Supreme Court officially recognized transgender individuals as a “third gender” and affirmed their right to self-identify.

In conclusion, the Supreme Court’s refusal to recognize same-sex marriages in India is a setback for the queer community. The decision highlights the need for legislative action to ensure equal rights and opportunities for all individuals, regardless of their sexual orientation. While the Court has opened the door for a committee to address the rights of queer couples, there is still a long way to go before the law catches up with the community’s yearning for equality.

Brief Summary | UPSC – IAS

The Supreme Court of India has rejected the legal recognition of same-sex marriages, dealing a significant blow to the country’s LGBTQ+ community. While the Special Marriage Act allows any two people to marry, the court decided not to give it a gender-neutral interpretation that would include same-sex couples. Instead, the court left it up to the legislature to enact such a law. Some judges ruled that queer couples have the right to seek recognition for their union but did not read down the provisions of the Special Marriage Act to allow for this. The court also concluded that there is no fundamental right to marry, disappointing expectations that it would prevent discrimination against same-sex couples. While the court did acknowledge the right of queer couples to cohabit without coercion or threats, the possibility of Parliament legalizing same-sex marriages is bleak due to opposition from religious and cultural groups, leaving the LGBTQ+ community with a continued struggle for equality.

“Finance Ministry Confident in 6.5% FY24 Growth despite Risks”

No alarms about crude oil surge yet, says Finance Ministry

Finance Ministry Exudes Confidence in India’s Economic Growth


Finance Ministry exuded confidence that the country will achieve 6.5% growth in FY24 on the back of improved corporate profitability, private capital formation and bank credit growth, notwithstanding the risks of rising crude oil prices and monsoon deficit.

Finance Ministry exuded confidence that the country will achieve 6.5% growth in FY24 on the back of improved corporate profitability, private capital formation, and bank credit growth, notwithstanding the risks of rising crude oil prices and monsoon deficit.

Significance

The Finance Ministry’s confidence in India’s economic growth is significant as it provides reassurance to investors and stakeholders about the country’s economic prospects. The projected growth rate of 6.5% in FY24 indicates a positive outlook and potential progress for the Indian economy.

Features

The Finance Ministry highlighted key factors contributing to the expected growth, including improved corporate profitability, private capital formation, and bank credit growth. These factors indicate a favorable business environment and increased investment activity in the country.

Objectives

The objective of the Finance Ministry is to promote and sustain economic growth in India. By expressing confidence in achieving a 6.5% growth rate, the ministry aims to instill optimism and attract investment in various sectors, thereby driving economic development.

Effects

If the country indeed achieves a growth rate of 6.5% in FY24, it would lead to several positive effects on the Indian economy. These may include job creation, increased government revenue, improved living standards, and enhanced investor confidence.

Pros and Cons

While the projected growth is promising, there are potential risks to consider. Rising crude oil prices and monsoon deficit pose challenges that can impact economic stability. However, the Finance Ministry acknowledges these risks and remains confident in the country’s ability to overcome them.

Fun Fact

Did you know that India is one of the world’s fastest-growing major economies, and its GDP is expected to surpass several developed countries in the coming years? The Finance Ministry’s confidence in achieving 6.5% growth further reinforces India’s growth trajectory and economic potential.

Mutiple Choice Questions

1. According to the Finance Ministry, what factors contribute to the projected 6.5% growth in FY24 for the country?
a) Improved corporate profitability, private capital formation, and bank credit growth
b) Rising crude oil prices and monsoon deficit
c) Global stock market correction and private sector formation cycle
d) Record e-way bills generation and electronic toll collections

Explanation: The correct answer is a) Improved corporate profitability, private capital formation, and bank credit growth. The Finance Ministry stated that these factors are expected to contribute to the projected growth.

2. What are the risks identified by the Finance Ministry for the Indian economy?
a) Climbing oil prices and monsoon deficit
b) Overdue global stock market correction and low private sector formation
c) Record e-way bills generation and electronic toll collections
d) High food inflation and declining core inflation

Explanation: The correct answer is a) Climbing oil prices and monsoon deficit. The Finance Ministry identified these as risks to the economic outlook.

3. What indicators were cited by the Finance Ministry as signals of healthy economic activity?
a) Record e-way bills generation and electronic toll collections
b) Climbing oil prices and monsoon deficit
c) High food inflation and declining core inflation
d) International bond yield and S&P 500 index

Explanation: The correct answer is a) Record e-way bills generation and electronic toll collections. The Finance Ministry cited these indicators as signals of healthy economic activity.

4. What does the Finance Ministry’s monthly economic review for August reveal about the private sector?
a) Private sector is in good health and businesses are investing
b) Private sector is facing a decline in advance tax payments
c) Private sector is experiencing a stock market correction
d) Private sector formation cycle has come to a halt

Explanation: The correct answer is a) Private sector is in good health and businesses are investing. The review revealed that the private sector is in good health based on data on advance tax payments for the second quarter.

5. According to the Finance Ministry, what is the outlook for inflation in the country?
a) Food inflation remains high, but core inflation has declined
b) Inflation is within the RBI tolerance limit of 5.6%
c) Core inflation is the lowest in the last 40 months
d) Government interventions have targeted specific crops to ease inflation

Explanation: The correct answer is a) Food inflation remains high, but core inflation has declined. The review mentioned that food inflation eased due to government interventions, but core inflation has declined for the last three consecutive months.

Brief Summary | UPSC – IAS

The Indian Finance Ministry is confident that the country’s economy will achieve 6.5% growth in the fiscal year 2024. Despite concerns over rising crude oil prices and a monsoon deficit, the ministry believes that improved corporate profitability, private capital formation, and bank credit growth will drive the growth. While the rise in global oil prices is a concern, the ministry does not believe it is cause for alarm yet. Additionally, the ministry expects food prices to stabilize and inflation to ease due to government interventions. The ministry also highlighted positive indicators such as high e-way bill and toll collections, as well as increased capital goods imports.

“Vikram Lander Generates Bright Lunar ‘Ejecta Halo’ in Chandrayaan-3 Mission”

Chandrayaan-3’s Vikram Lander Generates “Ejecta Halo” on Lunar Surface


Vikram Lander of Chandrayaan-3 can be seen resting on the surface of the moon in this image clicked with Pragyan Rover’s navigation camera.

Vikram Lander of Chandrayaan-3 can be seen resting on the surface of the moon in this image clicked with Pragyan Rover’s navigation camera. | Photo Credit: ISRO

Significance of Vikram Lander’s “Ejecta Halo”

Chandrayaan-3’s lander module, Vikram, made a historic touchdown on the south pole of the moon on August 23, generating an intriguing phenomenon called the “ejecta halo.” This phenomenon has been the subject of a new study published in the Journal of the Indian Society of Remote Sensing on October 26. The findings shed light on the effects and characteristics of Vikram’s landing on the lunar surface.

Features and Objectives

The study titled “Characterisation of Ejecta Halo on the Lunar Surface Around Chandrayaan-3 Vikram Lander Using OHRC Imagery” analyzed high-resolution imagery from the Orbiter High-Resolution Camera (OHRC) of the Chandrayaan-2 orbiter. The research team aimed to explore the phenomenon of the “ejecta halo” and understand its extent and composition. By comparing pre- and post-landing imagery, they identified a bright patch surrounding the lander, known as the “ejecta halo,” which was caused by lunar dust being raised and displaced during the landing sequence.

Effects of the “Ejecta Halo”

The study estimated that the landing of Vikram Lander resulted in the ejection and displacement of approximately 2.06 tonnes of lunar epi regolith (a type of lunar surface material) over an area of 108.4 m² around the landing site. This finding provides valuable insight into the geological impact of lunar landings and helps expand our knowledge of lunar surface dynamics.

Pros and Cons

The discovery of the “ejecta halo” demonstrates the success of the Chandrayaan-3 mission and highlights India’s achievement as the fourth country to successfully land a spacecraft on the moon. By studying the effects of lunar landings, scientists can gain a better understanding of the moon’s composition and how it has evolved over time. However, the displacement of lunar regolith may also have unintended consequences, such as potentially obscuring or disturbing the surrounding lunar environment. Further research is needed to fully assess any negative impacts and mitigate them in future lunar missions.

Fun Fact

Did you know that Vikram Lander and its companion, the Pragyan Rover, successfully carried out an experiment where the lander hopped about 40 cm and landed safely at a short distance? This hop experiment was a significant milestone in the mission’s development and demonstrated the capabilities of the lunar lander.

Mutiple Choice Questions

1. What is the name of the lander module of Chandrayaan-3 that generated an ‘ejecta halo’ on the lunar surface?
a) Vikram
b) Pragyan Rover
c) Chandrayaan-3
d) ISRO

Explanation: The lander module of Chandrayaan-3 that generated an ‘ejecta halo’ on the lunar surface is called Vikram.

2. When did the historic touchdown of Vikram lander module occur on the south pole of the moon?
a) August 23
b) October 26
c) August 23, 2023
d) August 29

Explanation: The historic touchdown of the Vikram lander module on the south pole of the moon occurred on August 23.

3. What did Vikram lander module generate around itself when it landed on the moon?
a) Dust storm
b) Bright patch
c) Ejecta halo
d) Lunar regolith

Explanation: When Vikram lander module landed on the moon, it generated a bright patch around itself.

4. Where were the findings regarding the ‘ejecta halo’ of Vikram lander module published?
a) Journal of Lunar Science
b) Journal of Astrophysics
c) Journal of the Indian Society of Remote Sensing
d) Journal of Space Exploration

Explanation: The findings regarding the ‘ejecta halo’ of Vikram lander module were published in the Journal of the Indian Society of Remote Sensing.

5. How much lunar epi regolith material was estimated to be ejected and displaced by Vikram lander module?
a) 1.06 tonnes
b) 2.06 tonnes
c) 3.06 tonnes
d) 4.06 tonnes

Explanation: The estimation suggests that approximately 2.06 tonnes of lunar epi regolith material were ejected and displaced by Vikram lander module.

Brief Summary | UPSC – IAS

Chandrayaan-3’s lander module, Vikram, created an ‘ejecta halo’ on the surface of the moon during its landing on August 23. A study published in the Journal of the Indian Society of Remote Sensing revealed that Vikram raised lunar dust and generated a bright patch around itself upon touchdown. The study estimated that approximately 2.06 tonnes of lunar epi regolith were ejected and displaced over an area of 108.4 m² around the landing site. These findings provide further insight into the landing sequence and the behavior of lunar regolith. Efforts to revive Vikram and the rover after a lunar day have been unsuccessful.

“Global Debt Hits Record $307 Trillion as Borrowing Soars in Q2”

What are the reasons for rise in global debt? | Explained

The Rising Global Debt: Significance, Features, Objectives, Effects, and Pros and Cons


Global debt refers to the borrowings of governments as well as private businesses and individuals. Photo: imf.org

The story so far: Global debt rose to an all-time high of $307 trillion in the second quarter, by the end of June 2023, the Institute of International Finance (IIF) said in a report released last week. Quite notably, global debt has risen by about $100 trillion over the last decade. Further, global debt as a share of gross domestic product (GDP) has started to increase once again to hit 336% after dropping quite steeply for seven consecutive quarters.

What is Global Debt?

Global debt refers to the borrowings of governments as well as private businesses and individuals. Governments borrow to meet various expenditures that they are unable to meet through tax and other revenues. Governments may also borrow to pay interest on the money that they have already borrowed to fund past expenditures. The private sector borrows predominantly to make investments.

Why is Global Debt Rising?

Both global debt in nominal terms and global debt as a share of GDP have been rising steadily over the decades. The rise came to a halt during the pandemic as economic activity turned sluggish and lending slowed down. But global debt levels, it seems, have started to rise again in the last few quarters. Most (over 80%) of the rise in global debt in the first half of the year has come from advanced economies such as the U.S., the U.K., Japan, and France. Among emerging market economies, China, India, and Brazil have seen the most growth in debt. During the first half of 2023, total global debt rose by $10 trillion. This has happened amid rising interest rates, which was expected to adversely affect demand for loans.

However, a rise in debt levels over time is to be expected since the total money supply usually steadily rises each year in countries across the globe. In other words, the rise in global debt levels witnessed during the first half of the year is nothing out of the ordinary and does not per se have to mean trouble for the global economy. In fact, even a simple rise in the total amount of savings in an economy can cause a rise in debt levels as these increased savings are channeled into investments.

What is more interesting than rising debt levels is the drop in global debt as a share of GDP over seven consecutive quarters prior to 2023.

The IIF attributes the decline in global debt as a share of GDP to the rise in price inflation, which it claims has helped governments to inflate away the debts denominated in their local currencies. Inflating away of debt refers to the phenomenon wherein the central bank of a country either directly or indirectly uses freshly created currency to effectively pay off outstanding government debt by, for example, purchasing government bonds in the market. But the creation of fresh money causes prices to rise, thus imposing an indirect tax on the wider economy to pay the government’s debt.

Is Rising Global Debt a Cause for Worry?

Rising global debt levels usually lead to concerns about the sustainability of such debt. This is particularly true in the case of government debt, which is prone to rise rapidly due to reckless borrowing by politicians to fund populist programs. And when central banks raise interest rates, servicing outstanding debt becomes a challenge for governments with a heavy debt burden.

It should be noted that despite rising debt levels over the last decade, the interest that governments had to pay lenders largely remained manageable due to extremely low interest rates, particularly in western economies. This is set to change now as central banks have let interest rates rise in order to fight high price inflation since the pandemic. Rising interest rates can increase pressure on governments and force them to either default outright or inflate away their debt. Many analysts, in fact, believe that several governments will never be able to pay their debt in full and that inflating away debt is the only way for such governments to avoid an outright default on their debt.

In its report, the IIF has also warned that the international financial infrastructure is not equipped to handle unsustainable domestic debt levels. Generally, rapidly rising private debt levels also lead to worries among analysts about their sustainability. This is because such a rise is linked to unsustainable booms that end in economic crises when such lending is not backed by genuine savings.

Also read | India’s FY23 external debt rises to $624.7 billion: RBI

The most recent example of the same was the 2008 global financial crisis. The crisis was immediately preceded by an economic boom fueled by the U.S. Federal Reserve’s easy credit policy.

Fun Fact:

Did you know that global debt has risen by approximately $100 trillion over the last decade?

Mutiple Choice Questions

1) What does global debt refer to?
a) Borrowings of governments only
b) Borrowings of private businesses and individuals only
c) Borrowings of governments as well as private businesses and individuals
d) Borrowings of international organizations

Explanation: Global debt refers to the borrowings of governments as well as private businesses and individuals. Governments borrow to meet various expenditures, while the private sector borrows predominantly to make investments.

2) What has been the trend in global debt over the last decade?
a) It has remained stable
b) It has decreased by $100 trillion
c) It has increased by $100 trillion
d) It has fluctuated periodically

Explanation: Global debt has risen by about $100 trillion over the last decade, reaching an all-time high of $307 trillion in the second quarter of 2023.

3) Why has global debt started to rise again in recent quarters?
a) Economic activity has turned sluggish
b) Lending has slowed down
c) Advanced economies have significantly increased their borrowing
d) Emerging market economies have significantly increased their borrowing

Explanation: Global debt levels have started to rise again in recent quarters, with most of the rise coming from advanced economies such as the U.S., the U.K., Japan, and France. China, India, and Brazil have also seen significant growth in debt.

4) How has the decline in global debt as a share of GDP been attributed?
a) Rise in price inflation
b) Government’s purchase of government bonds
c) Increase in money supply
d) Creation of fresh money causing prices to rise

Explanation: The decline in global debt as a share of GDP over seven consecutive quarters prior to 2023 has been attributed to the rise in price inflation. Inflating away of debt refers to the phenomenon where the central bank uses freshly created currency to effectively pay off outstanding government debt.

5) What are the concerns associated with rising global debt levels?
a) Sustainability of debt
b) High interest rates
c) Risk of default
d) All of the above

Explanation: Rising global debt levels lead to concerns about the sustainability of such debt, particularly in the case of government debt. When central banks raise interest rates, servicing outstanding debt becomes a challenge for heavily indebted governments, increasing the risk of default.

6) What is the potential consequence of rising interest rates on governments with heavy debt burdens?
a) Default on debt
b) Inflating away debt
c) Increase in savings
d) Decrease in borrowing

Explanation: Rising interest rates can increase pressure on governments with heavy debt burdens and force them to either default outright or inflate away their debt. Many analysts believe that inflating away debt is the only way for governments to avoid an outright default.

7) What is the concern associated with rapidly rising private debt levels?
a) Unsustainable booms
b) Economic crises
c) Lack of genuine savings
d) All of the above

Explanation: Rapidly rising private debt levels lead to worries about unsustainable booms that can end in economic crises when such lending is not backed by genuine savings.

Overall Explanation: Global debt refers to the borrowings of governments as well as private businesses and individuals. It has risen by about $100 trillion over the last decade, reaching an all-time high of $307 trillion in the second quarter of 2023. The recent rise in global debt levels can be attributed to increased borrowing by both advanced and emerging market economies. The decline in global debt as a share of GDP over seven consecutive quarters prior to 2023 was due to the rise in price inflation. Concerns associated with rising global debt levels include debt sustainability, high interest rates, and the risk of default for heavily indebted governments. Rising interest rates can increase pressure on governments to either default or inflate away their debt. Rapidly rising private debt levels can lead to unsustainable booms and economic crises when not backed by genuine savings.

Brief Summary | UPSC – IAS

Global debt reached a record high of $307 trillion by the end of June 2023, a $100 trillion increase over the past decade, according to the Institute of International Finance (IIF). Debt-to-GDP ratios have started to rise again, reaching 336% after seven consecutive quarters of decline. The majority of the increase in global debt in the first half of the year came from advanced economies like the US, UK, Japan, and France, as well as emerging markets such as China, India, and Brazil. While rising debt levels are a concern, the decline in debt as a share of GDP in previous quarters was attributed to inflation helping governments inflate away their debt. Rising interest rates could increase pressure on governments to pay their debt, and the IIF has warned that the international financial infrastructure is not equipped to handle unsustainable levels of debt.

“Seismic Swarm in Reykjanes Peninsula Sparks Volcano Eruption Concern”

Iceland hit by ‘seismic swarm‘ of small earthquakes in volcano warning

The Reykjanes Peninsula Seismic Swarm: A Sign of Impending Volcanic Eruption in Iceland


Lava spurts and flows after the eruption of a volcano in the Reykjanes Peninsula, Iceland, July 12, 2023, as seen in this handout picture taken from a Coast Guard helicopter.

Lava spurts and flows after the eruption of a volcano in the Reykjanes Peninsula, Iceland, July 12, 2023, as seen in this handout picture taken from a Coast Guard helicopter.
| Photo Credit: Civil Protection of Iceland/Reuters

Significance

A seismic swarm of more than 5,500 small earthquakes in the last three days has hit the Reykjanes peninsula in southwest Iceland, indicating the possibility of an imminent volcanic eruption. Iceland, located between the Eurasian and the North American tectonic plates, is renowned for its seismic and volcanic activities.

Features

Iceland is situated between two of the largest tectonic plates in the world, making it an area prone to seismic and volcanic events. The recent swarm of earthquakes on the Reykjanes peninsula is more extensive than usual, serving as warning signs of a potential volcanic eruption.

Objectives

The seismic activity acts as a long-term warning system for volcanic eruptions, allowing scientists and authorities to prepare and mitigate potential risks. Monitoring and studying the earthquakes help forecast the timing and magnitude of volcanic outbreaks, ensuring the safety of nearby communities.

Effects

The earthquakes originated from the pressure buildup of magma beneath the Earth’s surface, slowly drifting towards the surface. The occurrence of similar seismic swarms in the past has led to volcanic eruptions. The Reykjanes peninsula experienced a volcanic eruption earlier this year, and another eruption may be imminent.

Pros and Cons

The seismic swarm allows scientists and authorities to be proactive in evacuation and emergency response preparations, potentially minimizing the impact on human life and infrastructure. However, volcanic eruptions can still cause displacement, destruction, and environmental changes in affected areas.

Fun Fact

Iceland gets its name from the abundance of ice covering its landscapes. However, the country is also known as the “Land of Fire and Ice” due to its active volcanoes coexisting with glaciers.

In conclusion, the ongoing seismic swarm on the Reykjanes peninsula in Iceland indicates the possibility of an upcoming volcanic eruption. These earthquakes serve as crucial warning signs for scientists and authorities to monitor the situation closely. While the occurrence of seismic activity presents challenges and potential risks, proper preparedness and response measures can help mitigate the impact on human life and infrastructure. Understanding the significance, features, objectives, effects, and potential pros and cons of such events is crucial for ensuring the safety and well-being of communities living in volcanic regions. As Iceland’s unique geological setting makes it a hot spot for seismic and volcanic activities, it continues to be an area of great interest for scientific research and exploration.

Mutiple Choice Questions

1. What is the cause of the seismic swarm in the Reykjanes peninsula?

a) Plate tectonics
b) Volcanic eruption
c) Human activity
d) Global warming

Explanation: The seismic swarm in the Reykjanes peninsula is caused by plate tectonics. The peninsula is located between the Eurasian and the North American tectonic plates, which are among the largest on the planet. As these plates move in opposite directions, it creates seismic and volcanic activity in Iceland.

2. How many small earthquakes have occurred in the last three days in the Reykjanes peninsula?

a) More than 500
b) More than 1,000
c) More than 5,000
d) More than 10,000

Explanation: According to the country’s meteorological office (IMO), more than 5,500 small earthquakes have occurred in the last three days in the Reykjanes peninsula. This is a significant number and raises the prospect of a volcanic eruption.

3. What is the relationship between the earthquake activity and the next volcanic eruption?

a) There is no relationship
b) Earthquakes are a warning sign of a volcanic eruption
c) Earthquakes prevent volcanic eruptions
d) Earthquakes are caused by volcanic eruptions

Explanation: The earthquake activity in the Reykjanes peninsula is considered a warning sign of a volcanic eruption. According to the IMO Service and Research division head, Matthew Roberts, these earthquakes are part of a longer-term story indicating that the region is entering a build-up phase to the next volcanic eruption.

4. How deep are the earthquakes in the Reykjanes peninsula?

a) Up to 1 km
b) Up to 3 km
c) Up to 5 km
d) Up to 10 km

Explanation: The earthquakes in the Reykjanes peninsula have originated at a depth of up to 5 km. These earthquakes are caused by a long-term accumulation of magma, which has been building pressure and is slowly drifting towards the surface of the earth.

5. How likely is an eruption within the next 12 months, according to Matthew Roberts?

a) Highly unlikely
b) Somewhat likely
c) Moderately likely
d) Very likely

Explanation: According to Matthew Roberts, an eruption within the next 12 months is likely. He mentioned that as a scientist who has been closely following the activity, he believes that the seismic swarm is indicating the build-up phase to the next volcanic eruption.

6. What is the magnitude of the strongest earthquake recorded in the Reykjanes peninsula?

a) 2.5
b) 3.0
c) 4.5
d) 5.0

Explanation: The strongest earthquake recorded in the Reykjanes peninsula has a magnitude of 4.5. Additionally, around 15 tremors were measured at a magnitude of 3.0 or stronger. Earthquakes with a magnitude above 2.5 can often be felt by humans.

7. Which town on the peninsula is closest to the seismic activity?

a) Reykjavik
b) Grindavík
c) Michigan
d) Civil Protection

Explanation: Grindavík, a fishing town on the Reykjanes peninsula, is the town closest to the seismic activity. Grindavík has a population of around 2,000 inhabitants.

Note: It’s important to refer to additional sources and cross-check the information to ensure accuracy in the answer key. The provided explanation is based on the information given in the text provided.

Brief Summary | UPSC – IAS

A seismic swarm of over 5,500 small earthquakes has occurred in southwest Iceland’s Reykjanes peninsula, prompting concern of a volcanic eruption, according to the country’s meteorological office. The peninsula sits between the Eurasian and North American tectonic plates, making Iceland a seismic and volcanic hotspot. While earthquakes are common in the region, this swarm has been larger than usual and is seen as a warning sign of a potential eruption in the near future. The quakes were caused by the accumulation of magma under the surface, and experts predict that an eruption could occur within the next 12 months.

“Ineptitude of Modi Government: Rising Unemployment and Inflation Strain Ordinary Households, says Congress MP”

Ordinary households, small businesses hit due to high unemployment and inflation: Jairam Ramesh

Ordinary households and small businesses under intense pressure, says Congress MP Jairam Ramesh


Congress MP Jairam Ramesh. File

Ordinary households and small businesses are currently facing intense pressure due to high unemployment and inflation levels. This statement was made by Congress General Secretary in-charge of Communications, Jairam Ramesh, who cited data points from the Reserve Bank of India’s latest bulletin and other sources to support his claim. The statement aims to highlight the difficulties faced by the majority of people amidst the government’s claims of economic growth.

According to Mr. Ramesh, the government’s argument that declining savings were a result of car and home purchases is invalid. Instead, he pointed to RBI data showing a significant increase in gold loans and personal loans in the last year, indicating that people are going into debt to meet basic expenses. These figures indicate clear signs of distress among the population.

Mr. Ramesh further criticized the Modi government’s response to the COVID-19 pandemic, stating that the latest RBI bulletin exposes its failure to execute a recovery. He highlighted the decline in labor force participation, with only 40% of the population in the labor force as of now compared to 43% in February 2020. He also mentioned the significant gender pay gap that still exists, as women are earning only 85% of what they made before the pandemic. Additionally, he cited a report from Azim Premji University, revealing that over 42% of graduates under the age of 25 were unemployed in 2021-22.

Rise in prices

Mr. Ramesh drew attention to the rising prices of essential commodities such as pulses, sugar, atta, besan, and gur, which have had a direct impact on the household budgets of ordinary families. He also noted a 16% fall in Foreign Direct Investment (FDI), attributing this decline to the government’s failed economic policies and communal tensions.

The Congress leader emphasized how small businesses are suffering under the Modi government’s crony capitalism, making it nearly impossible for MSMEs to compete. He referenced a Marcellus report which states that 80% of profits in 2022 went to just 20 companies. Moreover, he highlighted the decline in the share of sales for small businesses, dropping from 7% before 2014 to 4% in Q1 of 2023.

Mr. Ramesh concluded his statement by stating that the Modi government has mismanaged the economy across all sectors, leading to increasing unemployment, rising prices, shrinking MSME sales, slow domestic credit growth, increased household financial liabilities, and declining FDI. He remarked that the government is too inept to resolve these issues.

Significance: Jairam Ramesh’s statement sheds light on the challenging economic conditions faced by ordinary households and small businesses. It highlights the discrepancy between the government’s claims of economic growth and the reality experienced by the majority of citizens. This brings attention to the need for effective policies to alleviate the financial strain on the population.

Features: The statement includes data points from the Reserve Bank of India and other sources to support the claims made by Jairam Ramesh. It addresses various aspects of the economy, such as unemployment, inflation, labor force participation, gender pay gap, rising prices of essential commodities, and the impact on small businesses.

Objectives: The main objective of the statement is to highlight the struggles faced by ordinary households and small businesses due to economic hardships. It aims to criticize the government’s handling of the economy and call attention to the need for effective measures to alleviate these difficulties.

Effects: The statement may create public awareness about the economic challenges faced by individuals and small businesses. It may also put pressure on the government to address these issues and formulate better economic policies to promote growth, reduce unemployment, and control inflation.

Pros:
– Draws attention to the economic hardships faced by ordinary households and small businesses
– Provides data evidence to support the claims made
– Raises awareness about the government’s alleged mismanagement of the economy
– Calls for effective measures to alleviate financial strain and promote economic growth

Cons:
– The statement may be perceived as politically motivated due to the involvement of a Congress party representative
– Critics may argue that the statement only presents a one-sided view and ignores positive aspects of the economy
– Some may question the accuracy or reliability of the data presented

Fun Fact: Did you know that India is the world’s largest consumer of gold? The demand for gold in the country is driven by cultural traditions and the belief in gold as a symbol of wealth and prosperity.

Mutiple Choice Questions

1. According to Jairam Ramesh, Congress General Secretary, what is the current state of households and small businesses in India?
a) They are flourishing and experiencing economic growth
b) They are under intense pressure due to high unemployment and inflation levels
c) They are facing no significant challenges or issues
d) They are thriving due to effective government policies

Answer: b) They are under intense pressure due to high unemployment and inflation levels

Explanation: Jairam Ramesh states in his statement that ordinary households and small businesses in India are under intense pressure due to high unemployment and inflation levels.

———————————————————————————————————————–

2. Based on RBI data, what are the clear signs of distress mentioned by Jairam Ramesh?
a) A decline in savings due to increased car and home purchases
b) A decline in personal loans and a decrease in gold loans
c) A 23% increase in gold loans and a 29% increase in personal loans
d) A decrease in debt and basic expenses

Answer: c) A 23% increase in gold loans and a 29% increase in personal loans

Explanation: Jairam Ramesh highlights RBI data which shows a 23% increase in gold loans and a 29% increase in personal loans in the last year, which he considers as clear signs of distress as people go into debt to meet basic expenses.

———————————————————————————————————————–

3. According to Jairam Ramesh, what does the latest bulletin of the RBI show about the Modi government’s recovery from the COVID-19 pandemic?
a) A successful execution of the recovery
b) A partial failure in executing the recovery
c) A complete failure in executing the recovery
d) A steady progress in executing the recovery

Answer: c) A complete failure in executing the recovery

Explanation: Jairam Ramesh states that the latest bulletin of the RBI shows the complete failure of the Modi government to execute a recovery from the COVID-19 pandemic.

———————————————————————————————————————–

4. What percentage of the population was in the labor force as of February 2020 according to Mr. Ramesh?
a) 43%
b) 40%
c) 85%
d) 42%

Answer: a) 43%

Explanation: Jairam Ramesh mentions that around 43% of the population was in the labor force as of February 2020.

———————————————————————————————————————–

5. What is the impact of price rise in essential commodities, according to Jairam Ramesh?
a) It is not affecting ordinary families’ household budgets
b) It is leading to increased savings for ordinary families
c) It is impacting the household budget of ordinary families
d) It is not a major concern for ordinary families

Answer: c) It is impacting the household budget of ordinary families

Explanation: Jairam Ramesh highlights the price rise in essential commodities such as pulses, sugar, atta, besan, and gur, and states that it is impacting the household budget of ordinary families.

———————————————————————————————————————–

6. According to Jairam Ramesh, what is the reason for the decline in small businesses’ share in sales?
a) Increased competition from large corporations
b) Decreased demand for their products or services
c) Ineffective government policies
d) Modi government’s crony capitalism

Answer: d) Modi government’s crony capitalism

Explanation: Jairam Ramesh states that small businesses are losing out because of the Modi government’s crony capitalism, which has made it “impossible for the MSMEs to compete.”

———————————————————————————————————————–

7. How has the Modi government mismanaged the economy, according to Jairam Ramesh?
a) By effectively managing all sectors
b) By increasing unemployment and household financial liabilities
c) By decreasing inflation and improving savings
d) By implementing successful economic policies

Answer: b) By increasing unemployment and household financial liabilities

Explanation: Jairam Ramesh accuses the Modi government of mismanaging the economy by increasing unemployment, rising prices of household essentials, shrinking MSME sales, slow domestic credit growth, increased household financial liabilities, and declining FDI.

Brief Summary | UPSC – IAS

Congress General Secretary Jairam Ramesh criticized the Indian government for its failure to address the economic challenges faced by ordinary households and small businesses. Ramesh cited data from the Reserve Bank of India’s bulletin, showing a rise in gold loans and personal loans, as clear signs of distress as people go into debt to meet basic expenses. He also mentioned a decrease in savings and highlighted the impact of rising prices of essential commodities. Ramesh further criticized the government for crony capitalism, which he claimed disadvantaged small businesses and deterred foreign investors. He concluded by stating that the government was inept in managing the economy.

“Partial Lunar Eclipse to Grace West Bengal and Asia on October 28”

Partial lunar eclipse to take place tonight

Partial Lunar Eclipse to Illuminate the Night Sky on October 28


Moon partially covered by the earth’s shadow during lunar eclipse. File.

Moon partially covered by the earth’s shadow during lunar eclipse. File.
| Photo Credit: PTI

Significance of the Partial Lunar Eclipse

On the night of October 28, a partial lunar eclipse will grace the skies over West Bengal and various parts of India, as well as Asia, Europe, Africa, and Russia. This celestial event, as explained by astrophysicist Debi Prasad Duari, holds great significance for stargazers and astronomy enthusiasts alike.

Features of the Lunar Eclipse

The partial lunar eclipse will commence on October 28 and extend into the early hours of October 29. During this time, spectators in India and other countries will have the opportunity to observe the moon partially entering the shadow of the Earth.

A lunar eclipse occurs in two stages. Initially, the moon enters the penumbral region, where it is only partially shadowed by Earth, resulting in a slight change in brightness. Subsequently, it progresses into the umbral region, the true dark part of Earth’s shadow, which is considered the actual eclipse.

Objectives of the Lunar Eclipse Observation

The observation of lunar eclipses allows scientists and astronomers to deepen their understanding of celestial mechanics and the interactions between the Earth, Moon, and Sun. It provides an opportunity to study the composition of Earth’s atmosphere through the scattering and filtering of sunlight that occurs during an eclipse.

Effects of the Partial Lunar Eclipse

As the moon partially enters Earth’s shadow, the appearance of the lunar disc will be obscured, offering a unique visual experience. The magnitude of the partial lunar eclipse will be approximately 0.12, indicating the extent of obscuration of the moon’s surface.

Pros and Cons

While lunar eclipses are captivating and offer valuable scientific insights, they do not present any significant cons or drawbacks. However, weather conditions and light pollution can impact the viewing experience.

Fun Fact

Just two weeks prior to the partial lunar eclipse, on October 14, a different celestial phenomenon occurred. An annular solar eclipse captured the attention of observers in North and South America, featuring the mesmerizing “ring of fire” across the sky. Unfortunately, this event was not visible in India and Asia due to the timing and corresponding daylight hours.

This eclipse coincided with the start of Navratri, a major festival in India, including Durga Puja celebrated in West Bengal. Furthermore, it marked the day of Mahalaya, when people pay homage to their ancestors, symbolizing the commencement of the Durga Puja Festival.

By sharing the wonders of celestial events such as lunar eclipses, teachers can help foster curiosity and captivate students’ interest in the field of astronomy. Encouraging them to observe and appreciate these phenomena can inspire a lifelong passion for science and exploration.

Mutiple Choice Questions

1) Which parts of the world will witness the partial lunar eclipse on the night of October 28?

a) West Bengal, India
b) North and South America
c) Asia, Europe, Africa, and Russia
d) Only West Bengal

Answer: c) Asia, Europe, Africa, and Russia

Explanation: According to the given information, the partial lunar eclipse on the night of October 28 can be witnessed in Asia, Europe, Africa, and Russia.

2) When will the partial umbral eclipse, which is more noticeable, start during the event?

a) 11:31 p.m. IST
b) 1:05 a.m. IST
c) 1:44 a.m. IST
d) 2:23 a.m. IST

Answer: b) 1:05 a.m. IST

Explanation: As mentioned in the text, the partial umbral eclipse, which is more noticeable, will start in the early hours of October 29 at around 1:05 a.m. IST.

3) What is the magnitude of the partial lunar eclipse?

a) 0.12
b) 1.44
c) 2.23
d) 0.23

Answer: a) 0.12

Explanation: The given information states that the magnitude of the partial lunar eclipse will be around 0.12, marked by the maximum obscuration of the lunar disc.

4) What is the difference between a penumbral eclipse and an umbral lunar eclipse?

a) A penumbral eclipse is when the moon is fully covered by the shadow of the earth, while an umbral eclipse is when the moon is partially covered.
b) A penumbral eclipse is when the moon enters a partially shadowed region of the earth and remains partly lighted, while an umbral eclipse is when the moon partially enters the actual dark part of the earth’s shadow.
c) A penumbral eclipse is when the moon is partially covered by the shadow of the earth for some time, while an umbral eclipse is when the moon is fully illuminated.
d) A penumbral eclipse is the actual eclipse, while an umbral eclipse is just a phase of the moon.

Answer: b) A penumbral eclipse is when the moon enters a partially shadowed region of the earth and remains partly lighted, while an umbral eclipse is when the moon partially enters the actual dark part of the earth’s shadow.

Explanation: The provided information explains that a penumbral eclipse occurs when the moon enters a partially shadowed region of the earth and remains partly lighted. On the other hand, an umbral lunar eclipse is when the moon partially enters the actual dark part of the earth’s shadow.

5) What celestial event occurred on October 14?

a) Partial lunar eclipse
b) Solar eclipse
c) Full moon
d) New moon

Answer: b) Solar eclipse

Explanation: The given information states that on October 14, there was an annular solar eclipse, which was experienced by people in North and South America.

Brief Summary | UPSC – IAS

On the night of October 28, there will be a partial lunar eclipse visible in West Bengal, India, as well as across Asia, Europe, Africa, and Russia. The eclipse will begin late on October 28 and continue until the early hours of October 29. Astrophysicist Debi Prasad Duari explained that the moon will be partially eclipsed by the Earth’s shadow, giving people the opportunity to experience a partial lunar eclipse. The penumbral eclipse will start at approximately 11:31 p.m. IST, with the more noticeable umbral eclipse beginning at around 1:05 a.m. IST on October 29. The eclipse will reach its maximum at 1:44 a.m. and end by 2:23 a.m. The magnitude of the partial lunar eclipse will be approximately 0.12.

“Aadhaar Security and Privacy Dismissed by Electronics and IT Ministry in Response to Moody’s Report”

Government rebuffs Moody’s Aadhaar views; says a billion Indians trust it

Understanding Aadhaar: Significance, Features, Objectives, Effects, and Pros and Cons

September 25, 2023 11:09 pm | Updated September 26, 2023 11:52 am IST – NEW DELHI

Representational image of a person going through the process of a fingerprint scanner for the Unique Identification (UID) database system at an Aadhaar enrollment centre
| Photo Credit: Reuters

The Aadhaar system, also known as the Unique Identification (UID) database system, has been a topic of discussion lately after a report from Moody’s Investors Service raised questions about its efficacy. The report highlighted concerns about security and privacy, as well as the reliability of biometric authentication systems in hot and humid conditions. In response, the Electronics and IT Ministry dismissed these concerns, emphasizing the trust and confidence expressed by over a billion Indians who have used Aadhaar over 100 billion times for authentication. Let’s delve deeper into Aadhaar’s significance, features, objectives, effects, and consider the pros and cons of this centralised system.

Significance of Aadhaar

Aadhaar holds immense significance as it serves as a unique identification system for individuals in India. It provides a 12-digit identification number based on biometric and demographic data. Aadhaar is considered the most trusted digital ID in the world, with numerous international agencies and institutions lauding its effectiveness. The system has gained widespread acceptance among the Indian population, with over a billion individuals using it for authentication.

Features of Aadhaar

Aadhaar’s features include biometric authentication systems such as fingerprint scanning, face authentication, and iris authentication. Additionally, mobile OTP (One-Time Passcode) is available for various use cases. The system also ensures privacy and security through robust technological and organizational arrangements. The data is encrypted both at rest and in motion, and the system adheres to international security and privacy standards.

Objectives of Aadhaar

The main objectives of Aadhaar are:

  1. To establish a unique identification system for individuals in India.
  2. To streamline and simplify the process of accessing government services and subsidies.
  3. To enhance financial inclusion by facilitating the opening of bank accounts.
  4. To eliminate duplicate and fake identities, reducing identity-related fraud and corruption.
  5. To enable the delivery of services and benefits directly to the intended beneficiaries.

Effects of Aadhaar

Aadhaar has had several significant effects since its implementation:

  • Enhanced access to government services and subsidies for individuals, particularly those in rural areas.
  • Promotion of financial inclusion by providing a unique identification system linked to bank accounts.
  • Reduction in identity-related fraud and corruption.
  • Streamlined administration and delivery of services, leading to improved efficiency and accountability.

Pros and Cons of Aadhaar

As with any system, Aadhaar has its share of pros and cons:

Pros:

  1. Simplifies access to government services and subsidies, making them more accessible to the general population.
  2. Reduces identity-related fraud and corruption by eliminating duplicate and fake identities.
  3. Enhances financial inclusion by linking Aadhaar to bank accounts, making it easier for individuals to access financial services.
  4. Streamlines administration and service delivery, improving efficiency and accountability in governance.

Cons:

  1. Concerns about security and privacy of personal data in a centralised system.
  2. Reliability issues with biometric authentication systems, especially in hot and humid conditions.

Overall, while Aadhaar has brought significant benefits and convenience to individuals in India, it is essential to address the concerns related to privacy and security.

Fun Fact: The G-20 New Delhi Declaration has welcomed India’s plan to build and maintain a Global Digital Public Infrastructure Repository (GDPIR), a virtual DPI repository shared voluntarily by G-20 members and beyond, indicating the trust and recognition of India’s expertise in digital identification systems.

Mutiple Choice Questions

1. What is the title of the note issued by the Electronics and IT Ministry?
a) “Aadhaar and its Impact on Digital ID Systems”
b) “Moody’s Report: Concerns about Aadhaar’s Efficacy”
c) “The Trustworthiness of Aadhaar as a Digital ID”
d) “International Agencies’ Opinions on Aadhaar”

Explanation: The note issued by the Electronics and IT Ministry is titled “Aadhaar, the most trusted digital ID in the world — Moody’s Investors Service opinions baseless”.

2. According to the Ministry, how many times have Indians used Aadhaar to authenticate themselves?
a) Over 100 million times
b) Over 1 billion times
c) Over 100 billion times
d) Over 1 trillion times

Explanation: The Ministry stated that over a billion Indians have expressed their trust in Aadhaar by using it to authenticate themselves “over 100 billion times”.

3. What risks did Moody’s highlight regarding Aadhaar’s biometric authentication systems?
a) Service denials and unreliable performance in hot and humid conditions
b) Privacy breaches and security vulnerabilities
c) Lack of trust and low adoption rates
d) Inaccuracy in data collection and user identification

Explanation: Moody’s highlighted risks such as service denials for users and the unreliability of biometric authentication systems in hot and humid conditions.

4. How does the Ministry refute Moody’s concerns regarding biometric authentication and service denials?
a) By emphasizing the use of mobile OTP and contactless biometric submission methods
b) By conducting a comprehensive study on the performance of Aadhaar in manual labour-intensive sectors
c) By implementing stricter regulations on the usage of biometric data
d) By developing a more advanced biometric authentication system

Explanation: The Ministry refutes Moody’s concerns by highlighting that biometric submission is possible through contactless means like face authentication and iris authentication. They also mention the availability of mobile OTP as an alternative authentication method.

5. What security measures are in place for the Aadhaar system, according to the Ministry?
a) Encryption of data and compliance with international security and privacy standards
b) Regular system audits and vulnerability assessments
c) Use of AI and machine learning algorithms for data protection
d) Collaboration with international cybersecurity organizations

Explanation: The Ministry mentions that the Aadhaar system has state-of-the-art security solutions in place, with a federated database and encryption of data both at rest and in motion. They also highlight that the system is certified as per international security and privacy standards.

6. According to the G-20 Global Partnership for Financial Inclusion, what role has Aadhaar played in enhancing ownership of transaction accounts?
a) It has led to a decrease in ownership of transaction accounts.
b) It has had no significant impact on ownership of transaction accounts.
c) It has played a critical role in enhancing ownership of transaction accounts.
d) It has had a negative impact on the adoption of transaction accounts.

Explanation: The G-20 Global Partnership for Financial Inclusion, in a report prepared by the World Bank, stated that the implementation of Aadhaar, along with Jan Dhan bank accounts and mobile phones, has played a critical role in enhancing ownership of transaction accounts.

Brief Summary | UPSC – IAS

India’s Electronics and IT Ministry has rejected a report by Moody’s Investors Service that questioned the effectiveness of the country’s Aadhaar system. The ministry cited praise from international agencies and over a billion users who have authenticated themselves “over 100 billion times” as proof of the system’s success. Moody’s had raised concerns about service denials due to biometric authentication issues and the security of centralised systems, but the ministry said these claims lacked evidence. The ministry also highlighted that the G-20 New Delhi Declaration supported India’s plan to develop a Global Digital Public Infrastructure Repository.

“Indian Railway Zones: 18 Divisions Managing Vast Network”

how many railway zones of India

The Indian Railways: An Overview of the 18 Railway Zones

The Indian Railways is one of the largest railway networks in the world, connecting millions of people and transporting goods across the country. To efficiently manage and operate this vast network, the Indian Railways is divided into 18 railway zones. Each zone has its own administrative and operational responsibilities, ensuring smooth functioning of the railways within their respective regions. Let’s take a closer look at these 18 Indian Railways zones.

1. Northern Railway (NR)

As the name suggests, Northern Railway covers the northern regions of India, including states like Jammu & Kashmir, Punjab, Haryana, Uttar Pradesh, and parts of Rajasthan. Its headquarter is located in New Delhi.

2. North Eastern Railway (NER)

The North Eastern Railway zone serves the north-eastern states of India, including Bihar, Uttar Pradesh, Uttarakhand, and parts of Madhya Pradesh. Its headquarter is located in Gorakhpur.

3. Northeast Frontier Railway (NFR)

Covering the easternmost part of India, the Northeast Frontier Railway zone extends to the northeastern states of Assam, Arunachal Pradesh, Nagaland, Manipur, Mizoram, Tripura, and parts of Bihar and West Bengal. Its headquarter is located in Guwahati.

4. Eastern Railway (ER)

Eastern Railway zone covers the eastern parts of India, including West Bengal, Bihar, and Jharkhand. Its headquarter is located in Kolkata.

5. South Eastern Railway (SER)

The South Eastern Railway zone serves the southeastern regions of India, including West Bengal, Jharkhand, and parts of Odisha. Its headquarter is located in Kolkata.

6. South Central Railway (SCR)

South Central Railway zone covers the central and southern parts of India, including Andhra Pradesh, Telangana, Maharashtra, and parts of Karnataka and Tamil Nadu. Its headquarter is located in Secunderabad.

7. Southern Railway (SR)

Southern Railway zone extends to the southern states of India, including Tamil Nadu, Kerala, Puducherry, and parts of Andhra Pradesh and Karnataka. Its headquarter is located in Chennai.

8. Central Railway (CR)

Central Railway zone covers the central parts of India, including Maharashtra and parts of Madhya Pradesh and Karnataka. Its headquarter is located in Mumbai.

9. Western Railway (WR)

Western Railway zone serves the western regions of India, including Maharashtra, Gujarat, and parts of Rajasthan and Madhya Pradesh. Its headquarter is located in Mumbai.

10. South Western Railway (SWR)

The South Western Railway zone covers the southwestern parts of India, including Karnataka and parts of Maharashtra and Tamil Nadu. Its headquarter is located in Hubballi.

11. North Western Railway (NWR)

North Western Railway zone serves the northwestern regions of India, including Rajasthan, Punjab, and parts of Gujarat and Haryana. Its headquarter is located in Jaipur.

12. West Central Railway (WCR)

West Central Railway zone covers the central parts of India, including Madhya Pradesh and parts of Rajasthan and Maharashtra. Its headquarter is located in Jabalpur.

13. North Central Railway (NCR)

North Central Railway zone serves the central regions of India, including parts of Uttar Pradesh and Madhya Pradesh. Its headquarter is located in Prayagraj (formerly Allahabad).

14. East Central Railway (ECR)

East Central Railway zone covers the eastern and central parts of India, including Bihar and parts of Jharkhand and Uttar Pradesh. Its headquarter is located in Hajipur.

15. South East Central Railway (SECR)

The South East Central Railway zone serves the southeastern regions of India, including parts of Chhattisgarh, Odisha, and Maharashtra. Its headquarter is located in Bilaspur.

16. East Coast Railway (ECoR)

East Coast Railway zone covers the eastern coastal regions of India, including Odisha and parts of Andhra Pradesh. Its headquarter is located in Bhubaneswar.

17. Konkan Railway (KR)

The Konkan Railway is a separate entity from the Indian Railways. It covers the Konkan region of Maharashtra, including areas like Mumbai, Goa, and Mangalore.

18. Metro Railway, Kolkata

Metro Railway in Kolkata is another separate entity that operates the metro rail system in the city.

The significance of dividing the Indian Railways into zones is to ensure better management, efficient operations, and focused development of each region. It allows for a decentralized approach in decision-making, resource allocation, and service delivery.

Some of the key features of these railway zones include:

  • Headquarters: Each zone has its own administrative headquarters, which serve as the central control and coordination centers for that particular zone.
  • Divisional Offices: Within each zone, there are divisional offices responsible for managing and operating the railways at a more local level.
  • Railway Infrastructure: The zones are responsible for the maintenance, expansion, and development of railway tracks, stations, signaling systems, and other infrastructure within their respective regions.
  • Train Operations: The zones manage the scheduling, routing, and operation of trains within their regions, ensuring smooth movement of passengers and freight.

The objectives of having multiple railway zones in India are:

  • Efficient Management: Dividing the Indian Railways into zones allows for better management and coordination of resources, services, and operations.
  • Focused Development: Each zone can focus on the specific needs and requirements of its region, leading to targeted development and improvement.
  • Effective Administration: The zonal structure enables effective administration and decision-making at the local level, leading to quicker responses and solutions to problems.
  • Regional Connectivity: Railway zones contribute to better connectivity within their regions, enabling easier travel and transportation for people and goods.

The division of the Indian Railways into zones has had several effects:

  • Improved Operations: The zonal structure has led to improved operations, better utilization of resources, and increased efficiency in the Indian Railways.
  • Regional Development: Each zone has been able to focus on the specific needs and development of its region, resulting in improved infrastructure and services.
  • Employment Generation: The railway zones have created employment opportunities in various regions, contributing to local economic growth.
  • Connectivity and Mobility: Dividing the Indian Railways into zones has enhanced connectivity and mobility, making travel and transportation more accessible and convenient for people.

While the division of the Indian Railways into zones has several advantages, there are also some potential disadvantages or challenges. These may include:

  • Coordination Issues: With multiple zones, coordination between them and the central authority can sometimes be challenging, leading to delays or inefficiencies.
  • Inter-zonal Disparities: There may be variations in development and services across different zones, creating inequalities in access and facilities for passengers.
  • Infrastructure Maintenance: In some cases, maintenance and infrastructure development may be neglected or delayed due to resource constraints or administrative issues.

Fun Fact: Did you know that the Indian Railways operates the longest railway line in the world? The Vivek Express, running from Dibrugarh in Assam to Kanyakumari in Tamil Nadu, covers a distance of over 4,263 kilometers!

In conclusion, the 18 railway zones of the Indian Railways play a crucial role in managing and operating the vast railway network across India. They ensure efficient administration, focused development, and improved connectivity within their respective regions. While there are some challenges associated with the zonal structure, the overall impact of dividing the Indian Railways into zones has been positive, leading to enhanced services, development, and mobility for millions of people.

Sources:

For more information, you can visit the official website of the Indian Railways at indianrailways.gov.in.

how many railway zones of India
Image Source: geographystudy.com

Mutiple Choice Questions

1. How many railway zones are there in India?
a) 12
b) 15
c) 18
d) 21

Explanation: According to the provided information, there are 18 railway zones in India.

2. Which is the largest railway network in the world?
a) Indian Railways
b) Chinese Railways
c) Russian Railways
d) American Railways

Explanation: The Indian Railways is mentioned as one of the largest railway networks in the world.

3. Which zone of Indian Railways is responsible for managing the railway infrastructure and services in Kolkata?
a) Northern Railway (NR)
b) Metro Railway, Kolkata
c) Eastern Railway (ER)
d) South Eastern Railway (SER)

Explanation: Metro Railway, Kolkata is mentioned as a separate zone responsible for managing the railway infrastructure and services in Kolkata.

4. Which zone of Indian Railways is responsible for managing the railway infrastructure and services in Mumbai?
a) Western Railway (WR)
b) Central Railway (CR)
c) South Western Railway (SWR)
d) Konkan Railway (KR)

Explanation: Western Railway, according to the provided information, is responsible for managing the railway infrastructure and services in Mumbai.

5. How many zones of Indian Railways have “Central” in their name?
a) 1
b) 2
c) 3
d) 4

Explanation: According to the provided information, there is one zone with “Central” in its name, which is the Central Railway (CR).

6. Which is the southernmost zone of Indian Railways?
a) Southern Railway (SR)
b) South Central Railway (SCR)
c) South Western Railway (SWR)
d) South East Central Railway (SECR)

Explanation: Southern Railway is mentioned as the southernmost zone of Indian Railways.

7. Which zone of Indian Railways is responsible for managing the railway infrastructure and services in Delhi?
a) Northern Railway (NR)
b) North Eastern Railway (NER)
c) Northeast Frontier Railway (NFR)
d) East Central Railway (ECR)

Explanation: Northern Railway, according to the provided information, is responsible for managing the railway infrastructure and services in Delhi.

8. Which zone of Indian Railways is responsible for managing the railway infrastructure and services in Chennai?
a) Southern Railway (SR)
b) South Eastern Railway (SER)
c) South Western Railway (SWR)
d) East Coast Railway (ECoR)

Explanation: Southern Railway, according to the provided information, is responsible for managing the railway infrastructure and services in Chennai.

Brief Summary | UPSC – IAS

As of January 2022, there are 18 railway zones in the Indian Railways, which is one of the largest railway networks in the world. Each zone is responsible for managing and operating the railway infrastructure and services within its defined geographical region. The 18 zones include Northern Railway, Eastern Railway, Southern Railway, Western Railway, Central Railway, and others. The Konkan Railway Corporation is a separate entity from the Indian Railways. For more information, visit the Indian Railways’ official website.

“New Rules for Valuation of Startup Shares: I-T Department’s Amendments and Implications”

I-T notifies 'Angel Tax' rules for valuing investments in startups

The Amended Rules for Valuation of Startup Investments: A Game Changer

Image for representation

Image for representation
| Photo Credit: Getty Images

The Income Tax department has recently introduced new rules for the valuation of equity and compulsorily convertible preference shares (CCPS) issued by startups to both resident and non-resident investors. These changes, which came into effect on September 25, are set to bring significant benefits to both startups and investors.

Significance of the Amended Rules

The amendments to Rule 11UA of the Income Tax (I-T) Act hold great significance as they offer taxpayers greater flexibility through multiple valuation methods. This simplifies the valuation process, incentivizes venture capital investments, and encourages foreign investment in Indian startups. The rules also provide clarity on the valuation of CCPS, which is an important aspect for investors.

Key Features of the Amended Rules

The amended rules retain the five new valuation methods proposed in the draft rules:

  1. Comparable Company Multiple Method
  2. Probability Weighted Expected Return Method
  3. Option Pricing Method
  4. Milestone Analysis Method
  5. Replacement Cost Method

These methods enable startups to determine the fair market value of their unquoted equity shares accurately. Additionally, the rules introduce a tolerance threshold for minor valuation discrepancies, enhancing efficiency and fairness in tax assessments.

Objectives and Effects of the Amended Rules

The primary objective of these rules is to bridge the gap between the regulations outlined in the Foreign Exchange Management Act (FEMA) and the Income Tax Act. So far, only investments by domestic investors or residents in closely-held companies or unlisted firms were subject to taxation above the fair market value, commonly known as “angel tax.”

The amendments aim to ensure that investments over and above the fair market value are taxed, regardless of whether the investor is a resident or non-resident. This helps tackle concerns related to the calculation of fair market value under different laws and promotes transparency in valuation practices.

Pros and Cons

The implementation of the amended rules brings several advantages for startups, investors, and the government. Some of the pros include:

  • Greater flexibility in valuation methods, attracting domestic and foreign investments
  • Simplified valuation process, reducing complexities for startups
  • Specific guidelines for CCPS valuation, providing clarity for investors
  • Tolerance threshold for minor valuation discrepancies, fostering fairness in tax assessments

However, it is essential to consider the potential cons of these rules. One challenge could be ensuring accurate and consistent valuation across different methods. Startups may also face increased scrutiny from tax authorities, requiring them to maintain thorough documentation and evidence for fair market value determination.

Fun Fact: The Rise of Startup Investments

In recent years, startup investments have witnessed remarkable growth globally. According to a report, global venture capital investment in startups reached a record high of $295 billion in 2021. This surge indicates the growing interest and confidence in the startup ecosystem, making the amended rules for valuation even more relevant and crucial.

In conclusion, the Income Tax department’s amendments to the rules for valuation of equity and CCPS investments provide much-needed flexibility, clarity, and simplicity to startups and investors. By encouraging venture capital investments and attracting foreign funding, these rules contribute to the growth and development of the startup ecosystem in India.

Mutiple Choice Questions

1. According to the changes in Rule 11UA of the Income Tax rules, what can be used as the basis for the valuation of compulsorily convertible preference shares (CCPS) issued by startups?
a) Comparable Company Multiple Method
b) Fair market value of unquoted equity shares
c) Replacement Cost Method
d) Option Pricing Method

Explanation: The changes in Rule 11UA allow the valuation of CCPS to be based on the fair market value of unquoted equity shares.

2. Which organization has notified the rules for the valuation of equity and compulsorily convertible preference shares issued by startups?
a) Income Tax department
b) Central Board of Direct Taxes (CBDT)
c) Nangia & Co LLP
d) AKM Global

Explanation: The Income Tax department has notified the rules for the valuation of equity and compulsorily convertible preference shares issued by startups.

3. What are the five new valuation methods proposed in the draft rules for consideration received from non-resident investors?
a) Comparable Company Multiple Method, Probability Weighted Expected Return Method, Option Pricing Method, Milestone Analysis Method, Replacement Cost Method
b) Fair market value, Replacement Cost Method, Option Pricing Method, Comparable Company Multiple Method, Milestone Analysis Method
c) Option Pricing Method, Replacement Cost Method, Probability Weighted Expected Return Method, Milestone Analysis Method, Comparable Company Multiple Method
d) Option Pricing Method, Comparable Company Multiple Method, Replacement Cost Method, Milestone Analysis Method, Probability Weighted Expected Return Method

Explanation: The five new valuation methods proposed in the draft rules for consideration received from non-resident investors are: Comparable Company Multiple Method, Probability Weighted Expected Return Method, Option Pricing Method, Milestone Analysis Method, and Replacement Cost Method.

4. What positive changes do the amendments to Rule 11UA of the Indian Income Tax Act bring?
a) Flexibility through multiple valuation methods
b) Incentivizing venture capital investments
c) Providing clarity on CCPS
d) All of the above

Explanation: The amendments to Rule 11UA bring positive changes by offering taxpayers flexibility through multiple valuation methods, simplifying the valuation date consideration, incentivizing venture capital investments, facilitating investments from notified entities, providing clarity on CCPS, and encouraging foreign investments.

5. What is the purpose of the changes in the angel tax rules?
a) To bridge the gap between the rules outlined in FEMA and the Income Tax
b) To tax investments over and above the fair market value
c) To encourage foreign exchange fluctuations
d) To encourage domestic investors to invest in startups

Explanation: The changes in the angel tax rules are aimed at bridging the gap between the rules outlined in FEMA and the Income Tax.

Brief Summary | UPSC – IAS

The Income Tax department in India has notified rules for the valuation of equity and convertible preference shares issued by startups to both resident and non-resident investors. The changes to the rules include allowing the valuation of convertible preference shares to be based on the fair market value of unquoted equity shares. The amended rules also retain five new valuation methods proposed in the draft rules for consideration received from non-residents. These changes aim to incentivize venture capital investments, facilitate investments from notified entities, and encourage foreign investments. The rules are also aimed at bridging the gap between the rules outlined in the Foreign Exchange Management Act and the Income Tax Act.

Revitalizing Sea Links: The Nagapattinam-Kankesanthurai Ferry Service

Sea service: The Hindu Editorial on the ferry service between Kankesanthurai and Nagapattinam

The Commencement of a Passenger Ferry Service between Kankesanthurai and Nagapattinam

The recent inauguration of a passenger ferry service between Kankesanthurai in Sri Lanka’s Northern Province and Nagapattinam in Tamil Nadu has fulfilled a long-standing demand for the revival of a sea link across the Palk Strait. The previous civil war in Sri Lanka disrupted traditional maritime routes, causing a halt in the movement of people and goods between Talaimannar and Rameswaram, as well as Colombo and Thoothukudi. Although attempts were made in the past to establish ferry services, they were faced with limited patronage and were ultimately discontinued. Moreover, the destruction caused by a cyclone in 1964 and the civil war further severed transportation links. This led to the reliance on air services for travel between the two nations. However, the recent development of a passenger ferry service aims to not only strengthen cultural and economic ties but also improve cooperation in disaster management and maritime security. It may also provide an opportunity for the voluntary repatriation of Sri Lankan refugees residing in Tamil Nadu.

Features and Objectives

The passenger ferry service between Kankesanthurai and Nagapattinam aims to provide a convenient and affordable mode of transportation for people traveling between Northern Province in Sri Lanka and Tamil Nadu in India. By connecting these two regions, the service allows for enhanced cultural exchange, economic cooperation, and improved disaster management efforts. Furthermore, it can facilitate the repatriation of Sri Lankan refugees, providing them with a safe and efficient mode of return to their home country.

Effects

The commencement of this ferry service has already shown positive effects within a short period. The resumption of the Chennai-Jaffna air service ten months ago resulted in an estimated 10,000 Indian tourists visiting Sri Lanka over the course of six months. Additionally, the inauguration of a private cruise service in Chennai facilitated visits by 6,000 passengers to Sri Lanka. These numbers highlight the potential for increased tourism and economic growth that the passenger ferry service can bring to both countries.

Pros and Cons

While the establishment of the ferry service is a significant step, there are certain considerations that need to be taken into account for its long-term sustainability. The fare of around ₹7,670 per person for a journey is not currently competitive enough when compared to air fares. Increasing the baggage allowance of 50 kg can be one way to make the ferry service more appealing. Additionally, attention should be given to improving amenities at Nagapattinam port, such as providing a dormitory, and enhancing rail connectivity to accommodate passengers who may wish to visit Chennai. On the part of Sri Lanka, promoting economic ties, including exports from the Northern Province, should be considered to address the inherent bilateral relationship asymmetry.

Fun Fact

Did you know that the popular Boat Mail connected Chennai and Talaimannar via Rameswaram and Dhanushkodi through a combined rail and ferry link? This route was cherished by many nonagenarians, but unfortunately, the cyclone in December 1964 and the civil war halted this historic transportation connection.

In conclusion, the commencement of the passenger ferry service between Kankesanthurai and Nagapattinam marks a significant development in restoring the sea link across the Palk Strait. With its potential to strengthen cultural and economic ties, improve disaster management and maritime security, and facilitate voluntary repatriation, this service holds great promise. Nevertheless, sustained policy attention and collaborative efforts from both governments are essential to ensuring the long-term success and viability of this ferry service.

Brief Summary | UPSC – IAS

The recent commencement of a passenger ferry service between Kankesanthurai in Sri Lanka and Nagapattinam in Tamil Nadu fulfills a long-standing demand for the revival of a sea link across the Palk Strait. Previous ferry services were disrupted by Sri Lanka’s civil war and lack of patronage. The new ferry service aims to strengthen cultural, economic, and civilisational ties between the two regions. However, to ensure the sustainability of the service, steps such as improving rail connectivity and amenities at Nagapattinam port, increasing baggage allowance, and promoting economic ties need to be taken. Both governments must provide sustained policy attention for the success of the service.

“The Evolution of Silk Moth Domestication: From Wild to World’s Second Largest Producer”

Where do the wild colours of domesticated silkworm cocoons come from?

Exploring the Fascinating World of Silk: Features, Significance, and Moth Domestication

Silk, known as the queen of fibers, is a magnificent material that has captured human fascination for thousands of years. It is obtained from the cocoons of the silk moth (Bombyx mori), which has been domesticated by humans for over 5,000 years in China. Today, domesticated silk moths are reared worldwide, including India, making it the second-largest producer of raw silk after China. Let’s delve deeper into the significance, features, and interesting aspects of silk and the process of moth domestication.

The Significance of Silk

Silk has always held a special place in human history and culture. Its production has a significant economic impact, contributing to the livelihoods of countless people in the silk industry. The exquisite fabric woven from silk fibers is highly valued for its luxurious feel, lustrous appearance, and durability. Silk is widely used in the production of clothing, textiles, home furnishings, and even medical sutures and parachutes. The versatility and elegance of silk make it a sought-after fabric worldwide.

The Features of Silk and Moth Domestication

The silk moth, or Bombyx mori, plays a crucial role in silk production. Here are some intriguing features about silk and the process of moth domestication:

  • Silk production occurs through the reeling or drawing of silk fibers from the cocoons of the silk moth.
  • The domesticated silk moth is larger than its wild progenitor, enabling it to produce longer silk fibers.
  • Domesticated silk moths have lost the ability to fly and have undergone pigmentation changes due to the absence of the need for camouflage.
  • Wild silks, such as muga, tasar, and eri silks, come from other moth species that survive relatively independently and feed on a wider variety of trees.
  • Non-mulberry silks account for about 30% of silk production in India and have different characteristics such as shorter, coarser, and harder threads compared to mulberry silk.
  • The cocoons of domesticated silk moths come in various colors, such as yellow-red, gold, flesh, pink, pale green, deep green, or white. However, these pigments gradually fade, and the colored silks available in the market are produced using acid dyes.

Objectives and Effects of Silk Moth Domestication

The domestication of silk moths has been a fascinating process that has had both intended and unintended consequences. Here are some objectives and effects of moth domestication:

  • Objective: Moth domestication aimed to breed and cultivate silk moths for silk production, which became a significant economic activity.
  • Effect: The domestication process led to larger silk moths capable of producing longer silk fibers, catering to the demand for high-quality silk.
  • Objective: Selective breeding of silk moths with differently colored cocoons in the hope of obtaining naturally colored silks.
  • Effect: Disappointment in achieving naturally colored silks as the pigments in cocoons are water-soluble and fade away. Colored silks available in the market are dyed using acid dyes.

Pros and Cons of Silk Moth Domestication

Like any human intervention in nature, silk moth domestication has its own set of pros and cons:

Pros:

  • The domestication of silk moths has enabled the mass production of silk, contributing to economic growth and employment opportunities.
  • Domesticated silk moths produce longer silk fibers, enhancing the quality and versatility of silk fabric.
  • The variety of colors in domesticated silk moth cocoons adds an aesthetic appeal to silk products.

Cons:

  • The domesticated silk moth has lost its ability to fly and relies entirely on human care for survival and reproduction.
  • Unhatched cocoons of silk moths are used for reeling high-quality silk, raising ethical concerns.
  • Attempts to breed naturally colored silks through domestication have been unsuccessful due to the water-soluble nature of cocoon pigments.

Fun Fact: Uncovering the Genetics of Silk Moths

Scientists have been dedicated to unraveling the genetic mysteries behind silk moth domestication. Recent research from Southwest University in China provided insights into how combinations of gene mutations result in different colored cocoons. They identified specific genes responsible for the synthesis and transport of pigments, explaining the spectrum of colors in silk moth cocoons.

Furthermore, studies conducted by researchers from the University of Tokyo and Columbia University examined the genetic differences between domesticated and ancestral silk moths. By mutating a gene called apontic-like, they concluded that the domesticated moth lost its ability to produce melanin, a pigment responsible for the dark coloration.

These breakthroughs pave the way for further genetic analysis and understanding of the intricate process of silk moth domestication.

Silk, with its rich history and remarkable attributes, continues to be a beloved fabric cherished by people worldwide. Exploring the genetic intricacies behind silk moth domestication deepens our understanding of the remarkable journey silk has taken throughout human history.

However, it is crucial to address the ethical considerations and environmental impact associated with silk production to ensure sustainable practices in the industry.

Fun Fact: Silk production has contributed significantly to cultural and economic exchange between East and West, playing a vital role in the ancient Silk Road trade route. It facilitated the exchange of ideas, technologies, and goods across vast regions of the world.

Mutiple Choice Questions

1. What is the process of obtaining silk from silkworms?

A. Silkworms forage on a variety of trees and produce silk
B. Silkworms absorb pigments from mulberry leaves to produce silk
C. Silkworms spin silk fibers to build their cocoons
D. Silkworms transport silk proteins from their midgut to the silk glands

Explanation: Silkworms spin silk fibers to build their cocoons, which are then used to obtain silk.

2. Which country is the world’s second largest producer of raw silk after China?

A. Japan
B. Russia
C. India
D. Korea

Explanation: India is the world’s second largest producer of raw silk after China.

3. What is the main difference between the domesticated silk moth and its wild progenitor?

A. The domesticated silk moth has lost the ability to fly
B. The domesticated silk moth has a larger cocoon
C. The domesticated silk moth feeds on a wider variety of leaves
D. The domesticated silk moth has a different pigmentation

Explanation: The domesticated silk moth has lost the ability to fly, as well as its caterpillar and adult-stage pigmentation.

4. What percentage of silk produced in India comes from non-mulberry silks?

A. 30%
B. 50%
C. 70%
D. 90%

Explanation: Non-mulberry silks comprise about 30% of all silk produced in India.

5. How do silkworms obtain the pigments that color their cocoons?

A. They absorb pigments from the air
B. They synthesize pigments in their silk glands
C. They transport pigments from their midgut to the silk glands
D. They obtain pigments from the mulberry leaves they feed on

Explanation: Silkworms feed on mulberry leaves and absorb chemical compounds called carotenoids and flavonoids, which are responsible for the pigmentation of their cocoons.

6. How do researchers explain the different colors of silk cocoons?

A. The colors are determined by a combination of mutations in specific genes
B. The colors are determined by the type of mulberry tree the silkworm feeds on
C. The colors are artificially produced using acid dyes
D. The colors are determined by the silk moth’s ability to fly

Explanation: Researchers have found that different combinations of mutations in specific genes, such as the Y gene, result in the different colors of silk cocoons.

7. What is the name of the gene that was specifically mutated in hybrid silk moths?

A. Melanin-like
B. Apontic
C. B. mori
D. B. mandarina

Explanation: The gene that was specifically mutated in hybrid silk moths is called apontic-like.

8. What is the implication of the apontic-like gene mutation in hybrid silk moths?

A. The hybrid silk moth failed to make melanin
B. The hybrid silk moth produced a different pigment
C. The hybrid silk moth lost the ability to spin silk fibers
D. The hybrid silk moth became unable to cocoon itself

Explanation: The mutation in the apontic-like gene resulted in the hybrid silk moth’s failure to produce melanin.

9. What is the significance of silk moth domestication?

A. It allows for the production of different colors of silk cocoons
B. It provides a valuable resource for studying genetic diversity
C. It has paved the way for analyzing domestication in other organisms
D. It allows for the mass production of silk fibers

Explanation: Silk moth domestication has been a significant process that has led to the production of fibers for various purposes and has also provided valuable insights into the molecular basis of diversity.

10. What are the potential future implications of gene analysis in silk moth domestication?

A. It may lead to the discovery of new silk-producing species
B. It may provide insights into the domestication of other organisms
C. It may allow for the creation of genetically modified silk moths
D. It may result in the production of silk with enhanced properties

Explanation: Gene analysis in silk moth domestication may provide insights into the domestication process of other organisms and pave the way for further genetic studies in other fields.

Brief Summary | UPSC – IAS

Silk, a fiber made from cocoons of the silk moth, was domesticated over 5,000 years ago in China. The domesticated moth has lost the ability to fly and its pigmentation in both the caterpillar and adult stages. “Wild” silks, such as muga, tasar, and eri silks, are obtained from other moth species and require less human care. Non-mulberry silks make up 30% of all silk production in India and have different characteristics compared to mulberry silks. The cocoons of domesticated silk moths come in a variety of colors due to mutations in genes responsible for pigmentation. Research in China has identified specific genes associated with the production of different colors. Hybrid silk moths have been created to study the genes responsible for pigmentation production.

Cloud Seeding Experiment in Solapur Achieves 18% Rainfall Enhancement

IITM Pune demonstrates cloud seeding can produce rainfall

Cloud Seeding Experiment Enhances Rainfall in Solapur: A Breakthrough in Water Availability

A recent cloud seeding experiment conducted in Solapur city has shown promising results in enhancing rainfall in a region that typically receives low precipitation. The experiment, known as Cloud Aerosol Interaction and Precipitation Enhancement Experiment (CAIPEEX phase-4), aimed to investigate the efficacy of hygroscopic seeding in deep convective clouds and develop a cloud seeding protocol.

Significance of the Experiment

Solapur city, located on the leeward side of the Western Ghats, receives minimal rainfall during the monsoon season. The cloud seeding experiment, carried out during the summer monsoon period of 2018 and 2019, resulted in an 18% relative enhancement in rainfall. This breakthrough discovery could potentially address water scarcity issues in drought-prone areas.

Key Features of the Experiment

The experiment involved studying various cloud parameters and seeding the clouds using two aircraft. A total of 276 convective clouds were chosen, out of which 150 were seeded and 122 were not. Only convective clouds with a depth of over one kilometer and the potential to evolve into deep cumulus clouds were targeted for seeding. Calcium chloride flare was used as the seeding agent, released at the base of warm convective clouds during their growing stage.

Objectives of the Experiment

The primary objective of the experiment was to investigate the effectiveness of cloud seeding in producing rainfall. The researchers aimed to analyze the microphysics and characteristics of convective clouds to identify the ones suitable for seeding. Additionally, they aimed to develop a high-resolution numerical model to guide stakeholders in planning and conducting cloud seeding projects in India.

Effects and Results

The cloud seeding experiment achieved an 18% increase in rainfall, equivalent to approximately 8.67mm more rainfall. The relative enhancement of accumulated rainfall was observed over two hours after seeding the clouds, resulting in a total enhancement of water availability by 867 million liters. The study demonstrated that cloud seeding can be an effective strategy for enhancing rainfall in suitable conditions.

Pros and Cons

While cloud seeding shows potential in addressing water scarcity and boosting agricultural productivity, it is important to consider potential drawbacks. One of the key findings of the study was that not all cumulus clouds produce rainfall when seeded. Additionally, the actual increase in rainfall over a 100 sq.km area was only 18% despite an initial relative enhancement of 46%. The cost of cloud seeding was estimated at 18 paisa per liter during this research experiment. However, the cost could be significantly reduced by utilizing indigenous seeding aircraft.

Fun Fact

The experiment’s findings revealed that around 20-25% of cumulus clouds can produce rainfall when cloud seeding is carried out correctly. This highlights the varying nature of cloud microphysics and the need for careful selection of clouds for effective seeding.

Overall, the cloud seeding experiment in Solapur city has showcased the potential of this technique in enhancing rainfall and addressing water scarcity. While further research is needed to refine the methodology and optimize cost-effectiveness, this breakthrough discovery opens up new possibilities for managing drought conditions and ensuring a more sustainable water supply.

Mutiple Choice Questions

1. What is the primary objective of the Cloud Aerosol Interaction and Precipitation Enhancement Experiment (CAIPEEX phase-4)?
a) To investigate the effectiveness of cloud seeding in producing rainfall
b) To study the microphysics and characteristics of convective clouds
c) To develop a high-resolution numerical model for cloud seeding
d) To understand the availability of additional water through cloud seeding

Explanation: The primary objective of the CAIPEEX phase-4 experiment was to investigate the efficacy of hygroscopic seeding in deep convective clouds and to develop a cloud seeding protocol. (Option b is incorrect as it is mentioned that the study was carried out to first study and understand the microphysics and characteristics of convective clouds, not the primary objective)

2. How much relative enhancement in rainfall was achieved through the cloud seeding experiment in Solapur city?
a) 8.67mm
b) 18%
c) 867 million litres
d) 46%

Explanation: The cloud seeding experiment in Solapur city achieved a relative enhancement in rainfall of approximately 18%, which is equivalent to approximately 8.67mm of additional rainfall. (Options a, c, and d are incorrect as they do not represent the correct amount of relative enhancement in rainfall achieved)

3. What is the approximate cost of producing water through cloud seeding according to the study?
a) 18 paisa per litre
b) 50 paisa per litre
c) 18% of total cost
d) 50% of total cost

Explanation: The study estimated that the approximate cost of producing water through cloud seeding was 18 paisa per litre. (Option b is incorrect as it does not represent the correct cost mentioned in the study)

4. What percentage of cumulus clouds produce rainfall when cloud seeding is done correctly?
a) 18%
b) 20-25%
c) 46%
d) 50%

Explanation: The study found that 20-25% of cumulus clouds produce rainfall if cloud seeding is done correctly. (Options a, c, and d are incorrect as they do not represent the correct percentage mentioned in the study)

5. How many convective clouds were chosen for the randomised seeding experiment?
a) 384
b) 422
c) 150
d) 122

Explanation: A total of 276 convective clouds were chosen for the randomised seeding experiment, out of which 150 were seeded and 122 were not seeded. (Options a and b are incorrect as they represent the total rainfall in Solapur city, not the number of convective clouds chosen for the experiment)

Brief Summary UPSC – IAS

A cloud seeding experiment conducted in Solapur, India, achieved an 18% increase in rainfall, equivalent to an extra 8.67mm, according to a recent study published in the Bulletin of the American Meteorological Society. The study used hygroscopic seeding in deep convective clouds and found that cloud seeding can be effective in enhancing rainfall when certain conditions are met. A total of 276 convective clouds were studied, with 150 seeded and 122 unseeded. The experiment resulted in a total enhancement of 867 million litres of water availability. Cloud seeding was found to be a partial solution for addressing water requirements and managing drought conditions.

“EU’s Ill-Conceived Carbon Tax Threatens Manufacturing Sector: Piyush Goyal”

CBAM will kill EU manufacturing, India will have its own carbon taxes: Goyal

The European Union’s Proposed Carbon Tax and its Impact on India’s Manufacturing Sector

India’s Commerce and Industry Minister, Piyush Goyal, has criticized the European Union’s proposed Carbon Tax on imports, claiming that it would be detrimental to the EU’s manufacturing sector. He states that even if the plan is implemented, India would counteract it by imposing its own carbon tax.

Features of the European Union’s Carbon Tax Plan

  • The Carbon Border Adjustment Mechanism (CBAM) has introduced reporting requirements for exporters of items such as steel.
  • The tax aims to create a level playing field for carbon pricing in both the EU and countries exporting to the EU.

Objectives of the Proposed Carbon Tax

  • Ensure that carbon-intensive products imported into the EU are subject to the same carbon pricing policies as those produced within the EU.
  • Encourage countries to adopt cleaner and more sustainable energy practices.
  • Promote the reduction of carbon emissions globally.

Effects of the Carbon Tax on India

The Indian Commerce and Industry Minister argues that the tax is unfair as the carbon pricing in India differs from that in Europe. He suggests that European producers may choose to relocate their production to India to avoid the tax, providing an opportunity for India’s manufacturing sector to grow. However, this could potentially lead to negative consequences for the European auto sector, which heavily relies on steel and aluminum.

Pros and Cons of the Carbon Tax

Pros:

  • Creates a level playing field for carbon pricing globally.
  • Encourages the adoption of cleaner energy sources.
  • Reduces carbon emissions and promotes sustainability.

Cons:

  • Possible negative impact on industries heavily reliant on carbon-intensive materials.
  • May cause tensions between exporting countries and the EU.
  • Could lead to potential trade disputes and retaliation from affected nations.

Fun Fact: The European Union is the world’s largest single market, making its carbon tax proposal significant in terms of global efforts to combat climate change and promote sustainable practices.

Note: The HTML heading tags (h1, h2, h3) have been used to structure the article and provide semantic meaning to each section.

Mutiple Choice Questions

1. What is the European Union’s proposed Carbon Tax on imports?
a) A tax on carbon emissions for imported goods
b) A tax on all imports from non-EU countries
c) A tax on all exports to non-EU countries
d) A tax on carbon emissions within the EU

Answer: a) A tax on carbon emissions for imported goods

Explanation: The European Union’s proposed Carbon Tax on imports is a tax specifically targeting carbon emissions associated with imported goods.

2. When is the EU’s Carbon Border Adjustment Mechanism (CBAM) set to kick in?
a) 2022
b) 2024
c) 2026
d) 2028

Answer: c) 2026

Explanation: The EU’s Carbon Border Adjustment Mechanism (CBAM) is set to kick in from 2026, according to the information provided.

3. Why does Commerce and Industry Minister Piyush Goyal believe the EU’s Carbon Tax would be detrimental to its manufacturing sector?
a) The tax would increase the cost of production in Europe
b) The tax would discourage foreign investment in European manufacturing
c) The tax would make European exports less competitive
d) The tax would lead to job losses in the manufacturing sector

Answer: a) The tax would increase the cost of production in Europe

Explanation: Commerce and Industry Minister Piyush Goyal believes that the EU’s Carbon Tax would cause the death of manufacturing in Europe because it would increase the cost of production, making it less competitive.

4. According to Piyush Goyal, what sector of the European economy may be the first casualty of the Carbon Tax?
a) Agriculture
b) Manufacturing
c) Tourism
d) Financial services

Answer: b) Manufacturing

Explanation: Piyush Goyal suggests that the auto sector of Europe, where steel and aluminum are used, may be the first casualty of the Carbon Tax.

5. How does Piyush Goyal believe the Carbon Tax would benefit India?
a) It would attract European producers to move production to India
b) It would decrease the cost of inputs for Indian manufacturers
c) It would reduce carbon emissions in India
d) It would increase India’s exports to the EU

Answer: a) It would attract European producers to move production to India

Explanation: According to Piyush Goyal, the Carbon Tax would provide India with a competitive edge as European producers may move their production to India due to the tax.

6. What does Piyush Goyal suggest as a countermeasure to the EU’s Carbon Tax?
a) Levying India’s own carbon tax
b) Imposing trade sanctions on European imports
c) Negotiating a lower tax rate with the EU
d) Implementing stricter carbon emission regulations in India

Answer: a) Levying India’s own carbon tax

Explanation: Piyush Goyal suggests that India would neutralize the EU’s Carbon Tax by levying its own carbon tax.

7. How does Piyush Goyal propose India could avoid additional CBAM tax at the European border?
a) By negotiating a lower tax rate with the EU
b) By increasing the competitiveness of Indian exports
c) By utilizing the tax collected for India’s green energy transition
d) By imposing retaliatory trade measures against the EU

Answer: c) By utilizing the tax collected for India’s green energy transition

Explanation: Piyush Goyal suggests that if India collects the tax internally and uses it for its own green energy transition, there would be no additional CBAM tax at the European border.

8. What is the government’s current status in the negotiation with the EU regarding the Carbon Tax?
a) The negotiation is ongoing and no agreement has been reached yet
b) The negotiation has been successful and the Carbon Tax has been dropped
c) The negotiation has failed and the government is planning retaliatory measures
d) The negotiation has been postponed indefinitely

Answer: a) The negotiation is ongoing and no agreement has been reached yet

Explanation: The government is still in dialogue with its EU counterparts on the levy, indicating that the negotiation is ongoing and no agreement has been reached yet.

Brief Summary

Indian Commerce and Industry Minister, Piyush Goyal, has criticized the European Union’s proposed Carbon Border Adjustment Mechanism (CBAM) as an “ill-conceived” move that would harm the EU’s manufacturing sector. Goyal argued that carbon cannot be priced the same in India and Europe, and therefore the CBAM is unfair. He suggested that India would neutralize the impact of the CBAM by imposing its own carbon tax. Goyal believes that European producers would likely move their production to India as a result of the tax, and that the EU would eventually realize the need to drop the CBAM.

Silver Revolution in India – features, benefits and Implications | UPSC – IAS

The Silver Revolution in India its features, benefits and Implications | UPSC - IAS

The Silver Revolution in India its features, benefits and Implications | UPSC - IAS

The Silver Revolution is a term used to describe the rapid growth of the poultry farming industry in India. It began in the early 1990s and continued until the late 2000s. It is characterized by the adoption of modern poultry farming practices, such as intensive farming, broilers, and layers, which have led to a significant increase in the production of chicken and eggs.

The father of the Silver Revolution in India is Dr. B.V. Rao. He was a poultry scientist and entrepreneur who is credited with pioneering the development of the modern poultry industry in India. He established the Venkateswara Hatcheries Private Limited (Venky’s) in 1969, which became one of the largest poultry companies in India. Dr. Rao also played a key role in developing and promoting modern poultry farming practices, such as improved breeds, feed, and housing.

The Silver Revolution has had a major impact on the Indian economy and society. It has created millions of jobs, boosted rural incomes, and improved the nutritional status of the population. However, it has also raised concerns about environmental degradation, animal welfare, and public health.

Features of Silver Revolution | UPSC – IAS

The following are some of the key features of the Silver Revolution in India:

  • Shift to commercial poultry farming: The Silver Revolution has seen a shift from traditional backyard poultry farming to commercial poultry farming. Commercial poultry farming involves raising large numbers of chickens in a confined space, using modern farming practices and technologies.
  • Increased use of breeds and hybrids: Commercial poultry farmers in India use a variety of breeds and hybrids of chickens, which are selected for their high productivity and meat or egg quality.
  • Improved feed and nutrition: Commercial poultry farmers use scientifically formulated feed and nutrition programs to ensure that their chickens are getting the nutrients they need to grow and produce optimally.
  • Better disease management: Commercial poultry farmers use a variety of disease prevention and control measures to keep their chickens healthy. This includes vaccination, biosecurity practices, and regular veterinary checkups.

Benefits of Silver Revolution | UPSC – IAS

The Silver Revolution has had a number of benefits for India, including:

  • Increased food production: The Silver Revolution has helped to increase India’s food production, which is essential to meet the needs of its growing population. India is now the world’s second largest producer of chicken and eggs, after China.
  • Improved nutritional status of the population: Chicken and eggs are important sources of protein, which is essential for a healthy diet. The Silver Revolution has helped to improve the nutritional status of the Indian population, especially among children and women. According to the National Family Health Survey-5 (2019-21), the prevalence of stunting in children under the age of five has decreased from 46.6% in 2015-16 to 35.5% in 2019-21.
  • Creation of jobs and boost to rural incomes: The poultry farming industry has created millions of jobs in India, both directly and indirectly. It has also boosted rural incomes, as many poultry farmers are small-scale farmers.
  • Reduced poverty: The Silver Revolution has helped to reduce poverty in India, especially in rural areas. This is because poultry farming is a relatively low-cost and low-risk enterprise.
  • Improved livelihood opportunities for women: The poultry farming industry has provided women with new livelihood opportunities. Women are involved in all aspects of the poultry farming industry, from breeding and raising chickens to processing and marketing poultry products.

Implications of Silver Revolution | UPSC – IAS

The Silver Revolution has also had a number of implications for India, including:

  • Need for sustainable poultry farming practices: It is important to develop sustainable poultry farming practices that reduce the environmental impact of the industry. This includes practices that reduce water pollution, soil contamination, and greenhouse gas emissions.
  • Need for better regulation of the industry: The government needs to implement better regulations to ensure the welfare of chickens in intensive poultry farms and to protect public health. This includes regulations on the use of antibiotics and other growth promoters, as well as regulations on the disposal of poultry waste.
  • Need for investment in research and development: The government needs to invest in research and development to develop new poultry farming technologies that are more sustainable and animal-friendly. This could include research on new breeds and hybrids of chickens that are more resistant to diseases and that can thrive in a variety of climatic conditions.

Economic effects of Silver Revolution | UPSC – IAS

  • The poultry farming industry is a major contributor to the Indian economy. It accounts for about 2% of India’s GDP and employs millions of people. The industry has also helped to boost rural incomes, as many poultry farmers are small-scale farmers.

Social effects of Silver Revolution | UPSC – IAS

  • The Silver Revolution has had a number of positive social effects. It has increased the availability of affordable and nutritious food, which has helped to improve the nutritional status of the population. Increased access to chicken and eggs has also helped to reduce the risk of stunting and other malnutrition-related problems among children.
  • The Silver Revolution has also created millions of jobs, which has helped to reduce poverty and improve living standards in rural areas. Additionally, the industry has helped to empower women, as many women are involved in poultry farming.

Environmental effects of Silver Revolution | UPSC – IAS

  • The poultry farming industry can have a negative impact on the environment if it is not managed sustainably. Poultry farms produce large amounts of waste, which can pollute water and soil if it is not properly disposed of. Additionally, poultry farming can contribute to greenhouse gas emissions.

Animal welfare

  • Some people have raised concerns about the welfare of chickens in intensive poultry farms. Intensive poultry farming can lead to overcrowding, poor sanitation, and disease. It is important to ensure that poultry farms are operated in a humane manner and that chickens are treated with respect.

Public health

  • There have been a number of cases of food poisoning and other illnesses associated with the consumption of poultry products. This is because poultry products can be contaminated with harmful bacteria, such as Salmonella. It is important to ensure that poultry products are handled and cooked properly to reduce the risk of food poisoning.

Solutions of Silver Revolution | UPSC – IAS

The following are some solutions to the challenges associated with the Silver Revolution:

  • Develop sustainable poultry farming practices: It is important to develop sustainable poultry farming practices that reduce the environmental impact of the industry. This includes practices that reduce water pollution, soil contamination, and greenhouse gas emissions.
  • Implement better regulation of the industry: The government needs to implement better regulations to ensure the welfare of chickens in intensive poultry farms and to protect public health.
  • Invest in research and development: The government needs to invest in research and development to develop new poultry farming technologies that are more sustainable and animal-friendly.

Conclusion

The Silver Revolution has had a significant impact on India, both economically and socially. It has created millions of jobs, boosted rural incomes, and improved the nutritional status of the population. However, it is important to address the challenges associated with the Silver Revolution, such as environmental degradation, animal welfare, and public health risks. By doing so, India can ensure that the Silver Revolution continues to benefit the country for many years to come.

Fun fact: The Silver Revolution has led to a significant increase in the consumption of chicken and eggs in India. In 1990, the average Indian consumed just 0.5 kg of chicken and 15 eggs per year. Today, the average Indian consumes over 5 kg of chicken and 100 eggs per year.

The Second Green Revolution in India | UPSC – IAS

Green Revolution its Socio economic and Ecological Implications UPSC - IAS UPPSC UP PCS

Green Revolution its Socio economic and Ecological Implications UPSC - IAS UPPSC UP PCS

The Second Green Revolution is a term used to describe a new wave of agricultural growth in India that began in the early 1990s. It is characterized by the adoption of new agricultural technologies, such as genetically modified seeds (GMOs), precision agriculture, and drip irrigation. The Second Green Revolution is aimed at addressing the challenges of climate change, water scarcity, and soil degradation, while also increasing agricultural productivity and incomes.

Features of the Second Green Revolution in India | UPSC – IAS

The following are the main features of the Second Green Revolution in India:

  • Adoption of new agricultural technologies: The Second Green Revolution is characterized by the adoption of new agricultural technologies, such as GMOs, precision agriculture, and drip irrigation. These technologies can help to increase agricultural productivity while reducing the environmental impact of agriculture.
  • Focus on sustainable agriculture: The Second Green Revolution is focused on promoting sustainable agricultural practices. This includes practices that help to conserve water, improve soil health, and reduce the use of chemical fertilizers and pesticides.
  • Emphasis on research and development: The Second Green Revolution is supported by a strong emphasis on research and development. This is aimed at developing new agricultural technologies and practices that can help to meet the challenges of climate change, water scarcity, and soil degradation.

Complications 

The Second Green Revolution is not without its challenges. Some of the concerns associated with the Second Green Revolution include:

  • Increased dependence on corporate agriculture: The adoption of new agricultural technologies, such as GMOs, can lead to increased dependence on corporate agriculture. This is because small farmers may not be able to afford the costs of these technologies.
  • Environmental risks: Some of the new agricultural technologies, such as GMOs, pose potential environmental risks. For example, GMOs could cross-pollinate with wild plants, leading to the creation of new superweeds.
  • Social inequality: The Second Green Revolution could lead to increased social inequality between farmers who are able to adopt new technologies and those who are not.

Benefits | UPSC – IAS

The Second Green Revolution has the potential to provide a number of benefits to India, including:

  • Increased agricultural productivity: The Second Green Revolution could help to increase India’s agricultural productivity by several times. This is essential to meet the food needs of India’s growing population.
  • Reduced environmental impact: The Second Green Revolution could help to reduce the environmental impact of agriculture by promoting sustainable agricultural practices. This is important for addressing the challenges of climate change, water scarcity, and soil degradation.
  • Improved farmer incomes: The Second Green Revolution could help to improve the incomes of farmers by increasing agricultural productivity and reducing costs. This could lead to a reduction in rural poverty.

Implications

The Second Green Revolution has a number of implications for India, including:

  • Increased need for investment: The Second Green Revolution will require significant investment in research and development, as well as in the adoption of new agricultural technologies.
  • Need for capacity building: Farmers will need to be trained in the use of new agricultural technologies. This will require investment in capacity building programs.
  • Need for policy reforms: The government will need to implement policy reforms that support the adoption of new agricultural technologies and sustainable agricultural practices.

Effects in India | UPSC – IAS

The Second Green Revolution is still in its early stages, but it has already had a number of positive effects in India. For example, the adoption of new agricultural technologies has helped to increase agricultural productivity in some regions. Additionally, the focus on sustainable agriculture has led to a reduction in the use of chemical fertilizers and pesticides in some areas.

Effects for the people

The Second Green Revolution has the potential to have a positive impact on the people of India by increasing agricultural productivity and reducing poverty. Additionally, the focus on sustainable agriculture could lead to improved health and environmental outcomes for the people of India.

Effects for children

The Second Green Revolution could have a positive impact on children in India by improving access to food and nutrition. Additionally, the focus on sustainable agriculture could lead to a healthier environment for children.

Effects for the underprivileged

The Second Green Revolution could have a positive impact on the underprivileged in India by increasing agricultural productivity and incomes. Additionally, the focus on sustainable agriculture could lead to improved health and environmental outcomes for the underprivileged.

Effects for women

The SGR could have a positive impact on women in India by increasing their employment opportunities and incomes. Additionally, the focus on sustainable agriculture could lead to improved health and environmental outcomes for women.

Solutions

The following are some solutions to the challenges associated with the Second Green Revolution:

  • Promote public-private partnerships: Public-private partnerships can help to accelerate the development and adoption of new agricultural technologies.
  • Invest in research and development: The government needs to invest in research and development to develop new agricultural technologies that are affordable and accessible to small farmers.
  • Implement policy reforms: The government needs to implement policy reforms that support the adoption of new agricultural technologies and sustainable agricultural practices.

Rape in India: How to Deal, Solutions, and Prevention | UPSC – IAS

Salient features of Indian Society, Diversity of India General studies 1 vision ias gk today UPSC - IAS NCERT

Salient features of Indian Society, Diversity of India General studies 1 vision ias gk today UPSC - IAS NCERT

Rape is a heinous crime that can have devastating consequences for the victim, their family, and their community. In India, rape is a widespread problem, with an estimated 40,000 cases reported each year. However, the actual number of rapes is believed to be much higher, as many cases go unreported.

There are a number of factors that contribute to the high rate of rape in India. These factors include:

  • Patriarchal culture: India has a deeply patriarchal culture, which values men over women. This culture creates an environment where rape is seen as a way for men to assert their dominance over women.
  • Sexual taboos: There are strong sexual taboos in India, which can make it difficult for victims to come forward and report rape. Victims may fear being blamed or stigmatized for the crime.
  • Lack of law enforcement: The law enforcement system in India is weak and inefficient. This makes it difficult for victims to get justice, and it emboldens perpetrators.

Effects of rape | UPSC – IAS

Rape can have a devastating impact on the victim, both physically and emotionally. Victims of rape may experience a range of problems, including:

  • Physical injuries: Rape can cause serious physical injuries, such as bruises, cuts, and internal bleeding. In some cases, rape can also lead to sexually transmitted infections (STIs) or pregnancy.
  • Emotional trauma: Rape can cause severe emotional trauma, such as post-traumatic stress disorder (PTSD), depression, and anxiety. Victims of rape may also experience feelings of shame, guilt, and isolation.
  • Social stigma: Victims of rape may face social stigma and discrimination from their families, communities, and even from law enforcement officials. This stigma can make it difficult for victims to recover from the trauma of rape and to rebuild their lives.

How to deal with rape | UPSC – IAS

If you have been raped, it is important to seek help as soon as possible. There are a number of resources available to help you, including:

  • Medical care: If you have been physically injured, it is important to seek medical attention. You may also need to be tested for STIs and pregnancy.
  • Emotional support: There are a number of organizations that can provide emotional support to victims of rape. These organizations can offer counseling, support groups, and other resources to help you cope with the trauma of rape.
  • Legal assistance: If you want to pursue legal action against your attacker, you can get assistance from a lawyer or from a victim advocacy organization.

Solutions and prevention | UPSC – IAS

There are a number of things that can be done to address the problem of rape in India. These include:

  • Educating people about rape: It is important to educate people about rape, including what it is, what the signs and symptoms are, and how to prevent it. This education should start at a young age and should be provided to both boys and girls.
  • Changing attitudes towards women: It is important to change attitudes towards women in India. This means challenging the patriarchal culture and promoting gender equality.
  • Strengthening law enforcement: The law enforcement system in India needs to be strengthened so that victims of rape can get justice. This includes training police officers to investigate and prosecute rape cases effectively, and it also includes ensuring that victims have access to legal support.

Fun fact: Did you know that India has the fourth-highest number of women in parliament in the world? This is a sign that India is making progress towards gender equality.

Conclusion | UPSC – IAS

Rape is a serious problem in India, but there are a number of things that can be done to address it. By educating people about rape, changing attitudes towards women, and strengthening law enforcement, we can create a safer and more just society for all.

Additional information | UPSC – IAS

Here are some additional tips on how to prevent rape:

  • Be aware of your surroundings and avoid walking alone at night.
  • Trust your instincts and if you feel uncomfortable in a situation, leave.
  • Don’t go to places with people you don’t know or trust.
  • Set boundaries and let people know what you are and are not comfortable with.
  • If you are drinking, do so responsibly and don’t leave your drink unattended.
  • If you are under the age of consent, do not engage in sexual activity.

If you are a parent or guardian, you can help to prevent rape by talking to your children about sex and consent. You should also teach your children how to stay safe and how to report abuse.

It is important to remember that rape is never the victim’s fault. If you or someone you know has been raped, please seek help. There are people who care and want to help you.

Global Warming and Greenhouse Effects in 2023: What You Need to Know | UPSC – IAS

Global warming effects Acid rain, Greenhouse, Ozone Depletion, Deforestation UPSC IAS

What is the greenhouse effect?

The greenhouse effect is a natural process that warms the Earth’s surface. When the Sun’s energy reaches the Earth’s atmosphere, some of it is reflected back to space and the rest is absorbed and re-emitted by greenhouse gases. Greenhouse gases include water vapor, carbon dioxide, methane, nitrous oxide, and ozone.

The greenhouse effect is essential for life on Earth. Without it, the Earth’s average temperature would be about -18°C (0°F), which is too cold for most life to survive. However, human activities are increasing the levels of greenhouse gases in the atmosphere, which is causing the Earth to warm at an unprecedented rate. This is known as global warming.

What are the effects of global warming?

Global warming is having a number of negative impacts on the Earth’s climate system. These impacts include:

  • Rising sea levels
  • Melting glaciers and ice sheets
  • More extreme weather events, such as heatwaves, droughts, floods, and storms
  • Changes in agricultural yields
  • Loss of biodiversity

What are the effects of global warming in India?

India is one of the most vulnerable countries to the effects of global warming. The country is already experiencing rising sea levels, more extreme weather events, and changes in agricultural yields. These impacts are having a significant impact on the Indian people, especially the poor and marginalized.

Effects on people

Global warming is having a number of negative impacts on people in India, including:

  • Health impacts: Heatwaves, droughts, and floods can all lead to serious health problems, such as heatstroke, dehydration, and waterborne diseases.
  • Food insecurity: Changes in agricultural yields and more extreme weather events are making it more difficult for farmers to produce food. This is leading to food insecurity and hunger, especially among the poor.
  • Displacement: Rising sea levels and extreme weather events are forcing people to leave their homes and communities. This is leading to displacement and homelessness.

Effects on children

Children are particularly vulnerable to the effects of global warming. They are more likely to suffer from heat-related illnesses and waterborne diseases. They are also more likely to be displaced from their homes by extreme weather events.

Effects on underprivileged

The underprivileged are also disproportionately impacted by the effects of global warming. They are more likely to live in areas that are vulnerable to sea level rise and extreme weather events. They are also less likely to have access to resources to help them cope with the impacts of climate change.

What can be done to mitigate the effects of global warming?

There are a number of things that can be done to mitigate the effects of global warming, including:

  • Reduce greenhouse gas emissions: This can be done by switching to renewable energy sources, improving energy efficiency, and reducing deforestation.
  • Adapt to the impacts of climate change: This includes building seawalls to protect coastal communities from rising sea levels and developing drought-resistant crops.

Fun fact: Did you know that India is one of the world’s leading producers of renewable energy? In 2022, India’s renewable energy capacity exceeded 150 gigawatts, which is more than the total coal-fired power capacity of the country.

In more detail

Causes of global warming

The primary cause of global warming is the burning of fossil fuels, such as coal, oil, and natural gas. When fossil fuels are burned, they release greenhouse gases into the atmosphere. Other human activities that contribute to global warming include deforestation, agriculture, and industrial processes.

Impacts of global warming in India

  • Rising sea levels: India’s coastline is one of the most vulnerable in the world to sea level rise. A rise in sea level of just one meter would inundate over 6,000 square kilometers of land in India and displace over 10 million people. Sea level rise is also causing salinization of coastal groundwater, which is making it unfit for drinking and irrigation.
  • Melting glaciers and ice sheets: The melting of glaciers and ice sheets in the Himalayas is reducing the availability of water for drinking, irrigation, and hydropower generation. The melting is also causing an increase in the frequency and intensity of landslides and floods.
  • More extreme weather events: India is experiencing more extreme weather events, such as heatwaves, droughts, floods, and storms. These events are having a devastating impact on people’s lives and livelihoods. For example, the heatwave that swept across India in 2023 killed over 1,500 people.

Additional information

  • The Intergovernmental Panel on Climate Change (IPCC) is the leading international body for the assessment of climate change. The IPCC’s Sixth Assessment Report, released in 2021, concluded that “it is unequivocal that human influence has warmed the atmosphere, ocean and land.”
  • The Paris Agreement is a legally binding international treaty on climate change. The goal of the Paris Agreement is to limit global warming to well below 2°C above pre-industrial levels.

Global Warming and Green house effects | UPSC – IAS

Greenhouse and global warming

Global Warming Introduction

Lot of discussions and deliberations are taking place across the globe on the issue of global warming and its long term consequences on climate changes. Global warming is a phenomenon of disastrous consequences. From the last 2–3 decades, entire world has been talking about global warming but the global effort to check this phenomenon is still preliminary and inadequate. Greater evaporation, untimely melting of ice caps, sea level changes, coastal inundation, etc., have been reported. As revealed by U.S. Satellite, 125 Siberian lakes have been disappeared and two large lakes have shrunk. The chain of events caused by global warming has impact on world economy and the developing countries like India are worst affected.

The green house effect

Earth absorbs incoming solar radiation and then tries to cool by emitting long wavelength infrared radiation. The radiation is absorbed by green house gases and hence they cannot escape. The net effect should be to increase mean annual temperature.

Some of the important Green house gases

  • CO2 – Burning of carbon based fuels
  • CH4 – Anaerobic bacteria in rice field, cows, sewage (4 – 9%)
  • N2O – Fossil fuel and fertilizer
  • CFCs – Refrigeration and spray cans
  • Ozone (O3) – 3 – 7%

Green house gases are absorbed by infrared radiation, which in turn much of the energy is re-radiated to the surface and lower temperature. The mechanism is named after the effect of solar radiation passing through glass and warming a green house. It retains heat and fundamentally by reducing air flow, isolating the warm air inside the structure so that heat is not last by convection.

Joseph Fourier, a French mathematician discovered the green house effect in 1824, first reliably experimented on by Irish physicist John Tyndall in 1858 and first reported quantitatively by Swedish scientist Steve Arrhenius in 1896. In the atmospheric green house effect, sunlight encounter forests, grasslands, ocean surfaces, ice caps, deserts and cities all absorb, reflect and radiate radiation differently. Sunlight falling on a white glacier strongly reflect back into space resulting in minimal heating of surface and lower temperature. Sunlight falling on a desert soil is strongly absorbed and contributes significantly the heating of the surface and lower atmosphere. Cloud cover also affects green house warming by both reducing the amount of solar energy reaching the earth’s surface and by reducing the amount of radiation energy emitted into space.

Real green houses | UPSC – IAS

Green house gases

Green houses effect are named analogy to ‘Green house’. The major difference between green house effect and green houses is that the heat retained are different and both limit the rate of thermal energy flowing out of the system. Through convection i.e., sensible heat support, the absorbed heat is not allowed to leave the green house. Green house gases absorb the outgoing radiative energy and green house gases affect the heat of earth and reemit some of it back towards earth.

The green house is built by means of glass or plastic which allows the sun light to pass through it. Primarily the sunlight heats the ground surface inside which then warms the air in the green house. The air within the green house continues to heat since it is confined within the green house and in the atmosphere, warm air near the surface rises and mixes with the cool air aloft. This can be demonstrated by opening a small window near roof of green house, the temperature will drop considerably. Thus, green house work primarily by preventing convective cooling. In the green house effect, rather than retaining (sensible) heat by physically preventing movement of the air, green house gases act to warm the earth by re-radiating some of the energy back towards the surface.

Green house effect is brought about by several gases and these gases namely Carbon dioxide (CO2), Methane (CH4), Nitrous Oxide ( ), Chlorofluorocarbons (CFxCLx) and tropospheric Ozone (O3). CO2 plays a major role and accounts for about 55% of change in the intensity of green house effect. Chlorofluorocarbons contribute 25%, 15% by Methane and 5%Nitrous oxide respectively. The role of ozone towards enhancement of green house effect is yet to be quantified. In the year 2005, the average concentration of CO2 were about 380 ppm. Prior to 1900, the CO2 concentration was about 280 ppm. Due to increased urbanization and industrialization, the CO2 concentration has enormously gone up which is entering the atmosphere. The main reason for emission of CO2 is due to burning of fossil fuel combustion for transportation, generation of electricity, space heating and cooking, deforestation and destruction of biodiversity. Emission due to fossil fuel combustion accounts for 65% extra CO2 now found in atmosphere. The remaining 35% is derived from the conversion of Prairie woodland and forested ecosystem primary into agricultural ecosystem can hold 20–100 times more CO2 per unit area then agricultural system.

Chlorofluorocarbons are artificially created are the strongest green house gases. These gases are also known to make holes in the ozone layer which has far reaching effect on the human beings. General decline in global stratospheric ozone levels over the last two decades has caused many nations to cut back on their production and use of these chemicals. As per the Montreal Protocol Agreement by forty six nations established a pact and immediate time table for the reduction of chlorofluorocarbons production and use.

The average of concentration N2O is increasing 0.2–0.3% per year. The important reasons for the increase is due to biomass burning, land-use conversion, fossil fuel combustion and soil fertigation. Nitrous oxide is also produced due to conversion of Savanna and grassland ecosystem to agriculture field. These processes reduce the amount of nitrogen stored in living vegetation through decomposition of organic matter. When biomass and fossil fuels are burnt, Nitrous oxide is released into the atmosphere. Extensive usage of nitrate and ammonium fertilizers to enhance the growth is another source of nitrous oxide.

It is difficult to determine the role of ozone in the atmosphere. Concentration of ozone gas are found in two different regions of earth’s atmosphere. Majority of ozone (about 97%) found in the atmosphere is localized in stratosphere at an altitude of 15–55 kms above the earth’s surface. Of late, the concentration of the stratospheric ozone has been decreasing because of the buildup of chlorofluorocarbons in the atmosphere. Since the late 1970s, scientists have discussed that total column ozone present over Antarctica in the spring time have decreased as much as 70%. Ozone is highly concentrated at the earth’s surface and most of this ozone is created as an artificial byproduct of photochemical smog.

Green concentration that is different concentration of the green house gasses are given here Green house gas Conc. 1750 Conc. 2003 Percent change Carbon dioxide 280 ppm 376 ppm 34 % Methane 0.71 ppm 1.79 ppm 152 % Nitrous oxide 270 ppb 319 ppb 18 % CFC 0 880 ppt Not applicable Ozone Unknown Varies with latitude and altitude

Basic mechanism of solar radiation

Most of the radiant energy from the Sun is concentrated in the visible and near visible part of the spectrum. Visible light which represents 43% of the total radiant energy emitted lies between 400–700 nm of the narrow band of visible light. Wavelength shorter than the visible account for 7–8% of the total, but are extremely important because of their high energy per photon. Shorter the wavelength of light more energy it contains. The ultraviolet light is more energetic. The remaining 49– 50% of radiant light is spread over the wavelength longer than those of visible light. Most of the thermal radiation is absorbed by the atmosphere and re-radiated both upwards and downwards; that radiated downwards is absorbed by the earth’s surface. This trapping of long wavelength thermal radiation leads to a higher equilibrium temperature.

The incoming radiation from the Sun is mostly in the form of visible light and nearby wave lengths largely in the range of 0.2–4 mm corresponding to the Sun’s relative temperature of 6000 K. Half of the radiation is in the ‘visible’ light to which our eyes are adapted.

  • Earth’s surface absorbs 50% of Sun’s energy and rest is reflected or absorbed by the atmosphere.
  • The absorbed energy warm the surface and surface of the earth is warmed to a temperature around 255 K, radiates long wave length, infrared heat in the range 4– 100mm. At these wave lengths, green house gases are transparent to incoming solar radiation and are more absorbent. Increasing the concentration of gases increases the amount of absorption and re-radiation thereby further warms the layers and ultimately the surface below.

Projected effects due to global warming in India | UPSC – IAS

Several effects of global warming, including steady sea level rise, increased cyclonic activity, changes in ambient temperature and precipitation patterns have affected or are projected to affect the sub continent. Projected global average surface warming result in temperature increases world-wide at the end of 21st century ranges from 0.6 to 4oC.

  • Rise in sea level: At the end of 21st century there is considerable increase in sea level from 0.18 to 0.59m which results in the submerging of several low-lying islands in the suburbans displacing thousands of people.
  • Economic: Indira Gandhi Institute of Development Research reported that climate related factors could cause India’s GDP to decline by up to 9% and because of this reason would result in shifting growing seasons for major crops such as rice, production of which could fall by 40%. About seven million people will be displaced due to submersion of parts of Mumbai and Chennai, if global temperature were to rise by a mere 2Oc.
  • Environmental: Landslides and flooding are projected have an impact on states such as Assam. Ecological disasters, such as coral bleaching event that killed more than 70% of corals in the reef ecosystem off Lakshadweep and the Andaman. This is brought by elevated ocean temperatures tied to global warming also projected to become increasingly common.
  • Social: Climate change in India will have enormous impact on more than 400 million people because many depend on natural resources for food, shelter and income. More than 56% of people in India work in agriculture, while others earn their living in coastal areas.
  • Pollution: Burning of biomass in north western India and air pollution from industrial cities in north India, often concentrate inside the Ganges basin. Black carbon and dust which are blown towards the higher altitudes by winds at southern faces of Himalayas can absorb shortwave radiation and heat the air over Tibetan plateau.
  • Glaciers in India:
    Glaciers acts as sensors of climate change. Out of the 3% fresh water available on the earth, 67% is stored in glaciers and ice caps. It is estimated that Himalayas alone contribute 30-40% of water to the Ganges which is particularly critical in the dry season prior to monsoon rains in India. Glaciers are the result of continuous snow fall over long period of time that compresses into large, thickened ice masses. As per the latest report provided by the Geological Survey of India, Government of India that Himalaya contains 9,575 glaciers distributed in the Jammu and Kashmir, Himachal Pradesh, Uttarakhand etc. Gangotri glacier is alone more than 30 Km long and covers an area of about 148 Sq Km.
  • Desert: Global warming causes higher temperatures and less rainfall overall. This problem is commonly seen in desert biomes, because the soil dries out, particularly the layer of topsoil that holds the most nutrients. This makes it easier for dust storms to sweep the nutrient-rich topsoil and carry it to other areas which will prevent plant life from thriving and disrupt the entire ecosystem. In addition to dust storms and during monsoon rainfall wash away the top soil and potentially flood the area, since the ground is so dry the water which cannot soak fast into the soil.

Havoc’s due to global warming

  • Hurricanes, flood, Tsunamis and wildfires are becoming common and as a consequence of these destructive events escalate in 21st century. Due to global warming higher wind speeds are recorded so also the increased ocean temperatures.
    These in turn increase the frequency of cyclones.
  • Alarming rise in the sea level – due to green house effect, polar ice caps are melting at a faster rate. Some experts believe that arctic could be ice-free within five years rising sea levels by several feet world wide.
  • Diseases and fungi attack crops lowering the quality and production.
  • Natural disasters will destroy existing crops.
  • Once abundant food may disappear or become expensive.
  • Human beings won’t be able to eat healthy food.
  • Uncontrollable epidemics are on rise.
  • United Nation projects 2.11 billion people will face severe water shortages by 2025 if the consumption continues at current rate.
  • Electrical power production likely to be limited by water shortages.
  • Despite energy efficiency trends, total energy consumption will rise by about 50% over the period 2005-2025.
  • It is predicted that there is likelihood of 190 gigatons of green house gases into the atmosphere.
  • Greenland’s coastal lands projected to rise at a rate of 2 inches/year due to melting of Greenland’s ice sheet.

Future research should aim at combating the evils of global warming to use alternative source of energy and evolving new methods to reduce pollution. Otherwise, this will take lot of toll year after year due to the incidence of incurable diseases.

Biodiversity: Importance, Types, and Distribution | UPSC – IAS

The Importance and Types of Biodiversity: Understanding the Diversity of Life on Earth

The Importance and Types of Biodiversity: Understanding the Diversity of Life on Earth

The Importance and Types of Biodiversity

Biodiversity is a term that refers to the diversity or variety of plants, animals, and other living things in a specific region or area. It is vital to maintain a wide range of species in each ecosystem to preserve the web of life that sustains all living things, including humans. Biodiversity is also essential for humans, as it provides ecosystem services and goods.

The Origin of the Term

Wildlife scientist and conservationist Raymond F. Dasmann first used the term “biological diversity” in the 1968 lay book “A Different Kind of Country.” It was not until the 1980s that the term became widely adopted in science and environmental policy. Edward O Wilson is widely known as the “Father of Biodiversity,” and the term’s contracted form “biodiversity” may have been coined by W.G. Rosen in 1985.

Evolution of Global Biodiversity

Biodiversity is the result of 3.5 billion years of evolution. Until approximately 600 million years ago, all life consisted of archaea, bacteria, protozoans, and similar single-celled organisms. The history of biodiversity during the Phanerozoic (the last 540 million years) starts with rapid growth during the Cambrian explosion. The fossil record suggests that the last few million years featured the greatest biodiversity in history. Estimates of the present global macroscopic species diversity vary from 2 million to 100 million, with a best estimate of somewhere near 9 million, the vast majority arthropods.

Types of Biodiversity

Biodiversity is classified into three fundamental and hierarchically-related levels in terms of genes, species, and ecosystems.

  1. Genetic diversity: This represents the heritable variation within and between populations of organisms. Ultimately, this resides in variations in the sequence of the four base-pairs which, as components of nucleic acids, constitute the genetic code.
  2. Species diversity: Biodiversity is very commonly used as a synonym of species diversity, in particular of “species richness.” Discussion of global biodiversity is typically presented in terms of global numbers of species in different taxonomic groups. Around 2 million species have been described to date, and estimates for the total number of species existing on earth at present vary from 5 million to nearly 100 million.
  3. Ecosystem diversity: Hierarchically, this is the highest level of biodiversity. The quantitative assessment of diversity at the ecosystem, habitat, or community level remains problematic. Instead of considering the diversity within and between species, the entire ecosystem is considered for analyzing biodiversity.

Distribution of Global Biodiversity

Biodiversity is not evenly distributed across the globe, and it varies greatly within regions. The diversity of all living things depends on temperature, precipitation, altitude, soils, geography, and the presence of other species. The science of biogeography studies the spatial distribution of organisms, species, and ecosystems.

Conclusion

Biodiversity is a vital aspect of life on Earth. The diversity of plants, animals, and other living things in an ecosystem is essential to sustain all living things, including humans. Understanding the types and distribution of biodiversity is essential to preserve and protect the web of life that sustains us all.

Water Resources | UPSC – IAS

Water Resources

Water is called Universal Solvent necessary for human civilization, living organisms and natural habitat. It is used for drinking, industry, agriculture, transportation, recreation and animal husbandry producing electricity for domestic, commercial and industrial use. Water, as a resource and river water, surface ponds, lakes, groundwater are all part of one system. Water is an important part of ecological system. Underground aquifers and rivers often cut across the state boundaries. Drought and flood affect vast areas of the country. Hydrogen cycle moves enormous quantity of water around the globe. 97.5% of all water on earth is saline water and remaining 2.5% is fresh water, most of which lies deep and frozen in Antarctica and Greenland and only about 0.25% in rivers, lakes and in soils are readily usable for mankind.

Precipitation is the basic source of water for both surface water and groundwater. Precipitation in the rainfall varies across the regions of the country and it is found to be 100 mm in western part of Rajasthan and 10000 mm at Cherrapunji in Meghalaya. Therefore, it is need of the hour to conserve the profile of soil, ponds, lakes, rivers and reservoirs for use during dry seasons. Reports indicated that out of total geographical area of 329 million hectare, 263 million people live in drought prone area.

Surface water

Animal surface runoff generated by rainfall and snowmelt is estimated to be about 1869 billion cubic meters (BCM) in India. It is estimated that only 690 BCM (37%) of surface water resources can actually be mobilized. Over 90% of annual flow of the Himalayan Rivers occurs over a four months period and capacity to capture such resources is complicated by suitable storage sites.

Rainfall
The average annual rainfall in India is about 1170 mm. Possible changes in rainfall patterns in the coming years, global warming and climate change could affect India’s water resources. About 10 million rainwater harvesting structures are to be constructed within a limited time period, to store the 400 BCM of river flows discharged into the sea without being utilized (Menon, 2001). This results in the acquisition of lakhs of hectares of land, mostly small land holders, displacing millions of poor farmers.

Ground water
It is estimated that about 30% of groundwater potential has been tapped for irrigation and domestic use and India’s rechargeable annual ground water potential has been assessed at around 431 BCM in aggregate. Large parts of the country have already exploited dynamic recharge. It is reported that Punjab and Haryana exploited about 97% ground water. States like Rajasthan, Gujarat, Western Uttar Pradesh and all Deccan states have depleting ground water. In India, fragile water resources are stressed and depleting while various sectoral demands are growing rapidly. In the ancient times, maximum water resources have been used for agriculture irrigation but with the growth in Indian economy and industrial activities, share of water is changing rapidly. Also, increased population and urbanization put an additional demand on water resources. Various reports revealed that annual demand of water may increase from 552 BCM in 1997 to 1050 BCM by 2025.

Physical resources

Physiographic factors play a very important role in the origin, distribution and utilization of water resources. India is divided into following regions

  • a) The northern mountains
  • b) The great plain
  • c) The central highlands
  • d) The peninsular plateau
  • e) The east coast belt
  • f) The west coast belts
  • g) The islands. Entire country has been divided into 6 major river resource regions, 35 basins, 112 catchments, 550 subcatchments and 3237 (major) watersheds.

Water use in Agricultural Production

Development of water resources has been undertaken for specific purposes like irrigation, flood control, hydro-power generation, industrial and drinking water supply. Due to this reason, a large number of projects comprising dams, barrages, hydropower structures, canal network etc., have come up all over the country in successive five year plans.

In a span of five decades, food grain production which was only 51 M.Tons in 1950-51, crossed 208 M.Tons during 1999-2000. India is self sufficient in food grain production and also has 50 M.Tons of buffer stock to meet any shortages which may occur due to bad climatic conditions. India has become second largest producer of wheat, rice and sorghum, the third largest producer of sugarcane and fourth largest producer of cotton. In fruits and vegetables, India shares first position with China. In the animal husbandry and dairy sector too, progress has been quite impressive. India has witnessed developments in inland fish production and has the distinction of being the seventh largest producer of fish in the world and second largest producer of inland fish after China. Among the states, West Bengal is the highest producer followed by Andhra Pradesh and Bihar. These three states together produce 50% of the total inland fish production in the country, while the state of West Bengal alone accounts for 1/3 of this production.

The country’s population which is over 1.22 billion and is expected to reach around 1.39 billion by 2025. The food grain production will have to be raised to around 350 M.Tons by the year 2025. This therefore requires “development of water resources” so as to meet the food and fiber of our growing population. Irrigation constitutes the main component of water use in rural areas. The land holdings of India are predominantly of small size. Marginal size holdings (< 1 hectare) with an average size of 0.4 hectare constitute 59%, small holdings of 1 to 2 hectare size constitute 19% of the total land holdings. Semi-medium holdings of 2 to 4 hectare account for 13.2% and rest are medium (7.2%) and large (1.6%).

Drinking water supply in India

Rural water supply in India is largest of its kind in the world and remarkable achievement has been made due to the combined effect of state and central governments. There is considerable depletion of ground water due to inadequate recharging efforts, heavy dependence of ground water for irrigation and drinking water supply and neglect of traditional practices such as rain water harvesting resulted in the depletion of ground water which has fallen short of 20 cms/year. Our country is facing three major challenges in water sector namely a) slippage of covered habitations, b) water quality problems, c) sustainability of sources and systems as reported by Meenakshi Sundaram, in the year 2002. Despite improved coverage and access to drinking water supply in rural India, about 217, 211 habitations are facing water quality problems. Meenakshi Sundaram also emphasized the need to take up remote sensing techniques to identify the location of water bodies like ponds, lakes, tanks, etc., under the project ‘SWAJALDHARA’.

Quality of fresh water is declining year after year. Water distress is commonly seen in desert and drought prone areas. In addition, improper utilization of water resources and neglect of traditional water resources environment have further aggravated the situation. Due to this reason, degradation of quality and incidence water related diseases, water scarcity and falling water levels in several parts of the country. To solve this perennial problem, Government of India proposed a plan in 2003 for “Interlinking of various rivers of India”. This programme has certain objectives such as augmentation of irrigation agriculture (35 M.ha i.e., from 140 M.ha. to 175 M.ha.), clean and potable water for urban and industrial areas, to generate cost effective hydropower (35,000 to 40,000 MW), inland navigation, employment generation, ecological up-gradation due to regular supply of water, utilization of flood and drought and afforestation. “Interlinking of rivers” should become social and economic programme for distribution of water for domestic and other purposes and main issues concerning environment, ecology and displacement of people, etc.

Although, the availability of water decreasing year after year, yet in India water continues to be used inefficiently. If India were to succeed in social, economic and environment fronts, fundamental changes in how water is captured, allocated, managed and planning must occur. Therefore there is urgent need to evolve “water accounting and budgeting” at national, regional, sub-regional and grass root level (i.e., village or block level) so as to ensure utilization of water more judiciously. This also provides water scarcity, food security, health security, ecological security and livelihood security for the people.

Management of water resources

Judicious management of groundwater is very much necessary through scientific resources management and conservation. In India, utilization of ground water potential is limited and requires proper management. In many developed countries, law does not permit to use the groundwater indiscriminately. This requires thorough understanding of hydrology, GW system, SW systems, availability of energy from pumping and social dynamics.

Water demand trends
At independence, population was less than 400 million and per capita water availability over 5000 cubic meter per year. With the population crossed 1 billion mark, water availability has fallen to about 2000 m3/year per capita. By the year 2025 capita availability is projected at only 1500 m3/year or 30% of availability levels at independence.

Population and water availability trends
Indian economy depends on availability of ground water as an important component of water. 80% of groundwater is used for domestic purpose and an important source of drinking water and security of food in India. 50% groundwater is used for urban and industrial uses. Very significant percentage of water is used for irrigation and contributed to India’s agriculture and economic development. The per capita water availability of natural runoff is at least 1100 cu.m. Per year. Due to water pollution and inappropriate waste disposal, water availability of ground and surface water is further reduced. Though India is facing various serious water constraints to-day, India is not on the whole a water scarce country. The present water availability in India is approximately 2200 m3 per annum, actually compares quite favourably with a number of other countries.

Water sharing issues

More than 1.3 billion people live in south Asia. Almost half of these depend on river system for water needs. Many of those major rivers, some of which are amongst the world’s largest, flow across national borders and have been source of tension in the region.

In western part of sub continent, water of the Indian basin are shared and by Pakistan and India. In north and north-east, the basins of Ganges, Brahmaputra and Meghna are shared by India, Nepal, Bhutan and Bangladesh and some areas in China. Even within the country, there are plenty problems pertaining to water sharing between the states. In south India, Cauvery water is shared by Karnataka, Tamil Nadu, Pondicherry and Kerala and Krishna River is shared by Karnataka, Maharashtra and Andhra Pradesh. Cauvery tribunal was formed by Government of India in 1990 to look into the matter. Tribunal has allocated 419 billion sq ft of water annually to Tamil Nadu, 270 billion ft2 to Karnataka and 7 billion sq ft to Pondicherry and 30 billion sq ft Kerala. Sharing of Krishna River was referred to Bachawat commission which has agreed to allocate 560TMC to Maharashtra, 700TMC to Karnataka and 800 TMC to Andhra Pradesh.

Water sector investment
India is giving top priority for the investment in water sector for sustained economic growth since independence. Huge amount is invested for irrigation of Rs.576 billion the gross irrigated area, increased four-fold from 23 million hectares in 1951 to about 90 million hectare in 1997, substantially increasing and stabilizing the income of millions of farmers throughout the country. Considerable achievement has been made in drinking water coverage. About 85% of Indian urban population has access to public water supplies and over 75% of the rural population is now provided with public water supply.

Reforms in the water sector
Various reforms in the management of water resources are necessary but by its nature water is multi-dimensional. It involves users from different sectors with widely different needs. Due to federal administrative structure and enormous population, India’s task is made all the more difficult. Government should allocate sufficient amount in the budget and stringent environment laws are to be enacted. Implementation of reforms needs to be made through public debate and participatory process.

National water policy

This policy mainly addressed to vital issues related to develop, conserve, utilize and manage water resources in 21st Century. The major aspect is that “Integrated water resources development plan in the country and cautioned the timely action in respect of

  • a) water efficiency should be improved,
  • b) taking necessary steps for demand and supply,
  • c) to protect the surface water flow through major, medium and minor storages.

The All India Soil and Land Use Survey (AISLUS) reported that the entire country has 3,237 major watersheds. Each watershed contains a complex mixture of land use characteristics, climatic conditions, landscapes, soil types and agricultural systems. Cropping pattern of an area is determined by many factors which include rainfall, soil types, climate, characteristics and farmer’s requirements of food grains for self consumption as well as market supply and net rate of financial gain, resulting in various alternative crops that can be grown in that area. Every state of the country should concentrate on its agro-ecological and agro-climatic conditions.

Precipitation: ‎Types of Rainfall | ‎Convectional Rainfall | ‎Orographic Rainfall

Hydrological cycle: Types of Rainfall UPSC

Hydrological cycle: Types of Rainfall UPSC

Precipitation is an important step concerned with hydrological cycle. So it is very interesting to know how water moves upward to the sky and how we get the rain. As such precipitation is an interesting topic, and today we are going to discuss this topic under the following captions. They are:-

  • Definition of precipitation
  • Formation, Size and Rate of Precipitation
  • Different classes of precipitation
  • Precipitation measurement
  • Effects of Climate Change on precipitation

Concept of precipitation | UPSC – IAS

Precipitation in meteorology refers to all forms of liquid or solid water particles that form in the atmosphere and then fall to the earth’s surface. Precipitation is defined as liquid or solid condensation of water vapor falling from clouds or deposited from air onto the ground. It is the primary connection in the water cycle that provides for the delivery of atmospheric water to the Earth.

  • It includes rain, sleet, snow, hail and drizzle plus a few less common occurrences such as ice pellets, diamond dust and freezing rain. Frost and dew are not classified as precipitation because they form directly on solid surfaces.

There are two types of precipitation, liquid and solid types.

  • Solid precipitation: Precipitation in the form of ice flakes, such as snow, is called solid precipitation, and that in the form of water drops is sometimes called liquid precipitation.
  • Liquid precipitation: Liquid forms of precipitation include rain and drizzle. Rain or drizzle that freezes on contact within a subfreezing air mass is called “freezing rain” or “freezing drizzle”. Frozen forms of precipitation include snow, ice needles, ice pellets, hail, and graupel.

Types of precipitation or rainfall UPSC - IAS

So, what is rain?

  • Rain is drops of liquid water falling from the sky. In order for the raindrops to become heavy enough to fall, droplets of water in the cloud collide together with other droplets and other particles in the air – like soot and dust – to become larger. Once the drops become too heavy to stay in the cloud, it falls as rain.

Raindrops can be up to 6 mm in diameter, but anything less than 0.5 mm is considered as drizzle. Drizzle consists of very small droplets of water falling from low level stratus clouds. Drizzle droplets are less than 0.5 mm in diameter – larger than the droplets in clouds, but smaller than raindrops.

  • Freezing rain is rain droplets which fall in supercooled liquid form, but freeze on contact with the ground or another object to form clear ice – also known as glaze. Supercooling occurs in clouds where droplets remain in a liquid form in temperatures below the normal freezing point. In order for the super-cooled droplets to freeze on contact, the ground temperature is normally close to or below 0 °C. Freezing rain can fall as rain droplets or drizzle.

Solid precipitation: Hail is solid precipitation in the form of balls or pieces of ice known as hailstones. Hail only forms in cumulonimbus clouds – more commonly known as thunder clouds.

  • In thunderclouds, drops of water are continuously taken up and down through the cloud. When they go to the top of the cloud, it is very cold and they freeze. As the up draughts in thunderclouds are very big, they can keep these hailstones for a long time, so they get larger and larger by becoming coated with more and more ice. Then, when they get really big, the up draughts in the cloud cannot hold them up anymore and they fall to earth, and by this time they are big balls of ice, and so don’t have time to melt before they reach the ground. Hail can only be formed in this way, unlike snow which can be formed in fronts, and orographically too, just like rain. Hailstones can vary in size from 5 mm to 150 mm in diameter, however most hailstones are smaller than 25 mm.
  • Another form of solid precipitation is Ice pellets. Ice pellets are snowflakes which have started to melt, and then re-frozen as they fall through colder air. The result is a grainy snow pellet encased in ice. Ice pellets are generally smaller than hailstones and bounce when they hit the ground.
  • Snow is tiny ice crystals stuck together to become snowflakes. If enough ice crystals stick together, they’ll become heavy enough to fall to the ground.
  • When coming to sleet, it has no internationally agreed definition but is reported in meteorological observations as “rain and snow mixed”. Sleet, which is sometimes known as ice pellets, is basically snow which has begun the melting process before it reaches the ground.

So, next question is what is diamond dust? | UPSC – IAS

Diamond dust, sometimes just called ice crystals, consists of extremely small ice crystals, usually formed at low levels at temperatures below -30° C. The name diamond dust comes from the sparkling effect created when light reflects on the ice crystals in the air.

Formation, Size and Rate of Precipitation | UPSC – IAS

  • The clouds floating overhead contain water vapor and cloud droplets, which are small drops of condensed water. These droplets are very too small to fall as precipitation, but they are large enough to form visible clouds. Water is continually evaporating and condensing in the sky. If you look closely at a cloud you can see some parts disappearing (evaporating) while other parts are growing (condensation).
  • Most of the condensed water in clouds does not fall as precipitation because their fall speed is not large enough to overcome updrafts which support the clouds. For precipitation to happen, first tiny water droplets must condense on even tinier dust, salt, or smoke particles, which act as a nucleus. Water droplets may grow as a result of additional condensation of water vapor when the particles collide. If enough collisions occur to produce a droplet with a fall velocity which exceeds the cloud updraft speed, then it will fall out of the cloud as precipitation. This is not a trivial task since millions of cloud droplets are required to produce a single raindrop. A more efficient mechanism (known as the Bergeron-Findeisen process) for producing a precipitation-sized drop is through a process which leads to the rapid growth of ice crystals at the expense of the water vapor present in a cloud. These crystals may fall as snow, or melt and fall as rain.
  • Rain is the liquid form of precipitation on Earth. It is part of the hydrologic cycle that begins when water evaporates and forms clouds in the atmosphere. The water that forms these clouds is frozen and vaporized. Once enough water has evaporated, it is then released in the form of droplets of rain back to the surface of the Earth.
  • A stationary raindrop initially experiences acceleration due to gravity as would any falling body. As gravity increases the speed of the raindrop in its descent, drag retards the downward acceleration of the raindrop. Usually, air resistance that comes in contact with the water molecules as they fall causes the drag. The combination of these two forces causes a raindrop to reach a terminal velocity when the drag force is approximately equal to the weight of the raindrop. At this point, a raindrop experiences no further acceleration and therefore falls at a constant velocity.
  • The magnitude of the terminal velocity of an object is also affected by its orientation. A common misconception is the shape of the raindrop. It is often depicted as pointy and lopsided.
  • Precipitation rates vary geographically and over time. Precipitation does not fall in the same amounts throughout the world, in a country, or even in a city.
  • The Global Precipitation Measurement Core Observatory (GPM) surveys Earth’s weather from 65 degrees north to 65 degrees south latitude. GPM works along with a constellation of other satellites to provide worldwide coverage.
  • On the ground, precipitation can be measured by an array of rain gauges scattered around the world. From its 253-mile-high (407 kilometers) orbit, the GPM satellite passes over almost the entire world. GPM circles the globe every 93 minutes, completing 16 orbits per day. GPM is one of a constellation of weather satellites.
  • The satellite carries a microwave imager. Its scanning antenna rotates 32 times per minute, while a downward pointing detector reads microwaves reflected from the atmosphere below. As it orbits, GPM scans the Earth’s atmosphere with its Dual-Frequency Precipitation Radar.

Different kinds of precipitation or Rainfall | UPSC – IAS

 There are three types of rainfall explain with suitable diagram:-

  1. Convectional rainfall
  2. Orographic rainfall
  3. Cyclonic rainfall.

Orographic Precipitation or Rainfall | UPSC – IAS

Orographic precipitation results when warm moist air moving across the ocean is forced to rise by large mountains. As the air rises, it cools; this is because a higher elevation results in cooler temperatures.

Orographic rainfall diagram upsc

Cold air cannot hold as much moisture as warm air. As air cools, the water vapor in the air condenses and water droplets form. Cloud forms and precipitation (rain or snow) occurs on the windward side of the mountain. Then the air is dry and rises over the top of mountain. As the air moves back down the mountain, it collects moisture from the ground via evaporation. This side of the mountain is called the leeward side. It receives very little precipitation.

  • In orographic rainfall, the leeward side of the mountain gets less rainfall.
  • Orographic precipitation occurs due to air masses being lifted to higher altitudes by a mountain.

Convectional Precipitation or Rainfall | UPSC – IAS

  • Convective precipitation is also known as thermodynamic precipitation. Convectional precipitation results from the heating of the earth’s surface. The warm ground heats the air over it. As the air warms, the air molecules begin to move further apart. With increased distance between molecules, the molecules are less densely packed.

Convectional rainfall diagram upsc

  • Thus, the air becomes “lighter” and rises rapidly into the atmosphere. As the air rises, it cools. Water vapor in the air condenses into clouds and precipitation. This type of precipitation is common in the Prairies and Ontario.

Characteristics of convectional rainfall:-

  • Heavy rainfall with lightning and thunder takes place which does not last long.
  • This type of rainfall generally takes place in the equatorial regions and internal parts of the continents, predominantly in the northern hemisphere.
  • Such rain is usually in the summer or the hotter part of the day.
  • This rainfall is usually associated with hail and graupel,

Cyclonic or Frontal precipitation or Rainfall | UPSC – IAS

  • Cyclonic or Frontal precipitation results when the leading edge of a warm, moist air mass meets a cool and dry air mass. The molecules in the cold air are more tightly packed together, and thus, the cold air is heavier than the warm air. The warmer air mass is forced up over the cool air. As it rises, the warm air cools, the water vapor in the air condenses, clouds and precipitation results. This kind of precipitation is common in Atlantic Canada.
  • This type of system is called Frontal Precipitation because the moisture tends to occur along the front of the air mass.

Cyclonic rainfall diagram upsc

  • A cyclonic storm is a large, low pressure system that forms when a warm air mass and a cold air mass collide. This collision often occurs under the polar-front jet stream which spreads cold, dry arctic air near warm, moist tropical air. The rotation of the earth causes the air to circulate in a counterclockwise direction around an area of low pressure.

Other Types of Rainfall | UPSC – IAS

Dynamic precipitation or stratiform precipitation | UPSC – IAS

  • Dynamic precipitation is also known as stratiform precipitation. Dynamic precipitation results from a forced lifting of air. These forcing mechanisms include processes that cause low level convergence and upper level divergence.
  • As unsaturated air rises the relative humidity of the air will increase. Once the air saturates, continued lifting will produce clouds and eventually precipitation. Dynamic precipitation tends to have a less intense rain rate than convective precipitation and also tends to last longer.

Monsoonal Rainfall Characteristics | UPSC – IAS

This type of precipitation is characterized by seasonal reversal of winds that carry oceanic moisture (especially the south-west monsoon) with them and cause extensive rainfall in the south and southeast Asia.

  • The duration of the monsoon is between 100 to 120 days from early June to mid-September.
  • monsoon arises due to a difference in temperatures between a land mass and the adjacent ocean.
  • Around the time of its arrival, the normal rainfall increases suddenly and continues for several days. This is known as the ‘burst’ of the monsoon.
  • A wind from the southwest or south that brings heavy rainfall to southern Asia in the summer.

Effects of Climate Change on precipitation | UPSC – IAS

  • As temperatures rise and the air becomes warmer, more moisture evaporates from land and water into the atmosphere. More moisture in the air generally means we can expect more rain and snow (called precipitation) and more heavy downpours. But this extra precipitation is not spread evenly around the globe, and some places might actually get less precipitation than they used to get. That is because climate change causes shifts in air and ocean currents, which can change weather patterns.
  • On average, the world is already getting more precipitation now than it did 100 years ago: nearly 2 percent more worldwide. The effects vary by region.
  • In future precipitation is expected to increase in higher latitudes and decrease in areas closer to the Equator.
  • This is the matter of concern, because too little or too much water can be a problem. In many places, people depend on rain and snowmelt to fill lakes and streams and provide a source of water for drinking, watering crops, and other uses. However, heavy rain can cause flooding.

Effects on agriculture due to Precipitation:

  • The crops that we grow for food need specific conditions to thrive, including the right temperature and enough water. A changing climate could have both positive and negative effects on crops. Global climate change will also affect agriculture and food supply in many other ways.
  • Climate change could make it too hot to grow certain crops, and droughts caused by climate change could reduce the amount of water available for irrigation. Climate change is also likely to cause stronger storms and more floods, which can damage crops. Higher temperatures and changing rainfall patterns could help some kinds of weeds and pests to spread to new areas.

Effects on water supply due to Precipitation:

  • Climate change is affecting where, when, and how much water is available for people to use. Many parts of the world already have very little water, and climate change could make this problem worse. Rising temperatures, changing precipitation patterns, and increasing droughts will affect the amount of water in lakes, rivers, and streams, as well as the amount of water that seeps into the ground to replenish ground water.

Effects on forests due to Precipitation:

  • Forests provide homes for many kinds of plants and animals. They also protect water quality, offer opportunities for recreation, and provide people with wood. Forests are sensitive to many effects of climate change, including shifting weather patterns, drought, wildfires, and the spread of pests like the mountain pine beetle. Unlike some animals, trees can’t just get up and move when the temperature gets too hot or other conditions change!
  • As the Earth gets warmer and droughts increase, wildfires are expected to occur more often and be more destructive. Wildfires do occur naturally, but the extremely dry conditions resulting from droughts allow fires to start more easily, spread faster, and burn longer. Fires don’t just change the landscape; they also threaten people’s homes and lives.
  • Directly or indirectly global climate change affecting precipitation pattern and there by threatening human beings.

Conclusion | UPSC – IAS

  • All of the precipitation that falls originated as water vapor that was evaporated from the surface of the Earth. It is always raining somewhere on the Earth, just as evaporation is always occurring over most of the Earth’s surface. So, a cloudy day with no precipitation indicates that there is either
    • Not enough water vapor available to the cloud for precipitation to form, or
    • That the rising motion creating the cloud is not strong enough — or there may be both the reasons.

Types of Clouds and their Origin | UPSC – IAS

Hydrological cycle in detail description | UPSC

Types of clouds and their characteristics upsc

Types of Clouds and their Origin | UPSC – IAS

We all know the sky can be full of water. But most of the time we can’t witness the water. The drops of water are too small to see. Clouds are visible accumulations of water droplets or solid ice crystals that float in the Earth’s troposphere moving with the wind. From space, clouds are visible as a white blanket surrounding the planet. So in this session we are going to discuss the origin, types and also importance of clouds.

Origin of clouds | UPSC – IAS

  • As defined by the World Meteorological Organization (WMO), it’s primarily “a hydrometeor consisting of a visible aggregate of minute particles of liquid water or ice, or both, suspended in the free air and usually not touching the Earth’s surface.” Thus, clouds are the visible sign of ongoing atmospheric processes and as such they are a useful diagnostic tool.
  • Clouds are made of tiny drops of water or ice crystals that settle on dust particles in the atmosphere. The droplets are so small – i.e., a diameter of about a hundredth of a millimeter – in which each cubic meter of air contain 100 million droplets.

Formation of clouds | UPSC – IAS

  • Clouds form when the invisible water vapor in the air condenses into visible water droplets or ice crystals. There is water around us all the time in the form of tiny gas particles, also known as water vapor. There are some tiny particles floating around in the air – such as salt and dust – these are called aerosols.
  • The water vapor and the aerosols are constantly bumping into each other. When the air is cooled, some of the water vapor sticks to the aerosols when they collide – this is like condensation. Eventually, bigger water droplets form around the aerosol particles, and these water droplets start sticking together with other droplets, forming clouds.
  • The warmer the air is, the more water vapor it can hold. Clouds are usually produced through condensation – as the air rises, it will cool and reduced temperature of the air, decreases its ability to hold water vapor so that condensation occurs. The height at which dew point is reached and clouds are formed that point is called as condensation level.

Required elements for cloud formation

Clouds consist of many tiny droplets resulting from the condensation of water vapor (gaseous state) into liquid water or ice (solid state). They form when the air is cooled to its dew point. This is considered its condensation or saturation point.

  • The first requirement for cloud formation is moisture. This moisture is constantly recycled through the earth-atmosphere system by means of the hydrologic cycle. Moisture in this cycle exists normally in the 3 states of water: solid, liquid, and vapor.
  • The primary way to cool the atmosphere is through upward vertical motion or lifting of air. Thus the second requirement for cloud formation is a source of lift, through the following processes:

Fronts associated with low pressure systems Orographic or mountain barriers

  • Convection
  • Convergence (forced coming together of airflow)

While vertical motion is the primary method of cooling that leads to cloud formation, there are two other atmospheric cooling processes. These processes are advection and radiation, and they can lead to cooling of the lower layers of the atmosphere.

  • Advection refers to the horizontal movement of air or moisture across the earth’s surface. For example, if mild moist air moves (advects) over a snow pack or other cold surface (land or water), the air may be cooled to its saturation point from below. This may lead to fog formation.
  • Radiational cooling can also cool the lower layers of the atmosphere on clear, calm and dry nights. As the earth’s surface cools, it will cool the air in contact with it. This air may be cooled to its saturation point resulting in the formation of late night or early morning fog or ground fog. This type of fog occurs frequently in river valleys.

Thus, moisture and lift are required for cloud formation. This lift must cool the atmosphere sufficiently so it approaches its dew point or saturation point.

Types of Clouds | UPSC – IAS

Clouds are an important part of Earth’s weather. There are many kinds of clouds. The meteorologist classifies clouds mainly by their appearance.

 Types of Clouds | UPSC - IAS

After World War II, the World Meteorological Organization published a new International Cloud Atlas (1956) in two volumes. It contains 224 plates, describing 10 main cloud genera (families) subdivided into 14 species based on cloud shape and structure. Nine general varieties, based on transparency and geometric arrangement are also described. The genera, listed according to their height, are as follows:

High clouds: These clouds are high up in the sky, mean heights from 5 to 13 km, or 3 to 8 miles. The important high cloud types are,

  • Cirrus
  • Cirrocumulus
  • Cirrostratus

Middle clouds: Middle clouds are found between low and high clouds, mean heights 2 to 7 km, or 1 to 4 miles. The following are some important middle clouds,

  • Altocumulus
  • Altostratus

Low clouds: Low clouds form closer to Earth’s surface. Low clouds can even touch the ground, mean heights 0 to 2 km, or 0 to 1.2 miles.. These clouds are called as fog. They are,

  • Nimbostratus
  • Stratocumulus
  • Stratus
  • Cumulus
  • Cumulonimbus

Another way the clouds are named is by their shape. Cirrus clouds are high clouds. They look like feathers. Cumulus clouds are middle clouds. These clouds look like giant cotton balls in the sky. Stratus clouds are low clouds. They cover the sky like bed sheets.

  • Heights given are approximate averages for temperate latitudes. Clouds of each genus are generally lower in the Polar Regions and higher in the tropics.

types of clouds in detail overview | UPSC

Four principal classes are recognized when clouds are classified according to the kind of air motions that produce them:

  • Layer clouds formed by the widespread regular ascent of air,
  • Layer clouds formed by widespread irregular stirring or turbulence,
  • Cumuliform clouds formed by penetrative convection, and
  • Orographic clouds formed by the ascent of air over hills and mountains.

So what are the causes for cloud formation?

There are five factors which can lead to air rising, cooling and clouds formation

  • Surface heating – This happens when the ground is heated by the sun which heats the air in contact with it causing it to rise. The rising columns are often called thermals. Surface heating tends to produce cumulus clouds.
  • Topography forcing – The topography – or shape and features of the area – can cause clouds to be formed. When air is forced to rise over a barrier of mountains or hills it cools as it rises. Layered clouds are often produced by this way.
  • Frontal – Clouds are formed when a mass of warm air rises up over a mass of cold, dense air over large areas along fronts. A ‘front’ is the boundary between warm, moist air and cooler, drier air.
  • Convergence – Streams of air flowing from different directions are forced to rise where they flow together, or converge. This can cause cumulus cloud and showery conditions.
  • Turbulence – A sudden change in wind speed with height creating turbulent dynamics in the air.

The range of ways in which clouds can be formed and the variable nature of the atmosphere results in an enormous variety of shapes, sizes and textures of clouds.

Atmospheric processes creating lift and clouds | UPSC – IAS

  • Since cold air (dense) sinks and warm air (less dense) rises, clouds that form in an unstable environment (warm below and cold aloft) tend to be lumpy or globular in appearance. These clouds will resemble bubbles in a pot of boiling water.
  • These are the cumuliform or convective clouds that we are all familiar with and are due to the localized nature of the sudden updrafts and downdrafts of convection.

On the other hand, a stable environment (cold surface and warm aloft) is characterized by a more gradual lifting process resulting in extensive areas of layered or stratiform type clouds. These clouds last longer than those involved in convective processes.

Clouds due to lift by fronts

  • For over three-quarters of the 20th century, the low pressure/cyclone conceptual model developed by the Norwegian School of meteorologists has dominated weather analysis techniques. With the advances in satellite and radar technology, this concept continues to evolve, but the conceptual model still forms the foundation for understanding frontal lift and cloud formation.
  • In the case of a warm front, both the warm advancing air and the cold retreating air are moving in the same direction. As warm air glides up and over cold surface air (warm front), the clouds tend to be layered.
  • In contrast, cold fronts cause more abrupt lifting with more intense localized vertical motion as the cold and warm air masses collide. This generally results in cumuliform clouds with showery conditions as the cold air undercuts and forces the warm air up.

Frontal lift Clouds are generally of the stratiform layered type (stable) when associated with warm fronts. Cold fronts are generally associated with cumuliform clouds (unstable). Thunderstorms are most likely with cold fronts but can accompany warm fronts.

Orographic lift clouds

Air flow perpendicular to a range of hills or mountains is forced to rise up and over the mountains (i.e. the orographic barrier). As the air rises on the windward side of the mountain range (or hills), it cools (expansion) and may eventually reach its saturation point with clouds forming. The reverse is true as the air descends down the leeward side of the mountains. This subsiding air is warmed through compression.

  • Subsiding, warming air can hold more moisture before reaching saturation. As a result, clouds tend to break up to the lee of mountains.

This process frequently happens during a winter snowstorm, with heavy snow along the windward side and lesser amounts to the lee of the mountains. It is referred to as the umbrella or shadowing effect of mountains.

Lift due to convection

  • We are all familiar with the white cotton ball (cumulus) type clouds on a warm summer afternoon. This is the process of convection.
  • The earth’s atmosphere is transparent to incoming solar radiation. Once this radiation hits the ground, it will convert to heat energy. As the ground warms, the air in contact with the ground is also warmed through conduction.
  • As the air is warmed, it becomes less dense, thus it rises (convection). However, as air rises it cools, with clouds ultimately forming over the updraft. The spacing of these up and down drafts results in the observed distribution of cumulus clouds. On the edges of the clouds, cool air sinks to replace the warm air rising, thereby completing the convection cell.

Lift due to Convection results in clouds and may occur in combination with other forms of lift (frontal or orographic) with showers or thunderstorms ultimately developing.

Convergence and lift

Another source of lift, which is really a combination of the above processes, is convergence. When air is forced to converge or come together, it can only go upward (can’t go into the ground). An example would be the air flowing inward toward the center of low pressure which is forced to rise.

Colors of clouds | UPSC – IAS

Before going to cloud color, we must understand why the sky is blue? The rays from the sun have all of the colors in the visible color spectrum in them, so the rays appear to be white. This “white” sunlight passes through the Earth’s atmosphere, and the tiny airborne molecules, such as nitrogen particles, scatter the light from the blue part of the color spectrum. The molecules scatter the blue light until it is evenly distributed. The other colors in the spectrum reach the Earth’s surface with no interference, so their color isn’t distributed throughout the sky. Therefore, the sky appears to be blue.

  • Clouds are white because the water droplets are bigger than the particles that scatter the blue light in the sky. The clouds scatter and reflect all the visible colors of light that strike them. Since the visible colors of the sun appear to be white, the clouds that reflect that light must be white too. So clouds are white because they reflect the white light from the sun.
  • In some cases, if the cloud is super thick or filled with a lot of water molecules; sunlight cannot pass through the cloud. Therefore, clouds can appear very dark because of the lack of sunlight shining through.
  • The white colors of clouds come from the condensed water vapor having a high reflective quality. When all wavelengths of light are reflected back we can see white color. The grey color comes from seeing clouds from beneath. White clouds are white if we notice, on sunny days. This is because we can see the sunlight directly hitting them and see that light almost completely reflected back. On cloudy days most sunlight is blocked by the translucent and refractive quality of cloud cover. This makes clouds appear darker in color as part of the light has been uniformly absorbed.
  • The color of a cloud also depends on the color of the light that illuminates it. When sunlight passes through thick layer of atmosphere and dust particles at sunset, blue color is scattered by Rayleigh scattering and only red-to-orange color remains. The clouds reflect these unscattered red/orange rays and appear in that color. The effect is much like shining a red spotlight on a white sheet.
  • Since the Earth is spherical, the clouds at different heights turn red at different time when the sun crosses the horizon. Just before the sunset, the color of low clouds (e.g. stratus) will turn red first. Shortly after the sunset, the high clouds (e.g. cirrus) would be gradually stained in deep red and become apparent under the darken background. A viewer on the ground can distinguish the clouds at different heights according to the relative timing of their color change during sunset.
  • Clouds at night are visible only when there is a source of light. Thin clouds will generally appear white under the white moonlight. For the bottom of dense low clouds, the main light source is the light from the ground originated from street lamps and other light sources in cities. Such light shines on the cloud aloft and is scattered by the base of a low cloud, making the low cloud appears yellowish orange or white when observed in urban area. The phenomena will be more obvious if the cloud is lower or denser.
  • Finally, clouds have color. Some are white, some are grey, and in special circumstances such as major storms can have weird colors like green or red. This goes back to refraction. Most color that we can see is visible, because our eyes perceive how objects absorb or reflect certain wavelengths of light

Importance of clouds | UPSC – IAS

Clouds are essential to the earth-atmosphere system. Clouds complete the following functions:

  • Clouds help to regulate Earth’s energy balance by reflecting and scattering solar radiation and by absorbing Earth’s infrared energy.
  • They are required for precipitation to occur and, hence are an essential part of the hydrologic cycle.
  • Clouds indicate what type of atmospheric processes are occurring (e.g., cumulus clouds indicate surface heating and atmospheric turbulence).
  • Clouds help to redistribute the extra heat from the equator toward the poles.
  • Clouds are important for many reasons. Rain and snow are two of those reasons. At night, clouds reflect heat and keep the ground warmer. During the day, clouds make shade that can keep us cooler.

Hydrological cycle in detail description | UPSC

Clouds are an important part of our atmosphere and they have a critical role in controlling the amount of the sun’s energy that reaches the earth’s surface. Clouds can have a cooling effect on the atmosphere, which counteract increases in temperature caused by climate change. Understanding exactly how clouds impact on our climate and ensuring that we can accurately model the current role and extent of clouds is critical to determine how any changes in climate will affect clouds and how clouds will affect climate in the future.

  • In order to predict the climate several decades into the future, we need to understand many aspects of the climate system, one being the role of clouds in determining the climate’s sensitivity to change. Clouds affect the climate but changes in the climate, in turn, affect the clouds. This relationship creates a complicated system of climate feedbacks, in which clouds modulate Earth’s radiation and water balances.
  • Clouds are an important part of the water cycle. The water cycle is the movement of water from the Earth into the sky and then back down to Earth again.
  • The sun heats water on the surface of the Earth, and causes it to evaporate. Evaporation is the process when water moves from liquid to vapor form. Water vapor is made up of tiny water droplets in the air. Water can also move into the air through transpiration.
  • The greenhouse effect is not only produced by the greenhouse gases, clouds absorb long wavelength (infrared) radiation from the surface of the Earth and radiate some of it back down. In addition to this absorption and re-radiation of infrared radiation from the Earth’s surface they may simply reflect it back to the surface.
  • Clouds also have a major role in reflecting some of the Sun’s short wavelength (visible light) radiation back into space. Thus clouds share a role with the greenhouse gases and also share a role with the ice and snow fields of the high latitudes.

Conclusion | UPSC – IAS

  • A cloud is a large collection of very tiny droplets of water or ice crystals. The droplets are so small and light that they can float in the air. All air contains water, but near the ground it is usually in the form of an invisible gas called water vapor.
  • When warm air rises, it expands and cools. Cool air can’t hold as much water vapor as warm air, so some of the vapor condenses into tiny pieces of dust that are floating in the air and forms a tiny droplet around each dust particle. When billions of these droplets come together they become a visible cloud.
  • Clouds are important in weather forecasting and also play an important role in hydrological cycle.

All about Mid-Ocean Ridge | Physical Geography | UPSC

Mid ocean ridge image description UPSC

Mid ocean ridge image description UPSC

All about Mid-Ocean Ridge | Physical Geography | UPSC

The study of ocean floor has been made through various underwater expeditions and explorations. These underwater explorations have shown very contrasting and spectacular features inside the seas and oceans. When there is a Tsunami, everyone will say that it is due to the origin of earthquake below the sea floors. It is also a fact that the Earth’s tectonic processes are happening along the plate boundaries. These boundaries are very distinct lithological portions existing below the seas and oceans. The modern ocean floor maps have provided enormous opportunities to understand these underwater features. They also helped us to know the theories behind the earth’s ongoing tectonic processes.

Ocean’s morphological features vary with reference to their site, location, origin, morphology, lithology and dynamics of the water masses.

  • The general profile of oceans include the Continental Shelf, Continental Slope and the Deep Ocean basins. Each one of these have their own variations in spread, depth, slope and hydrodynamics.
  • The life in the marine waters depend on the depth, air-sea interactions, radiation, hydrodynamics, morphology and the physico-chemical conditions of the oceans.
  • The Circulation of ocean waters, as waves and currents, and the interaction of oceans with the atmosphere, have very significant effects on the weather and climate of the entire globe.
  • There are several kinds of distinct and most striking features observed on the ocean bottoms.
  • These underwater relief features are very essential to our human understanding about the earth, oceans, oceanic crusts, tectonic processes and their impacts.

Among them, the Mid Ocean ridges are very unique structures.

The Mid Ocean Ridges, as the name implies, exist mostly in the middle of the ocean basins, where the divergent plate boundaries are located. The theory of Plate Tectonics has indicated many major tectonic processes which also include:

  • the release of convection currents along Divergent Plate Boundaries,
  • the origin of Mid Ocean ridges and
  • the spreading of the sea floor.

All these processes are everlasting phenomena on the Planet Earth.

A basic understanding of the Mid Ocean Ridges is necessary not only for oceanographic point of view, but also for general knowledge point of view.

In this post, the following aspects of the Geological Oceanography are highlighted:

  1. Ocean Relief features
  2. Mid Oceanic Ridges
  3. Formation of Oceanic Ridges
  4. Distribution of Oceanic Ridges
  5. Importance of Ridges.

Major Oceanic Relief features | UPSC – IAS

The painstaking ocean floor mapping Project of Bruce Heezen and Marie Tharp after the Second World War has shown the distinguishing underwater features of the world’s oceans. It is really a thought provoking highly heterogeneous relief system seen below the seas and oceans.

The profile of the oceans has shown innumerable curves, dips, ridges, valleys, mountains, plateaus, trenches, fractures and canyons.

Major and Minor Ocean Relief Features upsc

The following major kinds of features have been observed based on the ocean floor expeditions and explorations made during the last 100 years.

They are: – Oceanic abyssal plains,  Oceanic trenches, Oceanic plateaus, Oceanic fracture zones, Seamounts and Mid ocean ridges

  • An Abyssal Plain is an underwater plain located on the deep ocean floor. It is usually found at depths between 3000 m and 6000 m. These are the flattest, smoothest and least explored regions on the planet earth. Abyssal plains lie generally between the foot of a continental rise and a mid-ocean ridge.
  • Oceanic Trenches are long, narrow topographic depressions of the sea bed. They are the boundary zones of lithospheric plates. An oceanic trench is a type of convergent boundary at which two lithospheric slabs meet. Trenches are generally parallel to the volcanic arcs. Oceanic Trenches extend 3 to 4 km deeper below the level of the surrounding ocean floor. The greatest depth is seen at the Challenger Deep of the Marianas Trench in the northwest Pacific Ocean. It extends upto a depth of 10911 m below the sea level. There are about 30 notable trenches existing in different oceans of the globe.
  • An Oceanic Plateau is a large relatively flat region under the marine waters. They rise well above the average level of the seabed. There are about 16 oceanic plateaus existing in different regions of the oceans.
  • A seamount is an underwater mountain rising from the ocean floor. It does not reach the water surface. Hence, it is not an island. Some of them are formed from extinct volcanoes. A seamount rises from 1000 m to 4000 m depth of water. There are about 100,000 seamounts existing across the globe.
  • Submarine Canyons are long narrow and deep valleys cutting across the continental shelves and slopes. The depth of these Canyons may range from 600m to 3000m.

Among these, the Mid Oceanic Ridges are the most remarkable features existing along the Divergent plate boundaries. These are underwater mountain chains. They are not similar to the mountains of continents. The Mid Oceanic ridges cover about 23% of the earth’s surface. Their origin, extent and distribution are essential aspects to be studied in oceanography and physical geography.

Mid-ocean ridge | UPSC – IAS

One of the most striking features of the ocean floor is the distribution of mid oceanic ridges. These ridges are mountain-like structures standing well above the deep ocean floors. The mid oceanic ridges are, in total, 65,000 km long and cover almost 23% of the earth’s surface. These are considered as the world’s largest mountain ranges existing below marine waters. They exist as chains, in the centre of the oceanic basins. These are rugged features. They stand 1 to 3 km above the deep ocean floors. The most prominent feature of a ridge is its steep-sided central valley called rift valley. A rift valley may be 25 to 50 km wide and 1 to 2 km deep in its profile. The rift valley of a mid oceanic ridge is bordered by rugged mountains with the tallest peaks. These peaks may rise upto 2 km above the sea surface also as seen in some locations. Upwelling of molten mantle rock has created these rift zones.

Mid oceanic Features - Oceanic abyssal plains, Oceanic trenches ,Oceanic plateaus, Oceanic fracture zones, Seamounts and Mid ocean ridges upsc

The mid oceanic ridges are formed along the boundary between two divergent tectonic plates. These zones are tectonically active regions. Hence, small earthquakes occur frequently on crests of mid ocean ridges. These earthquakes coincide with the location of the central rift valleys. They are the most active volcanic regions on the earth.

At the mid oceanic ridges, two plates move away from each other. This process is called as sea-floor spreading and it creates a new seafloor. Ocean basins were formed through such breakup of continents and movement of plates. Thick continental crust was subjected to heat flow from earth’s interior. When the warm mantle expands, the continental crust is domed and stretched away from each other thereby forming the rift valleys. Some form of thermal convection within the asthenosphere appears to create

  • New lithosphere at the oceanic ridges and rises. This simultaneously made the old lithosphere back into the mantle to be subducted beneath oceanic trench systems.
  • The spreading rates of mid ocean ridges may be 2-3 cm per year. A mid ocean ridge has a steeper and more irregular topography as a result of a low spreading rate. The ridge consists of a high central axial zone, with a narrow crest.
  • The mid ocean ridges and rises are offset by rugged fault scars called fracture zones. These linear bands of mountains and troughs intersect all oceanic ridges at intervals in right angles.
  • The system of mid-ocean ridges ranks with the continents and ocean basins as one of the three main units exposed at the earth’s surface. They are – the topography, structure, areal extent and geological importance.
  • The Mid-Atlantic ridge is the best known example in the world.
  • It is 40,000 miles long encircling the whole world.
  • The mid-Atlantic Ridge is centrally located between the eastern and western margins of the Atlantic Ocean. It is also about 2000 km wide.
  • It is elongated in a general North-South direction and follows a sinuous course roughly parallel to the present coastlines. With reference to areal extent, it is one-third of the entire Atlantic ocean.

Formation of Oceanic ridges | UPSC – IAS

Mid ocean ridges are characteristic of sea floor spreading processes. These are very active zones wherein a new magma is expected to emerge on the ocean floor regularly. There are two processes responsible for the ocean floor spreading

  • Mechanism – One is ridge-push and slab-pull process. Ridge-push occurs when the ridge pushes the tectonic plate away from the ridge, often towards the subduction zone. At the subduction zone, slab -pull come into effect. The other process is the mantle conveyor mechanism.

Mid oceanic ridges form new oceanic crusts.

Convection currents from the mantle moves up as magma and leaves through weak zones as volcanic eruptions creating new crust upon cooling. These are called as mid ocean ridge basalts. The rocks making up the crust below the seafloor are youngest at the axis of the ridge. Most oceanic crust in the ocean basins is less than 200 million years old. The crust is in a state of constant renewal at the ocean ridges .

formation of oceanic ridges upsc

Moving away from the ridges, the depth of the ocean increases progressively. The greatest depths are in the ocean trenches.

Alfred Wegener while proposing the old theory of continental drift in 1912, specified that mid oceanic ridges are continuously tearing open the ocean floors and make the magma to erupt from the deep interior. Later the theory of Plate Tectonics provided a better understanding of the movements of plates, spreading of ocean floors, underwater volcanic eruptions and formation of mid oceanic ridges.

It is also found that 20 volcanic eruptions occur every year along the se mid oceanic ridges. It is also seen that every year about 2.5 sq.km of new sea floor is formed by this process. With a crustal thickness of 1 to 2 km, this amounts to about 4 Cu .Km of new oceanic crust formed every year.

Distribution of Mid-Ocean Ridges in the World | UPSC – IAS

Mid oceanic Ridges are distributed in almost all major oceans of the world. They range from the longest mid Atlantic Ridge of one ocean floor to a small ridge of another ocean.

Map of Distribution of mid oceanic ridge in the world

The Atlantic Ocean has the following notable ridges.

  • The Mid Atlantic Ridge is a world famous ridge. It is the longest one in the world. It divides the Atlantic in the middle along the plate boundary. Its alignment is broken near the equator. It starts from Iceland in the north and ends near the Rouvet Island near the Antarctica. The Mid Atlantic Ridge is exactly following the boundary of coastlines and continental margins on both sides of the ocean. It is flanked by many ocean basins.
  • The Reykjanes Ridge – The Reykjanes Ridge exists in the Reykjanes Basin near Iceland as the starting point of Mid Atlantic Ridge. Its continuity has been broken by a fracture zone.
  • The Madeira Ridge is a small oceanic ridge located near Madeira, west of Morocco.
  • The Atlantic Indian Ridge – The Atlantic Indian Ridge is existing at the Southern end of Mid Atlantic Ridge. It is about 2000 km long. It is located along the northern boundary of the Atlantic – Indian Basin.
  • The South Scotia Ridge – The South Scotia Ridge is located near the southern tip of south America in the Scotia Sea.
  • The Zapiola Ridge – The Zapiola Ridge is a small ridge in the Argentine Basin east of Argentina.
  • The America – Antarctica Ridge. The America – Antarctica Ridge is located in the Southern Ocean, North of Antarctica. It has a North East – South West alignment. It is 1500 km long.
  • The Astrid Ridge – The Astrid Ridge is a small ridge located in the Lazarev sea of Antarctica. It is at the southern part of Atlantic-Indian Basin.
  • The Parnaiba Ridge – The Parnaiba Ridge is a minor ridge located near the equator in the west Atlantic and east of Amazon delta.
  • Belem Ridge is yet another one in the Atlantic Ocean.
  • The Ceard Ridge –The Ceard Ridge is located in the western end of Atlantic Ocean near the equator.
  • The Barracuda Ridge -The Barracuda Ridge is located North of Barbados.
  • The Blake Bahama Ridge – The Blake Bahama Ridge is located closer to Bahamas in the West Atlantic.
  • The Eirik Ridge – The Eirik Ridge is a minor oceanic ridge located in the North Atlantic existing near the south of Greenland.
  • The West Scotia Ridge – The West Scotia Ridge is located in the western parts of Scotia Sea.
  • The Newfoundland Ridge – The Newfoundland Ridge is located in the north west Atlantic ocean near Newfoundland.
  • The Walvis Ridge –The Walvis Ridge is located in the Southern Atlantic west of Namibia of South Africa.
  • The Hatton Ridge – The Hatton Ridge is parallel to Reykjanes Ridge in the Iceland Basin.

The Pacific ocean has the following notable ridges:

  • Gorda Ridges are located west of north America near Cascade mountain ranges.
  • Kyushu – Palau Ridge is located in the middle of Philippine Sea.
  • South Honshu Ridge
  • West Norfolk Ridge and Norfolk Ridge are located near the Norfolk Island of Australia.
  • Kermadec Ridge is located along the western parts of Southwest Pacific basin.
  • Robbie Ridge is located to the southwest of Phoenix islands. It is a north-south trending ridge. It is parallel to the Kermadec trench.
  • Hawaiian Ridge is located Northwest of Hawaii.
  • Christmas Ridge and Necker Ridge are in the Central Pacific basin southwest of Hawaii.
  • Tehuantepec Ridge is located in the Guatemala Basin South of Salina Cruz.
  • Colon Ridge exists in southern parts of Guatemala Basin between north and south America in the east pacific.
  • Pacific Antarctic Ridge is in the middle of the Southern ocean. It is an east-west trending ridge.
  • Nazca Ridge is located west of South America near Peru-Chile trench.
  • Society Ridge and Tuamotu Ridge are in the middle of the Pacific ocean near Society islands. It is in the southern Hemisphere.
  • Macquarie Ridge is along the boundary between Southern Ocean and the Tasman Sea and South of New Zealand.
  • Caroline Ridge is located near the Challenger Deep of Marianas Trench.
  • Galapagos Ridge is located west of South America near Andes.

The Ridges of Indian Ocean are the following:

  • Ninety East Ridge. It is a north-south trending ridge located in the middle of Cocos Basin and Mid-Indian Basin. It starts from the Andaman Sea in the North and extends upto the Broken Ridge in the South. It runs parallel to the longitude 90 degrees E.
  • Investigator Ridge is located in the southeastern parts of Cocos basin and east of Cocos islands.
  • Chain Ridge is located northeast of Somali Basin and North of Seychelles.
  • Amirantle Ridge is near the Seychelles, south of Somali basin.
  • Davie Ridge is located in the Mozambique Channel between Mozambique and Madagascar.
  • Murray Ridge is in the Arabian Sea, east of Oman.
  • Carlsberg Ridge is located south of Arabian Sea and northeast of Somali basin.
  • Sheba Ridge is located in the Gulf of Aden extending from the red Sea.
  • Atlantic Indian Ridge is in the south of Africa in the Atlantic-Indian basin.
  • Southwest Indian Ridge is located in the southwest parts of Indian ocean. It is trending along NE-SW direction.
  • Mid Indian Ridge is a Northwest to Southeast trending ridge in the middle of Indian Ocean.
  • Broken Ridge is an east-west trending ridge located to the west of Perth basin.
  • Southeast Indian Ridge is an east-west trending ridge located in the southeast parts of Indian Ocean.
  • Hartog Ridge is in the western parts of Perth basin west of Australia.
  • East Indiaman Ridge is near the Broken Ridge west of the Perth Basin.

Significance of Oceanic Ridge | UPSC – IAS

The alignments of the ridges have some common trends. The ridges are structurally displaced due to transform faults. Their alignments are cut across by a series of transform faults. The horizontal displacement along these zones bring more opportunities to expose the crustal weaknesses. The length of volcanic vents or pipes may be shortened and due to this more convection currents may emanate rapidly. Due to this, the rising of magma could be more easy.

  • When there is subduction along the convergent boundaries, we get ocean trenches. Below the zones of subduction, the materials get crushed and may be melted. This zone of crushing is known as benioff zone. The scientists believe that the volcanic island arcs are formed from magmas produced by the partial melting of the descending and/or the overriding plate. Considerable volcanic activity worldwide is the result of subduction.
  • Benioff is the zone which normally creates the focus for earthquakes and subsequently generate tsunamis from the oceans. Ocean ridges are the spreading centers. The ocean floor is mountainous and uneven, much like Earth’s surface.
  • Sea-floor spreading is driven by the crust formation along these mid-ocean ridges. They are like meandering undersea mountain ranges. They span on the Earth like the seams of a baseball. Oceanic crust is continually produced by magma welling up along the centerlines of the mid-ocean ridges. This new crust flows away from the ridgeline in two symmetric sheets, one on each side. The rate of sea-floor spreading resulting from this process is from 1–20 cm/yr, depending on the particular mid-ocean ridge.
  • Oceanography is one of the interesting subjects of earth sciences. Studying the underwater features are challenging tasks. The processes behind these features are challenging us though we are far away from them. Let us see the other important ones in the forthcoming modules.

FAQs about Oceanic floor and Mid – Oceanic Ridge

What are the features of continental shelf?

  • Continental shelf is the broad, relatively shallow submarine platform that forms a border to a continent. It extends from the coast to depths of 100 – 200 m. Continental shelves average about 65 km in width. They exists almost everywhere. They are simply a continuation of the continental landmass. Continental shelves are usually covered with a layer of sand, silts, and silty muds. Their surfaces feature small hills and ridges that alternate with shallow depressions and valley-like troughs. In a few cases, steep-walled V-shaped submarine canyons cut deeply into both the shelf and the slope below.

what is continental shelf upsc

What are abyssal plains?

  • An Abyssal Plain is an underwater plain located on the deep ocean floor. It is usually found at depths between 3000 m and 6000 m. These are the flattest, smoothest and least explored regions on the planet earth. Abyssal plains lie generally between the foot of a continental rise and a mid-ocean ridge.
  • The abyssal plains lying at depths of 5000- 6000 m are nearly flat. This is mainly due to sedimentation. They are found mostly in the Atlantic and are absent in the eastern Indian and most of the Pacific ocean floors. If there are no plains, then there may be oceanic trenches. Trenches are long narrow depressions in the ocean floor. They reach a depth of about 7000m to 11000 m below sea level. they occupy 1% of the surface of the earth

abyssal plains upsc

What is meant by a continental rise?

  • A continental rise is merely a general region where the floor of the deep ocean basin rises to a greater and steeper slope. At the base of continental slope, the topographic gradient decreases to 1° (or) less and the ocean enters into the abyssal plains or hills.
  • This portion of the sea floor is known as continental rise. This is a product of deposition by turbidity current, underwater landslides and many other processes. The lower portion of continental slopes normally grade into the continental rise. They do not have any sharply defined boundaries.

What are mid-ocean ridges?

  • One of the most striking features of the ocean floor is the distribution of mid oceanic ridges. These ridges are mountain-like structures standing well above the deep ocean floors. The mid oceanic ridges are, in total, 65,000 km long and cover almost 23% of the earth’s surface.
  • These are considered as the world’s largest mountain ranges existing below marine waters. They exist as chains, in the centre of the oceanic basins. These are rugged features. They stand 1 to 3 km above the deep ocean floors.
  • The mid-ocean ridges and rises are formed in zones of tension where plates diverge. The mountains of ocean ridges are not similar to the mountains of continents. The ocean
  • ridges are composed entirely of basalts and are not deformed by any folding. The ridges are of two types as active spreading centre ridge and rise and inactive, aseismic ridge. The active spreading ridges are about 1000 km wide and 1 to 2 km high. Oceanic ridges are traversed by series of fractures with steep sides running perpendicular to ridges (or) rises.

What are oceanic trenches?

  • Oceans have three more important features like Oceanic Trenches, Plains, and Ridges. The deepest part of the oceans have shown V-shaped trenches running for thousands of kilometers in length with a width of hundreds of kilometers and extend upto a depth of 3 to 4 km.
  • There are numerous Ocean Trenches inside the water masses, beyond continental rise. The greatest depths of oceans can be seen only in the form of ocean trenches. These are steep sided, long narrow and hollow portions. They may be 300-500 km in length and 30-100 km wide with a depth of 6 km.
  • Initially, their sides slope at 4 to 8° and then goes upto 16° to depths more than 10 km. For those parts of a depression which exceed 6000 m in depth, the term Ocean deep is used. Ocean trenches are formed due to subduction of the oceanic crust. The faults which transect these ridges are called as Transform faults.

oceanic trenches and volcanic arc

What are island arcs?

  • Island arcs are curved chain of volcanic islands. They are generally convex towards the open sea. Due to this nature, they are called as Arcs. There are hundred and thousands of extinct volcanoes in the ocean floors.
  • These regions are seismically active zones. Island arcs are topographically and structurally continuous features. These are formed when two oceanic plates converge and collide. The melting of the descending plate rises upwards as an extended magma, to form the islands. Most of these eruptions are unnoticed.

What are seamounts?

  • Seamounts and Guyots are some more unique features of the ocean basins. Seamounts are isolated steep sided submarine volcanic mounts. The base of the seamount is on the seafloor and its summit doesn’t reach the water surface (if it did, it would be an island). There are thousands of seamounts located throughout the world’s oceans.
  • They may be 2-100 km wide and < 1 km high above the sea floor. Very rarely, they rise above the sea level as seen in Hawaii islands. Seamounts are made by extrusion of lavas piped upward in stages. Seamounts provide evidences and data on the movements of tectonic plates on which they ride.
  • The trend of a seamount chain traces the direction of motion of the lithospheric plate over a more or less fixed heat source in the underlying asthenosphere part of the Earth’s mantle.

Seamounts and guyots upsc

What are Guyots?

  • Guyots are flat-topped seamounts. Guyot is a truncated seafloor volcano occurring as a flat-topped mountain which does not reach the sea surface. Guyots are thought to be associated with hot spots.
  • The flat-top is created due to wave action. They are named after the Swiss-American geographer and geologist Arnold Henry Guyot.
  • A guyot is also known as a tablemount. It occurs as a flat top mountain over 200 meters below the surface of the sea. The diameters of these flat summits can exceed 10 km. Guyots are most commonly found in the Pacific Ocean. Their flatness is due to erosion by waves, winds, and atmospheric processes. The steepness gradient of most guyots is about 20 degrees.

What are submarine canyons?

  • As the name implies Submarine Canyons are deep narrow valleys of the continents extending inside the oceans. A submarine canyon is a steep-sided valley on the sea floor of the continental slope. Many submarine canyons are found as extensions to large rivers; however there are some that have no such association. Canyons cutting the continental slopes have been found at depths greater than 2 km below sea level.
  • They are formed by powerful turbidity currents, volcanic and earthquake activity. Many submarine canyons continue as submarine channels across continental rise areas and may extend for hundreds of kilometers. Submarine canyons serve as major conduits for transporting sediment from land and the shelf to the deep-sea floor.
  • Undersea canyons are prominent erosional features along both the U.S. Pacific and Atlantic continental margins. Similarly, the distinction between submarine canyons and submarine erosional channels is not straightforward. Thus, alternative terms, such as gullies, channels, troughs, trenches, fault valleys, and sea valleys, have been used for submarine canyons.
  • A submarine canyon may begin as a river pours into the ocean, eroding a channel in the shallow continental shelf. But much of the carving may be done by torrents of muddy water stirred up by storms, earthquakes, or other big events.

What are the characteristics of Mid-Atlantic Ridge?

  • The Mid Atlantic Ridge is a world famous ridge. It is the longest one in the world. It divides the Atlantic in the middle along the plate boundary. Its alignment is broken near the equator. It starts from Iceland in the north and ends near the Rouvet Island near the Antarctica.
  • The Mid Atlantic Ridge is exactly following the boundary of coastlines and continental margins on both sides of the ocean. It is flanked by many ocean basins. The Reykjanes Ridge exists in the Reykjanes Basin near Iceland as the starting point of Mid Atlantic Ridge. Its continuity has been broken by a fracture zone.

What is meant by Seafloor spreading?

  • Seafloor spreading is a process that occurs at mid-ocean ridges, where new oceanic crust is formed through volcanic activity and then gradually moves away from the ridge. Seafloor spreading helps explain continental drift in the theory of plate tectonics. At the mid oceanic ridges, two plates move away from each other. This process is called as sea-floor spreading and it creates a new sea floor.
  • Ocean basins were formed through such breakup of continents and movement of plates. Thick continental crust was subjected to heat flow from earth’s interior. When the warm mantle expands, the continental crust is domed and stretched away from each other thereby forming the rift valleys.
  • Some form of thermal convection within the asthenosphere appears to create new lithosphere at the oceanic ridges and rises. This simultaneously made the old lithosphere back into the mantle to be subducted beneath oceanic trench systems.

Seafloor Spreading Theory Theory of Plate Tectonics and Seafloor Spreading Evidence UPSC - IAS Quizlet

What are rift valleys?

  • A rift valley is a long valley formed along a rift in the earth’s crust due to the gradual sinking of land between two parallel series of faults.
  • A rift valley may be 25 to 50 km wide and 1 to 2 km deep in its profile. The rift valley of a mid oceanic ridge is bordered by rugged mountains with the tallest peaks. These peaks may raise upto 2 km above the sea surface also as seen in some locations. Upwelling of molten mantle rock has created these rift zones.

Distribution of Salinity, Density and Temperature of Sea Water | UPSC

salinity describe the general distribution of salinity in the oceans UPSC IAS factors affecting salinity of ocean water

salinity describe the general distribution of salinity in the oceans UPSC IAS factors affecting salinity of ocean water

Distribution of Salinity, Density and Temperature of Sea Water | UPSC

The world ocean meaning the combined oceans of the earth, occupying about 71% of the earth’s surface & has a mean depth of about 3800m including shallow seas in addition to the main basins. The round figure of 4000m applies quite well to the average depth of the main portions of the Atlantic, Pacific 7 Indian Oceans. Volume of the world ocean is about 1.4 billion cubic kilometers (1.37×10 to the power of 9 cu km) which constitutes 97.2 % of the world’s free water most of the remaining 2.8% is locked up in glaciers.

Physio-chemical characteristics of seawater

Physical characteristics of sea water-

  • Water is the sole natural compound which exists in 3 statuses in the conditions of temperature & pressure which are found on earth. The liquid state being the most common.
  • Water has high specific heat, linked on the one hand, to the fact that one its constituents hydrogen has the highest specific heat of all the elements & on the other hand to the presence of hydrogen bonds.
  • The freezing of water is accompanied by an increase in volume of about 105 & because of this ice floats on water, freezing splits the partitions of cells in animal or plant & porous.
  • The surface tension of water is the highest of all liquids. This characteristic influences the formation of drops of water as well as waves.
  • The surface water in a liquid state reflects only a small part of luminous radiation & absorbs much solar heat.
  • The transmission of light is unaffected by salinity temperature or pressure. However suspended particle may scatter the light. Is more penetrating & they are subjected to molecular scattering & hence the blue color of the ocean. Different colors of the ocean like green or brownish particularly along coast due to green planktonic species & due to detritus suspended the water.
  • Sound waves propagation is easily affected by factors like salinity, temperature or pressure. The speed of waves increases with increase in salinity, temperature or pressure.

The chemical composition of sea-water

Ocean water contains variety of substances dissolved in water & as suspended particles. The composition of sea water vary from place to place 7 is primarily depends on the abundance of life forms, presence of rivers & other geological & meteorological conditions. Thus different substances are dissolved in sea water. The dissolved substances of seawater is therefore can be into 2 categories namely

Dissolved gases in sea-water

  • The major gases found in sea water in the order of their relative abundances are Nitrogen, Oxygen & Carbon dioxide. Apart from these the presence of hydrogen sulphide gas is significant as it indicate bacterial activity, decay of organic material & stagnation of water.

The mineral constituents of water

  • The sea contains a large number of dissolved compounds & elements. The seawater contains about 10 major elements & at least about 49 minor & trace elements.

The ten major elements of the sea water & their concentrations are listed below.

Elements Cl Na Mg S Ca K Br C Sr B
% 19.35 10.79 1.29 0.88 0.41 0.38 0.06 0.03 0.01 0.005

Most of the dissolved elements in the sea are found in ionic form constituting ionic sea salts. Majority of ionic sea salts result from the following compounds.

Sodium chloride‐NaCl, Magnesium Chloride‐MgCl2, Potassium Sulphate‐MgSO4, Calcium Sulphate‐ CaSO4, Potassium Sulphate‐K2SO4, Magnesium bromide‐MgBr2, & Potassium Chloride‐KCl.

The ocean is a dimensional body & so the distribution of physical properties like salinity, temperature 7 density is represented in a space by the help of coordinates of latitudes & longitudes with the additional factor of depth.

Salinity of Ocean water:

  • Salinity is the total amount of solid material in a kilogram of sea water expressed in parts per thousand. The average salinity of seawater is 3.5% 7 is generally expressed as 35 parts per thousands.

The list of salts & there weight & percentage is given in the table.

Salts Weight (g) %
Sodium Chloride 27.213 77.8
Magnesium Chloride 3.809 10.9
Magnesium Sulphate 1.658 4.7
Calcium Sulphate 1.260 3.6
Potassium Sulphate 0.863 2.5
Calcium Carbonate 0.123 0.3
Magnesium Bromide 0.076 0.2

Change in salinity distribution

  • Salinity changes due to winds resulting from differing in atmospheric pressure. The strong wind blowing throughout the year carry much of the warm & saline water from the western shore of the land in the
  • lower middle latitudes & from the eastern shore in the higher latitudes resulting in changes in salinity distribution. The variations in salinity are according to the nature of the atmosphere i.e. the difference between precipitation 7 evaporation.

Distribution of Sea water | UPSC – IAS

Horizontal distribution

  • Salinity is primarily controlled by latitude, & consequently decreases from the equator towards the pole. It is not maximum at the equator due to excess of rain over evaporation but the region of 20‐40 degree N records the highest average salinity of 36 % as a result of higher evaporation. In the southern hemisphere between 10‐30 degree S, 36% salinity is found. After obtaining maximum in the lower middle latitude, it again decreases between 40‐60 degree N & S & is 31% in northern hemisphere & 33% in southern hemisphere. Still lesser salinity is found in the polar areas due to the melting of ice. However, for the whole of northern hemisphere the average salinity observed is 34% 7 in southern hemisphere it is 35%. The different in these 2 is attributed to the abundance of ocean water in the Southern Hemisphere.

Vertical Distribution

  • Salinity in the ocean decreases or increases in bottom according to the nature of the water mass. Those who attribute salinity to the atmospheric reaction conclude that due to the greater depth & less radius of influence of the greater depth & less radius of influence of the atmosphere salinity decreases at the bottom. This variation in salinity shows large difference with the latitude unless there is an occurrence of some cold or warm water mass which may result in drastic changes. At the southern boundary of the Atlantic salinity is 33.0, but; at 200 fathoms it reaches up to 34% increases to 34.50 still deeper at the bottom. Just at the equator the surface salinity of 34% increases with the depth to 35% due to greater mixture of fresh water at the surface.
  • The saltiest water occurs in the Red Sea & the Persian Gulf where rates of evaporation are very high of the major oceans the North Atlantic is the saltiest its salinity averages about 37.9%.
  • Generally it can be said that in high latitude salinity increases with depth due to dense water found at the bottom. Whereas in the middle latitude salinity increases with the depth up to 200 bottoms & then it starts decreasing. At equator due to a mixture of fresh water by rainfall surface salinity is low; just below this greater salinity is found which again decreases at the bottom due to the presence of cold water.

Density of Ocean water | UPSC – IAS

  • The density of any substances is the mass per unit volume stated in grams per cubic centimeter. Commonly the word density is used for specific gravity which is the ratio of the density to that of distilled water at a given temperature & under atmospheric pressure.
  • Pure water has maximum density of one unit at temperature 4 degree Celsius, whereas for the sea it changes according to the salinity content.
  • Density of pure water depends upon temperature & pressure only.
  • Whereas that of sea water depends upon temperature, pressure 7 salinity.
  • This diagram shows the role of salinity on changes in density & freezing point.
  • From the figure clear that pure clear that pure water freezes at 0 degree Celsius & has maximum density at 4 degree Celsius. The freezing point of ocean water decreases with increasing salinity so also the temperature of maximum density of.

Distribution of density of sea water | UPSC – IAS

  • In general there is a latitudinal difference in the density distribution, depending on the character of the water changing from equator to the poles. The density of the upper layer commonly increases from the tropics towards the poles.
  • The nature of the comparatively dense water in to sink down below the lighter water when 2 water masses having different density more dense water sinks down & then spreads out from the place where the similar density is found. It is observed that in the middle latitude, denser water sinks at lesser depths than the water that sinks at convergence in higher latitudes.

Vertical Distribution

The vertical distribution of density would reveal that generally at surface water of low density are found which increase in density towards the bottom. It is so because any amount of water which finds itself among less dense water would sink automatically below the surface up to that depth where water of similar density is found. Hence at places of convergences dense water mass sinks below the lighter one & forms bottom water. Nevertheless contrary to the surface current from the equator towards the pole there is bottom 7 this brings denser water under the surface of the sea.

Temperature of Ocean water | UPSC – IAS

  • The study of temperatures of oceans is the subject matter of massive meteorology which deals with that portion of the atmosphere which overspreads the great water masses.
  • The temperature of the sea & its accurate measurements has been one of the chief tasks of oceanographs, as it helps in the determination of the movements of large masses of ocean water.

There are various process of heating the ocean water

  1. By absorption of radiation from the sun
  2. Convection of heat through the ocean bottom from the interior of the earth.
  3. Transformation of kinetic energy into heat.
  4. Heating due to chemical processes.
  5. Convection of sensible heat from the atmosphere
  6. And condensations of water vapour.

Distribution of Temperature

The temperature & its distribution are determined by the following factors.

  1. The intensity & daily duration of solar radiated energy received.
  2. The depletion of this energy in this atmosphere by reflection, scattering & absorption.
  3. The albedo of the surface & its changes according to the angle of rays.
  4. Heat balance.
  5. Heat transfer through evaporation condensation.
  6. Important physical characteristics of the surface.

Ex – If the salinity of the ocean is greater the boiling point is raised & hence the temperature is high. Similarly if the density is lower than the temperature would be higher vice versa. But a combination of high temperature the amount of evaporation also determines the temperature.

Surface temperature of Ocean water | UPSC – IAS

A number of features which regard to the surface temperature of the ocean in relation to the latitudes are clearly brought out when we study the data given in the table below. The temperature decreases with the increasing distance from the equator. The decrease is about ½ per latitude though in actual observation it is slightly different. As a general rule the temperature decreases as the latitude increases but in all the oceans the higher values of the surface temperature are found to the north of equator.

North Atlantic Indian Pacific Southern Atlantic Indian Pacific
latitude Ocean Ocean Ocean latitude in Ocean Ocean Ocean
in degree degree
70 60‐ 5.60 70 – 60 ‐1.30 ‐1.50 ‐1`.30
60 50‐ 8.66 5.74 60 – 50 1.76 1.63 5.00
50 40‐ 13.16 9.99 50 – 40 8.68 8.67 11.16
40 30‐ 20.40 18.62 40 – 30 16.90 17.00 16.98
30 20‐ 24.16 26.14 23.38 30 – 20 21.20 22.53 21.53
10 0‐ 25.81 27.23 26.42 20 – 10 23.16 25.85 25.11
26.66 27.85 27.20 10  0‐ 25.18 27.41 26.01

Average surface temperature of the oceans between parallels of latitudes [temperature in degree centigrade].

Temperature beneath the surface

The sun rays have no direct effect below 600 feet & in spite of movement of water a vast bulk of sea is relatively cold. In general the complete stratification may appear in sea as lighter water of high salinity is found above the dense cold bottom water.

The following facts are marked as the characteristics of the vertical distribution of temperature of the sea.

  • Firstly in spite of a general decrease of temperature towards the bottom the rate of fall is not equal at all depths up to 2000m the fall is rapid whereas it is almost stagnant below it.
  • Secondly the surface temperature decreases with the increasing latitudes. Whereas the bottom temperature remains almost the same thus the rate of fall at equator is greater than at poles.
  • The surface temperature & its decrease may be found to be influenced by the factor of upwelling of bottom water.
  • In equatorial region an almost reversal of average conditions is found. At the surface the temperature & salinity is slightly lower due to abundant rainfall but just below it a layer exhibits high temperature & high salinity. Further at greater depth the usual decrease is found.
  • Higher temperature is found at the bottom is due to insulation, anticyclonic circulation of currents around it & lesser mixing of cold waters.

Conclusion | UPSC – IAS

  • In ocean the distribution of physical properties like salinity, density & temperature is represented with the help of coordinates of latitudes & longitudes with the additional factor of depths.
  • Variations in salinity are according to the atmosphere i.e. the difference between precipitation and evaporation.
  • Density of seawater depends upon the temperature, pressure and salinity.
  • If the salinity is greater than the boiling point is raised & hence the temperature is high & also combination of high salinity & high density also produces high temperature.
  • Temperature, density & salinity of sea water are inter‐related with each other.

Thunderstorms and Tornadoes | UPSC – IAS

Thunderstorms and Tornadoes | UPSC - IAS

Thunderstorms and Tornadoes | UPSC - IAS

Thunderstorms and Tornadoes | UPSC – IAS

Thunder and tornadoes are the violent storms represent external events and atmospheric hazards. They discharge large amount of energy in an extremely short time. Tornadoes are the most violent of all such storms and wreak great havoc. They are too small in horizontal extent and hardly appear in weather charts. Because of the destruction and death they leave, they have always been an important subject for investigation.

  • The most amazing feature of these storms is the fact that they are too small and short lives as to make their prediction very difficult. They strike with lightning speed so that within few minutes they destroy buildings and damage standing crops, make human life miserable.
  • Thunderstorms have been defined as “storms produced by cumulonimbus clouds and always accompanied by lightning and thunder, followed by heavy rain and sometimes hail.”

Origin and structure of Thunderstorms | UPSC – IAS

  • Thunderstorms originate from cumulonimbus clouds. According to Trewartha thunderstorms is like a thermodynamic machine in which the potential energy of the latent heat of indentation is rapidly converted in to the kinetic energy of ascending air currents. Thunderstorms represent the weather phenomenon which combines strong wind, thunder, lightning and torrential rains.
  • The vertical extent of a thunderstorm depends on the intensity of ascending air currents. The height of thunderstorms ranges from 4 to 20 kms. Besides there is a marked seasonal and latitudinal variation in the heights usually thunderstorms develop in summer in tropical and the middle latitude regions due to the adequate supplies of moisture.
  • Thunderstorms form when moist, unstable air is lifted vertically into the atmosphere, lifting of this air results in condensation and the release of latent heat. Immediately after lifting begins, the rising warm moist air begins to cool because of the adiabatic expansion. At certain height the dew point is reached resulting in condensation and formation of a cumulus cloud. The cumulus clouds grow into cumulonimbus cloud. When these clouds reaches a height of 20 kms, they create thunder, lightning, intense rain and tornadoes.

Two types of thunderstorms are common

  • Air mass thunderstorms of the mid latitudes in summer and at the equator all year along
  • Thunderstorms associated with mid latitude cyclones

life Cycle of Thunderstorms | UPSC – IAS

Air mass thunderstorms normally develop in the late afternoon. The life cycle of these thunderstorms have three stages: 1) Cumulus stage, 2) Mature stage 3) Dissipating stage.

  • Cumulus stage: In this stage, the parcel of humid warm air rises and cools to form cumulus clouds. When the updraft reaches maximum altitude of 12 to 14 kms, they change their direction 1800 and become downdrafts
  • Mature stage: With the downdrafts, precipitation begins to form and becomes cumulonimbus cloud. In this stage the thunderstorms is several kms in diameter. The mature air mass thunderstorm creates heavy rain, thunder and lightning.
  • Dissipating stage: In this stage the thunderstorms begins to decrease in intensity and the convective storms move downward. Within 1 hour the storm is finished and precipitation has stopped.

Distribution:

In the N & S hemisphere from latitude 600 pole ward the frequency of thunderstorms is least. They are most frequent in humid regions of the tropics. According in Blair, in Panama, Java and equatorial Africa, the average number of thunderstorms is about 200 per year. The rocky mountain regions of US will have a maximum of 73 thunderstorms per year.

About Tornadoes | UPSC – IAS

A tornado is a dark funnel-shaped cloud made up of violently rotating winds that can reach the speeds of up to 450 kms per hour. The diameter of a tornado can vary between few meters and a kilometer, and its track can extend from less than a kilometer to several hundred kilometers. Tornadoes generally travel in a northeast direction (depending on the prevailing winds) at speeds ranging from 40-100 kms per hour.

  • A Tornado is a vortex of rapidly moving air associated with severe thunderstorms. Winds within the tornado tunnel may exceed 900 kms per hr. High velocity of winds cause most of the damage associated with these weather events. The air pressure at the tornado center is approximately 800 mbs. The destructive path of the tornado is usually about half a km wide and no more than 25 kms long. The velocity of the tornado is measured by Fujita ado Intensity Scale also called as F-scale. According to the F scale strong tornado can have a wind speed between 182 and 332 kms per hour. The F4 & F5 [333 to 513 km] tornados are very destructive and violent, but they are very rare.
  • Tornadoes occur in many parts of the world, notably South Africa, Australia, Europe, New Zealand, Northern India, Canada, Argentina and the United States. In US about 40,000 tornadoes have occurred in the last 50 years. Oklahoma receives more tornadoes than any other part of the world.
  • On the other hand tornadoes are dark, funnel-shaped clouds containing violently rotating air that develops below a heavy cumulonimbus cloud mass and extends toward the earth. In comparison with a cyclone, a tornado covers a much smaller area but is much more violent and destructive. The atmospheric conditions required for the formation of a tornado include great thermal instability, high humidity, and the convergence of warm, moist air at low levels with cooler, drier air above.

Tropical Cyclones its Characteristics, Origin and Significance | UPSC- IAS

hurricane structure diagram upsc

hurricane structure diagram

Tropical Cyclones its Characteristics, Origin and Significance | UPSC- IAS

Geographically tropical atmosphere lies between the Tropic of Cancer and the Tropic of Capricorn. But in meteorology, the boundaries of the tropical atmosphere are determined on the high pressure cells of the subtropics. There are various kinds of weather disturbances exist within the tropics. Great deals of variations are observed in weather elements like temperature, precipitation and pressure etc. It is due to the amount of insolation received in the tropics. Ocean currents also contributes a lot to the transfer of heat to the higher latitudes. The rate of exchange of energy between the oceans and sphere is greater in the tropics.

Tropical disturbances are classified in to four categories:

  • Easterly waves
  • Tropical depressions
  • Tropical storms
  • Hurricane and Typhoons

Easterly waves:

  • These are the migratory waves which move from east to west at a lower speed. The source of the occurrence lies between 5°-30° latitudes in both the hemisphere. These waves travel in east to west direction at the rate at 32°-48° kms per day.

Tropical depressions:

  • Petterssen defines the tropical depressions as the center of low pressure around which the wind velocity hardly exceeds 40 km/hr. The depressions can occur anywhere, but they are quite frequent in the vicinity of Inter Tropical Convergence Zone (lTCZ). These depressions never grow in to storms of hurricane intensity; rather they die out as weak disturbances.

Tropical storms:

  • Most favorable atmospheric conditions for their occurrence exist during summer Bay of Bengal and Arabian Sea offer ideal conditions for the origin of these storms. These storms produce heavy precipitation and bring about change in Weather. They are more violent and destructive type of tropical storms.

Tropical cyclones (Hurricane or Typhoons)

  • Hurricane is a severe tropical cyclone having a maximum speed of 119 kms/hr. the name ‘hurricane’ is given to the tropical cyclone in N. Atlantic and eastern N. Pacific Ocean. In the western N. pacific they are known as typhoons. In Australia they call it as Willy-Willy, where as in the Indian Ocean they are called cyclones. In Philippines it is called ‘bagnio’. Japanese call these storms as ‘taifu.’. Elsewhere they are just called as ‘tropical cyclones’.
  • Hurricanes present the most violent, most awesome, and most feared of all the atmospheric disturbances. According to Byers the tropical cyclones differ from the mid latitude cyclones. The tropical cyclones are found at certain seasons in well defined areas it the tropics. They form only over ocean having a high surface temperature (27°c). They to have fronts nor are they associate with moving cyclones. They derive their energy the latent heat of condensations.

vertical structure of tropical cyclone upsc

Characteristics of Tropical Storms | UPSC – IAS

  • The chief characteristics of these violent tropical storms are low pressure at the center d high wind velocity. Tropical hurricanes are nearly circular measuring 500 to 600 kms in diameter. It extends almost 12,000 mts. above MSL. They last for many days, in certain cases more than a week. According to Trewartha, there is a spiralling inflow of air at lower levels, a rapid movement at intermediate levels and a spiraling out wand flow aloft.
  • From the central low pressure core of the cyclone, winds converging from all directions are whirled upward. As a result of the lifting of air, condensation starts producing cumulonimbus clouds.
  • Structure: At the center the pressure is lowest. This is called the hurricane eye. The diameter ranges from 20 to 40 kms. In this central zone the winds are light & variable.
  • The temperature is abnormally high. The hurricane eye is undoubtedly the warmest part of the storms. Heaviest precipitation is also recorded in the vicinity of this region.
  • In a well developed hurricane the movement of the wind in the Northern hemisphere in an anticlockwise and clockwise in the southern hemisphere. The pressure gradients are always steep. The velocity of the wind will be around 120 to 200 kms.hr. They produce large waves on the oceans. Near the core of the hurricane, there is a thick mass of clouds yields heavy rainfall. In extreme cares more than 50 cms of precipitation may accumulate in one place. Rainfall diminishes towards the center where there is no rain at all.

Origin of Tropical Cyclones (Hurricanes) | UPSC – IAS

  • Tropical cyclone is like a heat engine that is energized by the latent heat of condensation.
  • The amount of energy released in a hurricane is estimated to be equal to the total amount of electricity consumed in the US over 6 months period. The energy liberated within a hurricane in one day is almost ten thousand times the daily power consumptions in the entire US. The energy released within a hurricane is equal to about 1,000 bombs of megaton strength.

Movement and tracks of Hurricanes:

  • Hurricanes after their formation usually move towards the west and always from the equator. Their average speed is about 15 to 30 kms/hr. They also move along the trade winds and westerlies. Warm ocean currents also affect the path of cyclones. After reaching the western part of the tropical oceans, the cyclones curve towards the pole. When they –meet westerlies, the hurricane move with a speed of 100 kms/hr. whenever a tropical cyclone moves on land, the severity is reduced due to the absence of moisture. In other words no energy is available on land to maintain a cyclone. Therefore tropical cyclones always originate over oceans than land.
  • On Indian Ocean the movement of the tropical cyclones is different because these storms are influenced by monsoon circulation, and they move in northerly direction along with the monsoon currents.
  • Storms originating over Caribbean Sea regions move westward towards Texas and Mexico. The storms that develop in the western part of the north pacific region move through the Philippines and north and toward China and Japan. In north Atlantic region high frequencies of tropical cyclones are fond in the months of Aug. Sept & Oct. The period from December to May is free from cyclones in the south western north pacific. Greatest frequencies are seen from July to October. There are no cyclones from February to April in these regions. There are no hurricanes in south Atlantic regions due to the fact that the tropical convergence zone remains to the north of the equator so that no weak tropical disturbance develops over this ocean.

Regional Distribution of Tropical Cyclones

There are six regions of tropical cyclones

  • Tropical North Atlantic – West Indies, Gulf of Mexico and Caribbean sea, –
  • Western part of the tropical North Pacific- Philippines, the China Sea and areas around Japan Eastern part of the tropical North pacific- western coastal areas of Mexico and central America The Bay of Bengal and Arabian sea
  • The South Indian oceans – Fiji Islands and east coast of Australia

Environmental Importance of Tropical Cyclones | UPSC – IAS

Tropical cyclones are the most destructive and violent type of storms. Islands and coastal settlements are the targets of there cyclones.

  • Cyclones are associated with high pressure gradients and consequent strong winds, these in term generate storm surge. A storms surge is an abnormal rise of sea level near the cost caused by severe tropical cyclones, as a result sea water enters in to the low lying areas of coastal regions drowning human beings and live stocks, eroding beaches and destroying vegetation. Very strong winds may damage installations, dwellings, communication systems, trees, etc. resulting in loss of life and property. Heavy and prolonged rains may cause river floods, pollute drinking water sources causing outbreak of epidemics.
  • It may be mentioned that all the factors mentioned above occur simultaneously and, therefore, relief operations for distress mitigation become difficult. So it is imperative that advance action is taken for relief measures before the commencement of adverse weather conditions due to cyclones.
  • The most destructive element associated with an intense cyclone is storm surge. Past history indicates that loss of life is significant when surge magnitude is 3 metres or more and catastrophic when 5 meters and above.

Difference between Bhabar, Terai, Bhangar and Khadar | UPSC – IAS

Difference between Bhabar, Terai, Bhangar and Khadar | UPSC - IAS

Difference between Bhabar, Terai, Bhangar and Khadar | UPSC - IAS

Difference between Bhabar, Terai, Bhangar and Khadar |UPSC – IAS

BHABAR:

Bhabar or Bhabhar is a region south of the Lower Himalayas and the Sivalik Hills in Uttarakhand state of India. It is the alluvial apron of sediments washed down from the Sivaliks along the northern edge of the Indo-Gangetic Plain.

  • It lies along the foot of the Shiwaliks from the Indus to the Tista.
  • It is 8 to 16 kms wide.
  • It comprises of pebble- studded rocks in the shape of porus beds.
  • Due to porosity of the rocks, the streams disappear and flow underground.
  • This region is not much suitable for agriculture.
  • It is made up of porous and rocky soils that get made of the debris washed down from the higher ranges.
  • The climate here is subtropical and vegetation is Himalayan subtropical pine forests and Himalayan subtropical broadleaf forests.
  • The Himalayan subtropical pine forests are dominated by Chir trees and Himalayan subtropical broadleaf forests are dominated by the sal tree (Shorea robusta).

TARAI:

Tarai, also spelled Terai, region of northern India and southern Nepal running parallel to the lower ranges of the Himalayas. A strip of undulating former marshland, it stretches from the Yamuna River in the west to the Brahmaputra River in the east.

  • It lies to the south of the Bhabar and run parallel to it.
  • It is 20 to 30 kms wide.
  • It is composed of compara­tively finer alluvium and is covered by forests.
  • The underground streams of the Bhabar re-emerge on the surface and give birth to marshy area.
  • Most parts of the Tarai area are reclaimed for agriculture.
  • The speed of the Himalayan Rivers is slowed down in the Terai region and these rivers deposit fertile silt during the monsoons.

BHANGAR:

Bhangar soils are less fertile as they are above flood level whereas Khadar soils are more fertile as they are below flood level. Bhangar is full of kankers (lime nodules) while khadar soil is composed of fine silt and clay.

  • It is the largest part of Northern plain.
  • It is made up of alluvium.
  • The soil in this region is not renewed frequently, it is old alluvial soil.
  • It is not very fertile.
  • It contains calcareous deposits locally known as ‘Kankar ‘.
  • The Bhangar is the older alluvium along the river beds forming terraces higher than the floodplain.
  • ‘The Barind plains’ in the deltaic region of Bengal and the ‘bhur formations’ in the middle Ganga and Yamuna doab are regional variations of Bhangar.

KHADAR:

New alluvium found on much of the Indo-Gangetic floodplain is called khadar and is extremely fertile and uniform in texture.

  • It is not the largest part of Northern plain.
  • It is made up of new alluvium and fine granules.
  • The soil is frequently renewed due to frequent flooding.
  • It does not contain calcareous deposits of calcium.
  • Suitable for extensive cultivation

About land holding in India | UPSC – IAS

land holding in India | UPSC - IAS

land holding in India | UPSC - IAS

About Land Holding in India | UPSC – IAS

Land is the basic means of production in an agrarian society without which no agricultural production can take place. Two aspects of land that affect the agriculture efficiency are:-

  • Size and distribution of land holdings, and
  • Land tenure system.

Landholding is defined as the area of land which a person or a family owns. It could be one piece of land or a number of small scattered pieces of land. At the time of independence, what prevailed were division, subdivision, and fragmentation of landholdings. In every country, the land tenure system is very important for the development of agriculture. According to the Vera Anstey, “The position of agriculture and agricultural production in any country is dependent, to a large extent, upon the relationship between the land-holding and land ownership in that country.”

Hence this post includes the following aspects:-

  • Land Tenancy
  • Size of Land Holdings and Fragmentation of Fields
  • Consolidation of Land Holdings
  • Ceiling on Land Holdings
  • Land Holdings Distribution in India

Land Tenancy | UPSC – IAS

  • Land Tenancy is an institutional factor which affects agriculture development. Land Tenancy means temporary possession of ownership of land by a tenant. The ownership of agricultural land is determined by the law of Land tenure and Land Tenancy.
  • The main problem in relation of farming in India is the relationship between the landlord, the cultivator and the government. The landlord and the cultivator may be two separate persons, or the same person may own and cultivate the land. The landlord is also related to the government and is responsible for the payment of land revenue. Therefore, the relationship between the landlord, the cultivator, and the government is known as the “Land tenure system” or as the ‘Cultivation Tenure system’.
  • A land or cultivation tenure system refers to the possession of rights for the use of land. There may be many different situations in which the cultivator has rights over the land. At one extreme of such situation is ownership, where the farmer himself is the owner or the landlord. On the other extreme is the landless agricultural labourer. There are many intermediate system between these two, such as cropping tenant cultivators, non tenant cultivators, sub-cultivator, etc.
  • The land tenure system has a major effect on the efficiency of the farmer, and also on the insecurity involved in the cultivation of land. Before the advent of British rule, the land tenure system in India was static. The system implemented by the British also did not encourage economic development in any way. So, during the period of the British rule, the main aim of the land tenure system was to generate income. But, under this system, no efforts were made towards any economic development and the upliftment of the farmers. In India at the time of independence, there were three main land tenure systems. They are, –
    • The Ryotwari system,
    • The Mahalwari System and
    • The Zamindari system.

Size of Land Holdings and Fragmentation of Fields | UPSC – IAS

  • In India the size of land holdings is too small. This is due to overpopulation. Due to the rapid growth of population and the existing law of inheritance, the agricultural land is divided equally among the male children of the deceased farmer.
  • At present, the per capita available land is only about 0.10 hectare. This is much below the world average of about 4.50 hectares. Over 75% of the land holding are less than one hectare. Such small holdings are not economically viable. In fact, small holdings cannot produce enough to meet the costs of irrigation, improved seeds, chemical fertilizers, insecticides, pesticides and farm machinery.
  • Another important feature of land holdings is that each of the 105 million holdings comprises 4 to 8 plots scattered far away from each other around the farmer’s village. The average size of each plot is not more than one-fifth of a hectare. This type of fragmentation of land poses one of the most serious obstacles to any efforts to increase agricultural productivity in India.
  • Here fragmentation refers to division, and in agricultural point of view it can be defined as, a situation under which a cultivator owns an operational holding consisting of more than one plot of land. Therefore, the fragmented land has been considered as comprising of two or more plots of land which may be separated from one another. These repeated subdivision and fragmentation of land are major problems affecting agriculture. Division of land into equal lots among settlers is followed by further subdivision. Continuous growth of population has further forced the problem as it became necessary to break up and distribute common lands. Hence this system of inheritance made such problems still more worse.

Effects of Fragmentation

There are lots of disadvantages from fragmentation of land. They are,

  • Most of the labour of the farmer and his animals is exhausted in journey from one plot to another.
  • Most of the time of the farmer is lost in shifting animals, fertilizers, seeds and other equipments.
  • A good proportion of cultivated land is wasted in boundaries, hedges, ditches, footpaths, etc.
  • the use of modern farm machinery in small fragments is virtually impossible in the fragmented land.
  • It is responsible for increased overhead costs, including even the cost of production resulting in low returns from agriculture.

Consolidation of Land Holdings | UPSC – IAS

It is important to know that farms in India are not only small in size but also distributed in a scattered way. Unless the farm-land is of reasonable size, farmers cannot make proper use of their resources. In the interest of progressive farming, it is essential that the farmer be given one consolidated piece of land. Hence, the conversion of many small and fragmented holdings in to one or two big farms is called Consolidation of Land Holdings.

Methods of Consolidation

Two methods of consolidation have been adopted in India. They are,

  • Voluntary consolidation: If the farmer agrees voluntarily to get his holdings consolidated, it is called voluntary consolidation. The process of voluntary consolidation in India was first initiated in 1921 in Punjab. It is found to be the best method, as no pressure is exerted on anybody. The work of co-operative consolidation society does not lead to any dispute, but its progress is very slow. Zamindars usually create hurdles in its progress. Laws of favoring voluntary consolidation have been passed in Gujarat, Madhya Pradesh and Bengal.
  • Compulsory Consolidation: When consolidation is made compulsory by law, it is called compulsory consolidation. It may be of two types:

Partial Compulsion: Under this, if a majority of farmers in a village agree to get their holdings get consolidated, then the rest of the farmers too will have to get their holdings consolidated, according to the law.

Complete Compulsion: In this case, the government by legislative enactment introduces an element of compulsion in the process of consolidation. Maharashtra was the first state to enact compulsory consolidation. Now in many states have also passed laws to this effect.

Advantages and Disadvantages of land Consolidation | UPSC – IAS

Advantages of consolidation

  • Scientific methods of cultivation become possible on consolidated land.
  • Time, effort and money wasted in moving from one farm to the other are saved.
  • The farmer feels encouraged to spend money on the improvement of his land.
  • No land is wasted in making boundaries.
  • Irrigation can be done efficiently.

Disadvantages of Consolidation

There are many difficulties in consolidation. The notable ones are:

  • Lack of records: In many areas records showing title to the land are not available.
  • Lack of trained staff: Consolidation work is a technical work, it requires trained persons. Such trained staff is lacking.
  • Expenditure: It is an expensive operation. It is a problem to meet this expenditure.
  • Differences in the Land value: One of the main difficulties pointed out by the Fourth Five Year Plan was variation in the price of land in the villages. This variation is chiefly due to irrigation facilities. In brief, consolidation of land holdings reduces the problem of fragmentation of holdings. While doing so, the size of the farms is enlarged. Hence, it t helps in increasing agricultural production.

Ceiling on Land Holdings | UPSC – IAS

Ceiling on land holdings mean fixation of maximum size of holdings and to take away surplus land, if any, for distribution among others. Land over and above the ceiling limit is called as surplus land, and such surplus land is taken from the landlord on payment of compensation. This surplus land is distributed among small farmers, tenants, landless labourers. The objectives of ceiling on land holdings are;-

  • To minimize inequality in the ownership and use of land so as to provide social benefit to all.
  • To reduce inequality of income from agriculture.
  • To provide self-employment opportunities to agricultural labourers.
  • To satisfy the desire to own land.

Ceiling on land holdings is of two kinds. They are:-

  • Ceilings on Existing Holdings: In this case ceiling is imposed on the present holdings. Land above the ceiling limit is declared surplus and taken by the government.
  • Ceilings on Future Acquisition of Land: Under this, ceiling is fixed on the land that an individual or a family may acquire in future with a view to enlarging their existing holdings.

Progress of Ceilings on Land Holdings: In almost all states of the country ceiling on land has been fixed. In case of irrigated land, land ceiling varies from 4 to 7 hectares; while in case of dry land ceiling varies from 8 to 70 hectares. So far 73.36 lakh hectares of land has been declared surplus.

Advantages of Ceilings on land holdings | UPSC – IAS

  • Reduction in Inequality: Supply of land being limited and its demand being unlimited, it becomes essential that land should be divided among larger number of people. When all farmers get some land, inequality in the distribution of land gets reduced. Agriculture being the main source of income in villages, there will be reduction in income inequality and social inequality as well.
  • Development of Cooperation: It will promote spirit of cooperation among villagers because the land available after imposition of ceiling, can be cultivated on cooperative basis.
  • Increase in cultivated area: Large tracts of land belonging to big zamindars remain uncultivated. When these lands handed over to landless labourers, it may bring them under cultivation. As a result, total cultivated area in the country will increase.
  • More Production: Equal distribution of land may also encourage intensive cultivation resulting in increased agricultural production. Farm management studies conducted in India testified that small farms yielded more production per hectare. It is so because family members themselves cultivate small farms.
  • Increase in Employment: Fixation of ceiling on land holdings is expected to increase employment. On one side, landless farmers get some land for cultivation. On the other, there will be more demand for goods owing to increase in the income of the farmers. To meet the increased demand, more labourers are to be employed.
  • Economic size of holding: Land declared surplus consequent upon ceiling on land holdings could be distributed among small farmers turning their holdings in to economic holdings.
  • Decrease in Class Struggle: With reduction in inequality among the villagers, possibility of class struggle will be minimized. They will live with perfect peace and harmony.
  • Advantages to landless labourers: If ceiling on land holdings is fixed at lower levels in all states, then huge surplus land will be available. It will provide basic holdings to most of the landless labourers. Evaluation: As a result of ceiling on land holdings, roughly 160 lakh hectares of land was likely to be made available as surplus land. However, only 73.36 lakh hectares of land has been declared as surplus. Thus, progress in this direction is very slow.

Land Holdings Distribution in India | UPSC – IAS

  • India is a big country and also called as sub continent. The government of India categorizes farmers with less than 1 ha of land as “marginal” and those with 1-2 ha as “small” farmers. Almost 20% of the survey households were landless and 42.7% had marginal or sub marginal landholding, thus fragmentation of landholdings was high.
  • Data from land and livestock surveys conducted by the National Sample Survey Organization (NSSO) are the most important source of information on distribution of landholdings in India. As part of these surveys, detailed data are collected on ownership and operational holdings, tenancy, nature of land use, status of irrigation, and cropping pattern.
  • The distribution of ownership holding of land in India is extremely unequal. In many states of India, a substantial share of land continues to be in the hands of large landowners (having more than say five hectares of land). States that are particularly noteworthy in this context are Punjab, Haryana, Gujarat, Maharashtra, Karnataka and Andhra Pradesh. Clearly, a substantial potential for land redistribution exists in these states. It may be noted that large landholding sizes in Rajasthan and in parts of some other states in central and western India are also associated with poor quality of land. In contrast, in Kerala, West Bengal and Tripura, three states where substantial land reforms have been implemented, a very small amount of land is now under large holdings.
  • Since independence, in India, a number of steps have been taken to make structural changes in the agrarian societies and land reforms. The Kumarappa Committee, also known as the Congress Committee of Agrarian Reforms, recommended:-
    • Comprehensive measures for land distribution,
    • Creation of basic holdings,
    • Tenancy reforms,
    • Organization of small cooperative reforms and
    • minimum agricultural wages.

But so powerful was the lobby of the big and middle class peasants that the recommendations were shelved. The enthusiasm for land ceiling is much greater now, but it is doubtful whether the results will be encouraging. We all know that, what is socially justified may not be economically efficient and politically acceptable.

About Bardoli Satyagraha | UPSC – IAS

Bardoli Satyagraha upsc

About Bardoli Satyagraha | UPSC – IAS

Bardoli Satyagraha has been the most organized, comprehensive and successful movement of ‘Indian National Movement’. This movement was run in protest against the 22 percent tax raised by the government.
  • The ‘Merta Bandhus‘ (Kalyan Ji and Kunwar Ji) and Dayal Ji of Bardoli started the movement from 1922 AD in support of the farmers. Later it was headed by Sardar Vallabhbhai Patel.
  • In 1920 Bardoli taluka of Surat (Gujarat), the movement of ‘Lagaan’ nor payment was started by the farmers. Not only the land-owning peasants of the ‘Kunbi-Patidar‘ castes participated in this movement, but also the people of the ‘Kaliparaj’ (Black skinned people ) tribe.

About the Crisis | UPSC – IAS

  • In 1925, the taluka of Bardoli in Gujarat did not suffer financial troubles. However, the government of the Bombay Presidency had raised the tax rate by 22% that year, and he despite petitions from civic groups, refused to cancel the rise in the face of the calamities.
  • The situation for the farmers was grave enough that they barely had enough property and crops to pay off the tax, let alone for feeding themselves afterwards.

Gandhi ji’s Contribution

The main caste of farmers ‘Kunbi-Patidar’ in Bardoli with 137 villages and 87,000 population started to organize under the leadership of Kunwar Ji and Kalyan Ji Mehta from 1908 AD. This organization published magazines called ‘Patidar Yuvak Mandal’ and ‘Patel Bandhu’.

Explaining the inter-relationship between the peasant struggle and the national independence struggle, in reference to the Bardoli peasant struggle, Gandhiji said that :-

Whatever the Bardoli struggle may be, it clearly is not a struggle for the direct attainment of swaraj. That every such awakening, every such effort as that of Bardoli will bring swaraj nearer and may bring it nearer even then any direct effort is undoubtedly true.

Sardar Vallabhbhai Patel’s leadership

Sardar Vallabhai Patel was the star attraction of the Bardoli Satyagraha in Gujarat, held to defy the exorbitant indigo land tax. On February 4, 1928, Vallabhbhai Patel took the leadership of the Bardoli peasant satyagraha. First a letter was written to the government against the increased revenue, but there was no positive response from the government.

  • As a result, Patel organized the farmers and told them not to pay the their taxes.
  • Then, He divided Bardoli into several zones – each with a leader and volunteers specifically assigned. Patel also placed some activists close to the government, to act as informers on the movements of government officials.
  • Above all, Patel instructed the farmers to remain completely non-violent, and not respond physically to any incitements or aggressive actions from officials.
  • He reassured them that the struggle would not end until not only the cancellation of all taxes for the year, but also when all the seized property and lands were returned to their rightful owners.

On the other hand , the moderate faction of Congress, through the ‘Surveillance of India Society’, requested the government to check the demand of farmers. A daily magazine called ‘Bardoli Satyagraha‘ was released. The Indian leaders of the Bombay Legislative Council resigned. It was also debated in the UK Parliament. Viceroy Lord Irwin. Also directed Governor Wilson of Bombay to expedite the matter. On the other hand, seeing the possibility of arrest of Patel , Gandhiji reached Bardoli on 2 August 1928 for alternative leadership.

Features of Bardoli Satyagraha | UPSC – IAS

In 1928, an agreement was finally brokered by a Parsi member of the Bombay government. The Government agreed to restore the confiscated lands and properties, as well as cancel revenue payment not only for the year, but cancel the 22% raise until after the succeeding year.

  • Fearing things could go out of hand, the government set up the Maxwell-Broomfield commission to look into the matter.
  • The revenue was reduced to 6.03%.
  • The peasants were returned their confiscated land.
  • Its success gave rise to Sardar Patel, becoming one of the main leaders of the indian independence movement.

Bardoli Satyagraha Criticism | UPSC – IAS

  • The movement was focused on the conditions of the rich and middle-class farmers and largely neglected the poor farmers.
  • It did not raise the problem of agricultural bonded laborer. The Kaliparaj tribe had to work as ancestral laborers of the upper castes under the ‘Hali system’.
  • It is said that the movement was an experiment on Satyagraha as a method of freedom struggle. The basic problems of the peasants were not addressed and bonded labour continued.

Success of Bardoli Satyagraha  | UPSC – IAS

The farmers celebrated their victory, but Patel continued to work to ensure that all lands and properties were returned to every farmer, and that no one was left out.

  • Women also played an important role in this movement, with notable names of Bombay Parsi women Mithuben Petit, Bhaktiva, Maniben Patel, daughter Shardaben Shah and Shadra Shah. People of Bardoli were impressed by Patel.
  • It was women of bardoli who bestowed the title Sardar for the first time, which in Gujarati and most Indian languages means Chief or Leader. It was after Bardoli that Sardar Patel became one of India’s most important leaders.
  • The government had appointed Maxwell-Broomfield Commission to look in to the matter. After a rigorous survey, the raise in taxes was decided to be just 6.03%. But the basic problems of the peasants were left unsolved and bonded labour continued.

Hence the government reduced the rent to 6.03 percent. In this way, the Bardoli peasant movement was successfully completed under the leadership of Sardar Vallabhbhai Patel. Gandhiji said on this success, “Whatever the Bardoli struggle, it is not a struggle for the attainment of Swaraj, but every such struggle is trying to bring us closer to Swaraj”.

About Flag Movement or Jhanda Satyagraha in India | UPSC – IAS

Learn About Flag Movement or jhanda Satyagraha | UPSC

Though the participants of the 1857 Revolt carried a flag, it was Sister Nivedita, Vivekananda’s Irish disciple, who first thought of designing a national flag. The flag which was displayed at the 1906 Calcutta session of the Congress was square-shaped with 108 oil lamps along its borders and Indra’s thunderbolt (Vajra) in the centre. The words ‘Vande Mataram’ appeared on it in Bengali.

In 1916, Pingali Venkayya, a youth from Masulipatnam in Andhra Pradesh, started the Indian National Flag Mission and authored a book called “A National Flag for India.” He approached Gandhiji with his design – a tricolour in white, green and red with a blue charkha in the middle. Thus was born the first truly ‘national’ flag. The British of course, saw it as a symbol of revolution and prohibited it from being flown in public places.

The Jabalpur and Nagpur jhanda Satyagraha was organised to protest against this repression in 1923. Thousands of people courted arrest after taking the flag in procession. The flag became a symbol of India’s aspiration for freedom.

The first public flag hoisting ceremony was held on the afternoon of August 15, 1947 at India Gate. According to Lord Mountbatten, when Pandit Nehru unfurled the flag, a rainbow magically appeared in the cloudless summer sky. Surely, a heavenly salute for a hard-won flag.

 Jhanda Satyagraha in India | UPSC – IAS

Jhanda satyagraha (also known as flag movement) were one of the most common acts of defiance during the nationalist rebellions led by Gandhi and the Indian National Congress throughout the struggle. The nationalist flag was regularly heralded by large processions and nationalist crowds.

In India, Jhanda Satyagraha is a campaign of peaceful civil disobedience during the Indian independence movement that focused on exercising the right and freedom to hoist the nationalist flag and challenge the legitimacy of the British Rule in India through the defiance of laws prohibiting the hoisting of nationalist flags and restricting civil freedoms.

The hoisting of nationalist flags over private and public buildings or government buildings had been a common nationalist act of defiance, especially with the Revolutionary movement for Indian independence and the members of the revolutionary Gadar Party. Such acts of defiance gained popularity across India with the rise of nationalist leaders such, Bipin Chandra Pal and Lala Lajpat Rai.

Jhanda Satyagrahas were conducted most notably in the city of Jabalpur and Nagpur in 1923 but also in many other parts of India.

  • Proliferating during the Non-cooperation movement (1920-1922) and a prominent element of the Salt Satyagraha (1930) and the Quit India movement (1942), this means of revolt combined the hoisting of the nationalist flag with the technique of Satyagraha – non-violent civil disobedience – as pioneered by Mahatma Gandhi.
  • Nationalists were encouraged to violate the law and hoist the flag without resisting arrest or retaliating against police.

Jhanda satyagraha in Jabalpur (1923) | UPSC – IAS

The spark of the jhanda satyagraha (flag movement) in the country spread from Jabalpur. After this the movement spread throughout the country. The jhanda satyagraha was started in March 1923 in Jabalpur – for the tricolor flag hoisting of local authorities. It was a time of political examination for the local leadership.
  • The tussle began when Congress members On 8 March 1923, when the flag was waved at the municipal building, the European Deputy Commissioner was enraged and ordered to take down the flag. This resulted in the flag movement . In violation of the government ban, some volunteers along with Subhadra Kumari Chauhan, Nathuram Modi, took out a procession with a flag.

Jhanda satyagraha in Nagpur (1923) | UPSC – IAS

The nationwide movement was led by Sardar Vallabhai Patel. To suppress this movement, the British government started imprisoning the agitators. Historians say that the British government left no stone unturned to suppress the movement. By August 15, 1923, About 17 hundred agitators were jailed in the four-month-long agitation. The movement finally ended in Nagpur on 17 August.

  • This movement was significant because instead of the British flag, the agitators hoisted the country’s flag in this movement.
  • In the end, the British negotiated an agreement with Vallabhbhai Patel and other Congress leaders permitting the protestors to conduct their march unhindered and obtaining the release of all those arrested.

Jhanda satyagraha in Karnataka (1938) | UPSC – IAS

Other notable jhanda satyagrahas were organised in Mysore (now in Karnataka) in 1938 known as Shivapur Dhwaja Satyagraha. Under leadership of T.Siddalingaya president of Mysore Congress.

  • The first conference of Mysore congress was conducted in 1938 at Shivapura. The conference has decided to organize a great satyagraha in Shivapura. T. Siddalingaya was elected as the president of the committee for the satyagraha.
  • Realising the trouble, the Mysore administration banned any meeting within three kilometers from the city and prohibited the hoisting of tricolour flag.
  • On 8th April 1938, T. Siddalingaya was taken in procession in a bullock cart in which around 10000 people participated.
  • The participants proclaimed their faith in the leadership of Gandhiji. The flag was hoisted on 9th April 1938 by T. Siddalingaya. He was then arrested by the police. This incident is known as the Shivapura Dhwaja Satyagraha.
  • As a part of state-wide Satyagraha, the flag was hoisted at Vidurashwatha in Kolar district of Mysore state, 33 people were killed in open police firing.

Fake news in India and its Countermeasures | UPSC – IAS

Recent Examples of Fake News in India | UPSC - IAS

Recent Examples of Fake News in India | UPSC - IAS

Fake news in India and its Countermeasures | UPSC – IAS

Fake news in India refers to misinformation or disinformation in the country which is spread through word of mouth and traditional media and more recently through digital forms of communication such as – morphed images or edited videos, click-baits, motivated stories, hate speech,  memes, unverified advertisements and social media propagated rumours etc.

Misinformation and fake news in India:-

  • In India – Fake news, rumours, morphed images, click-baits, motivated stories, hate speech etc. spread virally through platforms like WhatsApp, Facebook, Twitter etc among 35 crore internet users in India. They target not only political figures, but also religious minorities and dissenting individuals, with propaganda rooted in domestic divisions and prejudices.

Consequences of fake news in India:-

  • The consequences of such targeted misinformation range from riots, death threats to actual murders. In the past year, more than two dozen people have been lynched by mobs spurred by nothing more than rumours sent over WhatsApp. More recently, during the COVID-19 pandemic, closed messaging services were used to spread inaccurate information.
  • Fake news spread through social media in the country has become a serious problem, with the potential of it resulting in mob violence, as was the case where at least 20 people were killed in 2018 as a result of misinformation circulated on social media.

Use of Deep fake:- 

  • The introduction and evolution of AI technology that is now capable of creating “deep fake” video content, using bots to micro-target populations with ads, and participate in human-like conversations, presents imminent future dangers of exponentially multiplying the current threats. Threats to democratic institutions and security landscape.
  • Unregulated social media has empowered state and non-state actors with the means and know how to co-opt the media landscape in pursuance of illegal and terrorist activities, such as – radicalization, child pornography, human trafficking, selling narcotics etc. It has also allowed foreign and domestic actors to interfere in democratic functioning of nations through unidentified use of political advertisements during elections, spreading disinformation about government bodies etc.

Fake news in india | UPSC – IAS

Rasmus Kleis Nielsen, director at Reuters Institute for the Study of Journalism, thinks that “the problems of disinformation in a society like India might be more sophisticated and more challenging than they are in the West”.

The damage caused due to fake news on social media has increased due to the growth of the internet penetration in India, which has risen from 137 million internet users in 2012 to over 600 million in 2019.

WhatsApp Messenger

  • India is the largest market for WhatsApp, with over 230 million users, and as a result it is one of the main platforms on which fake news is spread. One of the principal problems is that receivers believe anything sent to them over social media due to lack of awareness.

Recent Examples of Fake News in India | UPSC – IAS

Coronavirus

  • Misinformation related to coronavirus COVID-19 pandemic is in the form of social media messages related to home remedies that have not been verified, fake advisories and conspiracy theories. At least two people have been arrested for spreading fake news about the coronavirus pandemic.
  • The Press Information Bureau brought out a fact check on 24 March 2020 that stories about a financial emergency being imposed in India are fake. To counteract this, over 400 Indian Scientists are working together to debunk false information about the virus, as of 14 April.

Citizenship (Amendment) Act 2019

  • The Supreme Court of India asked the central government of India to consider “a plea for publicising aims, objectives and the benefits of the Citizenship Amendment Act (CAA) to weed out fake news that was being circulated on the issue.” The plea lawyer stated “I visited Jamia and Seelampur yesterday. 95% protesters do not know about the CAA. They feel the law will take back their citizenship. Miscreants are circulating fake news”.
  • Around 5000 social media handles from Pakistan were part of “actively spreading fake and false propaganda” on CAA, some using “deep fake videos” in the process. 15,000 social media mediators worked overtime to identify fake news related to CAA from platforms such as Twitter, Facebook, TikTok and Helo.
  • The Indian Ministry of External Affairs called out the Prime Minister of Malaysia for “factually inaccurate remarks” on the CAA. Bangalore Police Commissioner called for people not to believe fake news related to CAA while the Assam Police cautioned people to be careful while posting on the social media. Delhi Police was reported to be monitoring the social media for misinformation being spread related to violence at Jamia Millia Islamia in relation to CAA.

Kashmir

  • Misinformation and disinformation related to Kashmir is widely prevalent. There have been multiple instances of pictures from the Syrian and the Iraqi civil wars being passed off as from the Kashmir conflict with the intention of fuelling unrest and backing insurgencies.

Other examples

  • Imposters posing as army personnel on the social media have been called out by the Indian Army as false news and disinformation.
  • 2013 Muzaffarnagar riots, which claimed over 60 lives and displaced thousands, was fueled by videos circulated on WhatsApp.
  • As part of the 2016 Indian banknote demonetisation, India introduced a new 2,000-rupee currency note. Following this, multiple fake news reports about “spying technology” added in the banknotes went viral on WhatsApp and had to be dismissed by the government.

Countermeasures against Fake news | UPSC – IAS

Self-Regulation by the platforms: A self regulatory framework can help social media platforms fulfil their obligation to the public to limit spread of misinformation, extremism, hate speech, etc. and build trust with community members. Some steps that can be taken in this direction are- Following a set of Human Rights Principles for Content Moderation based on international human rights law: legality, necessity and proportionality, legitimacy, equality and non discrimination.

  • Implementing measures that limit theCountermeasures Fighting Fake News upsc virality of misleading content through limitations of some functionalities; opt-in features to receive group messages etc.
  • Give users the alternative option, in an easy and intelligible manner, to decide on such issues as what information they want to see, and how they are targeted.
  • Ensuring that automated tools, such as algorithmic ranking, do not intentionally, or unintentionally, unduly hinder access to election-related content and the availability of a diversity of viewpoints to users.
  • Expanding the number of moderators and investing to improve quality of content review, particularly in at-risk countries, through development of sophisticated tools and technologies. For instance, YouTube, which along with the usage of AI , employs 10,000 people globally for monitoring and removal of objectionable content, took down 8 million videos in 2018 during a three-month period, 81% of which were removed automatically, and three-quarters of those clips never received a single view.
  • Redefining the role of the Government: Governments should strive to protect the rights and freedoms of its citizens and mitigate the social costs of the social media by providing a strong democratic oversight.

Initiatives to Counter Fake News in India | UPSC – IAS

Various initiatives and practices have been started and adopted to curb the spread and impact of fake news. Some o them are as follows:-

  • In November 2019, the Indian ministry of information and broadcasting planned to set up a FACT checking module to counter the circulation of fake news by continuous monitoring of online news sources and publicly visible social media posts.
    • The module will work on the four principles of “Find, Assess, Create and Target” (FACT). The module will initially will be run by information service officers. Near the end of 2019, the Press Information Bureau (which comes under the Ministry of Information and Broadcasting) set up a fact-checking unit which would focus on verifying news related to the government.
  • In some parts of India like Kannur in Kerala, the government conducted fake news classes in government schools. Some say the government should conduct more public-education initiatives to make the population more aware of fake news.
  • Following over 30 killings linked to rumours spread over WhatsApp, WhatsApp introduced various measures to curb the spread of misinformation, which included limiting the number of people a message could be forwarded to as well as introducing a tip-line among other measures such as suspending accounts and sending cease-and-desist letters.
  • WhatsApp also added a small tag, forwarded, to relevant messages. They also started a course for digital literacy and came out with full page advertisements in newspapers in multiple languages.
  • Twitter has also taken action to curb the spread of fake news such as deleting accounts.
  • In 2018, Google News launched a program to train 8000 journalists in seven official Indian languages including English. The program, Google’s largest training initiative in the world, would spread awareness of fake news and anti-misinformation practices such as fact-checking.
  • Internet shutdowns are used by the government as a way to control social media rumours from spreading. Ideas such as linking Aadhaar to social media accounts has been suggested to the Supreme Court of India by the Attorney General.

Fact-checking in India has become a business, spurning the creation of fact-checking websites such as Boomlive, Alt News, Factly and SMHoaxSlayer.

Solutions that can stop fake news from spreading | UPSC – IAS

  • Encouraging social media companies to define and periodically update content standards and enforcement guidelines: Participation from the different stakeholders, including civil society and law enforcement should be ensured while framing those guidelines and finalised standards and guidelines should be made public for transparency.
  • Making social media platforms liable for obviously illegal content, if it is not removed within a certain period of being reported. There should also be a transparent and rapid redressal mechanism to be used in case of disagreements.
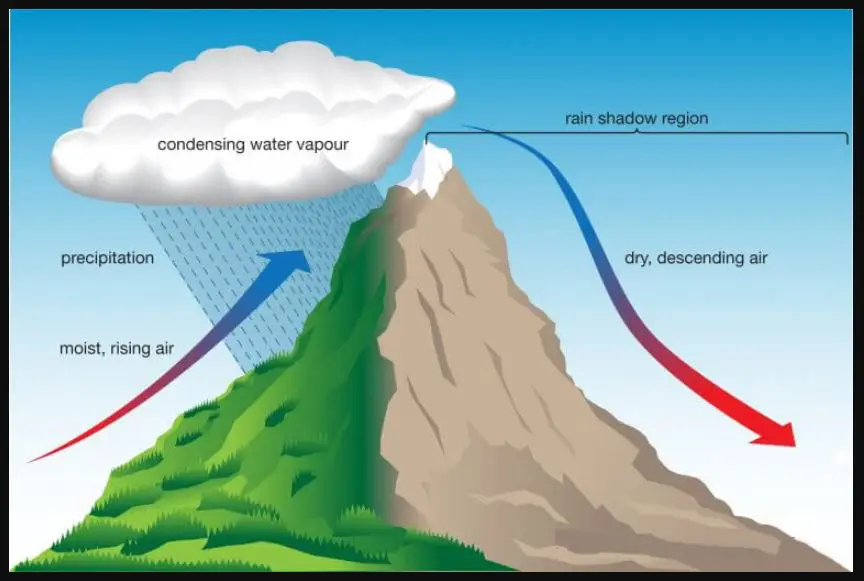
  • Formulating Transparency requirements related to all platform’s core functions in the public information ecosystem: content moderation, content ranking, content targeting, and social influence building.
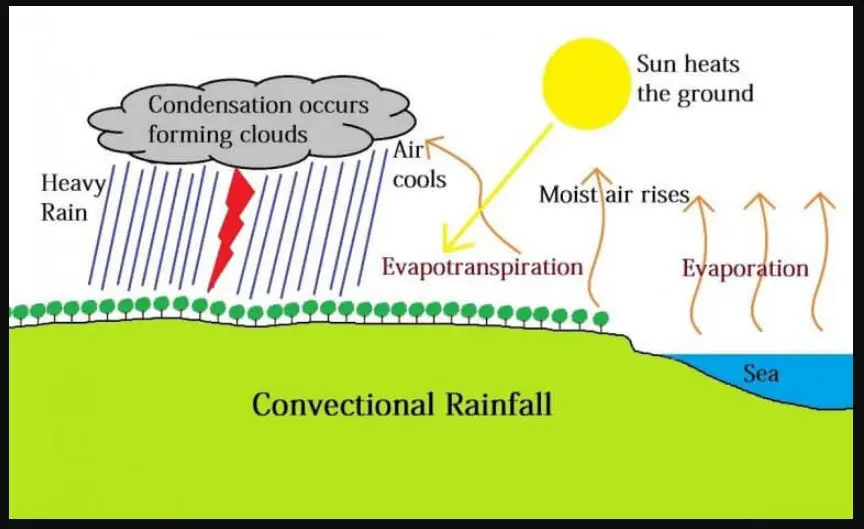
  • Societal capacity building for better usage: Social media does not operate in a vacuum but in an already prevailing socio-economic context. Efforts to address prevailing issues in this context will increase the potential benefits from social media usage.
  • Addressing the systemic issues in society: Online discussions simply mirror what is already happening in the society. There is thus a need to focus on addressing the prevalent issues of communalism, casteism, sexism, extremism, poor law and order etc. A strong enforcement of rule of law will allow greater freedom of expression online and weaken the need for regulation.
  • Increasing accessibility for disadvantaged sections of society: Advantages of social media are restricted for many people to due illiteracy, language barriers and the digital divide in infrastructure between rural and urban areas. This must be addressed to promote inclusion and participation of all.
  • Digital Literacy and Awareness: Responsibility for media literacy and appropriate and safe use of technology exists at several levels – family, school, community and government. Parents, carers and those working with young people are aware of the benefits and potential problems associated with media use. They should be encouraged to educate themselves about these topics and should be empowered to help young people set reasonable limits around media usage in a way that enhances their development & minimizes problematic use.

About alcohol prohibition in India & its Socio-Economic effects | UPSC

About alcohol prohibition in India & its Socio-Economic effects | UPSC

About alcohol prohibition in India & its Socio-Economic effects | UPSC - IAS

Alcohol prohibition and directive principles of state policy (DPSP) | UPSC -IAS

  • The directive principles of state policy (DPSP) in the constitution of India (article 47) state that “the State shall endeavor to bring about prohibition of the consumption except for medicinal purposes of intoxicating drinks and of drugs which are injurious to health”.
  • The Directive Principles are not-justiciable rights of the people but fundamental in the governance of the country. It shall be the duty of the State to apply these principles in making policy laws per Article 47.
  • As Per Article 38, state and union governments, as duty, shall make further detailed policies and laws for implementation considering DPSPs as fundamental policy. In contrary to Article 37, many policies have been implemented by states and union government which go against the DPSPs such as using intoxicating drinks as source of major tax revenue instead of implementing prohibition for better health of people.
  • When the union government feels that alcohol prohibition is no longer useful to the nation, it shall be deleted from DPSPs by bringing a constitutional amendment to remove ambiguity in policy making / direction.
  • Judiciary can repeal any policy/law devised by the government which is diametrically opposite to any DPSP. An existing policy in line with DPSP can not be reversed, however it can be expanded further in line with DPSP. The policy changes applicable under DPSP shall not be reversible unless the applicable DPSP is deleted by constitutional amendment.
  • Many states imposed prohibition of alcohol and later prohibition lifted to collect more revenue/taxes by the states. Lifting / relaxing prohibition of alcohol is unconstitutional which is reversing the earlier implemented policy as per Article 37 as long as alcohol prohibition is part of DPSP.

National Prohibition was advocated by Mahatma Gandhi, as well as by many Indian women. Prohibition, in the states of India that have implemented the policy, has led to lower rates of drinking among men, as well as a decreased incidence of violence against women.

Temperance movement in India | UPSC – IAS

  • The temperance movement in India aims at curbing the use of alcohol in that country. In some places, the temperance movement has led to alcohol prohibition in India, with many temperance organisations continuing their work today.
  • The temperance movement in India often led to the prohibition of alcohol in various states, as with Manipur. In British India, many Indian temperance activists agitated for prohibition in the country.
  • Mahatma Gandhi was a champion of the temperance movement and viewed foreign rule as an obstacle to national prohibition. When India gained independence in 1947, prohibition was included in the Directive Principles of the Constitution of India and the government of several states such as Gujarat introduced it.

What are Dry days ? | UPSC – IAS

Dry Days are specific days when the sale of alcohol is prohibited. Dry Days are fixed by the respective state government. Most Indian states observe dry days on major religious festivals/occasions depending on the popularity of the festival in that region.

  • National holidays such as Republic Day (26 January),
  • Independence Day (15 August) and
  • Gandhi Jayanti (2 October) are usually dry days throughout India.
  • National dry days also occur during Election Commission of India-ordained voting and result days.

Dry days also depend on the establishment selling alcohol. For example, generally 5-star hotels do not have to observe all the dry days that liquor stores and small bars may have to. Dry days are also observed on and around voting days.

States practicing prohibition | UPSC – IAS

Alcohol prohibition in India is in force in the states of Bihar, Gujarat, Mizoram, Nagaland as well as in the union territory of Lakshadweep. All other Indian states and union territories permit the sale of alcohol.

Alcohol prohibition in Bihar | UPSC – IAS

  • Bihar Chief Minister Nitish Kumar officially declared the total ban on 5 April 2016, and said in a press conference, “All type of liquor will be banned in the state from today. Sale [and consumption] of any type of alcohol in hotels, bars, clubs and any other place will be illegal from today onwards.”

Violation of law 

  • Violating the law carries a penalty of 5 years to 10 years imprisonment. On 30 September 2016 Patna High Court ruled that the ban is “illegal, impractical and unconstitutional”.
  • Although even before the High Court order came, the Bihar government had announced that it would enforce a new stringent law from 2 October 2016, only to stay adamant on it after the order. The government had drafted a new law to keep from withdrawing the ban.
  • As per the new liquor law, those found indulging in unlawful import, export, transport, manufacture, possession, sale, intoxicant or liquor could attract a minimum 10 years of jail term which may extend to imprisonment for life besides a minimum fine of Rs 1 lakh which may extend to Rs 10 lakh.

Historic Human Chain

  • On 21 January 2017, more than 3 crore people of Bihar joined hands to form a historic human chain along 12,760 km of roads to support ban on alcohol by Bihar C.M Nitish Kumar. This unprecedented and massive human chain was supported by people from all walks of life and political parties.

Social and Economic effects of alcohol Prohibition in Bihar | UPSC – IAS

Prohibition, in the states of India that have implemented the policy, has led to lower rates of drinking among men, as well as a decreased incidence of violence against women. In the state of Bihar it is observed that:-

  • Within a year of prohibition, the number of murders and gang robberies decreased by 20%.
  • The number of riots fell by 13% and traffic accidents were reduced by 10%.
  • For the economy – spending per household rose: increase in sales of milk by 10%, cheese by 200%, two-wheeled vehicles by 30%, and electrical appliances by 50%.
  • In villages, brick houses are gradually taking the place of more rudimentary cottages since state Prohibition came into effect.
  • At the same time, substance abuse has increased significantly due to liquor being hard to access.

Alcohol prohibition in Gujarat | UPSC – IAS

  • Bombay State had prohibition between 1948 and 1950, and again from 1958. Gujarat has a sumptuary law (laws that try to regulate consumption.) in force that proscribes the manufacture, storage, sale and consumption of alcoholic beverages.
  • The legislation has been in force since 1 May 1960 when Bombay State was bifurcated into the states of Maharashtra and Gujarat.
  • Bombay Prohibition Act, 1949 is still in force in Gujarat state, however there is licensing regime in Maharashtra with granting licenses to vendors and traders.
  • Gujarat is the only Indian state with a death penalty for the manufacture and sale of homemade liquor that results in fatalities. The legislation is titled the Bombay Prohibition (Gujarat Amendment) Act, 2009. The legislation was prompted by numerous deaths resulting from the consumption of methyl alcohol.
  • Predictably, smuggling and illicit sale of alcohol are very common. “Folder” is a slang term of unknown origin, used in Gujarat to refer to a bootlegger who delivers alcohol on-demand.

Online Permits

  • Foreigners and visitors from other parts of India can apply online for a permit. There are 35 stores across the state including nine in Ahmedabad that sell liquor on production of a physical copy of the permit. Once the permit expires, users are to hand-over the unconsumed liquor to the district collector.

Public Interest Litigation

  • Five petitions, including Public Interest Litigation (PIL), have been filed before the Gujarat High Court challenging the prohibition law in the state. Most petitioners have raised concern that prohibition law violates Right to Privacy and are seeking relaxation on consumption in privacy.

Alcohol prohibition in Mizoram | UPSC – IAS

  • The Mizoram Liquor Total Prohibition Act, 1995 banned sale and consumption of alcohol effective from 20 February 1997. In 2007, the MLTP Act was amended to allow wine to be made from guavas and grapes, but with restrictions on the alcohol content and the volume possessed. It is illegal to transport these products out of the state.
  • Mizoram repealed prohibition on 10 July 2014, a period of 17 years after it had been imposed. On that date, the state Legislative Assembly passed the Mizoram Liquor (Prohibition and Control) Act, 2014 (MLPC Act), replacing the MLTP Act. The Presbyterian Church had organised mass prayers in all member churches across the state twice that year opposing the repeal of prohibition.
  • The Mizoram Liquor (Prohibition and Control) Act, 2014 was repealed on 20 March 2019 with the Mizoram Liquor Prohibition Act, 2019, it was a legislation promised by the Mizo National Front. Rules are yet to be notified for the ban in the state.

Alcohol prohibition in Nagaland | UPSC- IAS

The Nagaland Liquor Total Prohibition Act, 1989 (NLTP Act) banned the sale and consumption of alcohol in 1989. Enforcement of the ban is lax and Indian Made Foreign Liquor is readily available. Authorities generally turn a blind eye towards illegal sales. Reports have stated that some police officials themselves engage in bootlegging. The Congress party has termed prohibition a “total failure” and has pleaded for it to be revoked.

  • The excise department had earned around ₹600 lakh (equivalent to ₹47 crore or US$6.6 million in 2019) prior to prohibition.
  • It earned about ₹10 lakh (US$14,000) annually in NLTP Act related fines as of June 2014. The Morung Express estimated that were about 500 illegal liquor bars in Dimapur, the largest city in the state, as of August 2014. Alcohol is also smuggled in from neighbouring Assam.

Alcohol prohibition in Lakshadweep | UPSC – IAS

Lakshadweep is the only union territory that bans the sale and consumption of alcohol. Consumption is permitted only on the island of Bangaram. Bangaram is an uninhabited island, but the Bangaram Island Resort has a bar.

States no longer practicing prohibition | UPSC – IAS

There are five States that no longer practicing prohibition. These states have previously enforced, but later repealed prohibition.

  • Andhra Pradesh
  • Haryana
  • Kerala
  • Manipur
  • Tamil Nadu

Alcohol prohibition in Andhra Pradesh

  • The total prohibition was introduced in Madras State (which included Coastal Andhra and Rayalaseema) when C. Rajagopalachari became Chief Minister in 1952. The ban was re-introduced by N. T. Rama Rao in 1994. N. Chandrababu Naidu repealed the prohibition in 1997, claiming that it was “not successful or feasible because of the leakages within the state and from across the borders”.

Alcohol prohibition in Haryana

  • Bansi Lal led Haryana Vikas Party lift the prohibition on 1 April 1998. The total prohibition was in force in the state from July 1996.

Alcohol prohibition in Kerala

  • Kerala currently allows alcohol to be served in most hotels, bars and airports. A ban imposed by the United Democratic Front government in 2014 was reversed by the Left Democratic Front government in 2017 when they came to power citing heavy losses in state revenue and sharp decrease in tourism industry.
  • On 24 August 2014, Chief Minister Oommen Chandy announced that Kerala would implement prohibition in a phased manner. The decision was a result of factional conflict within the UDF, led by KPCC President V. M. Sudheeran. The decision was supported by the Catholic Church, Indian Union Muslim League (IUML) and the Kerala Congress. Liquor bars in Kerala are required to renew their licenses every year. The state government did not license any bars on 31 March 2014, resulting in the closure of 418 bars.
  • The state government also declared its intention not to renew the licenses of the remaining 313 bars in the state. The state owned Kerala State Beverages Corporation (Bevco) had 338 shops, and Bevco would shut down 10% of them every year. Consumerfed, which has 46 shops, would also be closed. However, sale of alcohol would continue to be permitted in 5-star hotels, and there were fourteen 5-star hotels in the state as of August 2014. Toddy would also continue to be legally sold, and toddy shops would be permitted to operate as before. The state incurred heavy losses due to its tourism-based economy being severely affected by prohibition.
  • However, after the 2016 Elections where the UDF was defeated by the LDF, the newly elected Chief Minister, Pinarayi Vijayan, reversed the policy of prohibition. The Chief Minister stated that the state’s policy would move from prohibition to regulation. In June 2017 the ban was revoked, allowing three stars hotels and above to openly serve alcohol to its customers.The restrictions on bars were also eased with bars being allowed to remain open till 2300 instead of previous 2200 with new bars being allowed to apply for license. Airport lounges were also allowed to start serving alcohol again.

Alcohol prohibition in Manipur

  • Prohibition is enforced in the Imphal East, Imphal West, Thoubal and Bishnupur districts of Manipur. Prohibition was enforced statewide by the Raj Kumar Ranbir Singh government with effect from 1 April 1991. Local brews called ashaba and atingba are available in most areas, and authorities usually ignore their sale and consumption.
  • In 2002, the Okram Ibobi Singh government lifted prohibition in the five hill districts of Manipur. The state Legislative Assemble passed the Manipur Liquor Prohibition (Amendment) Act, 2002 on 31 July 2002 lifting prohibition in the districts of Chandel, Churachandpur, Senapati, Tamenglong and Ukhrul.
    In 2015, Chief Minister Okram Ibobi Singh stated in the Manipur state assembly that the state government was looking at the option of lifting prohibition in the state, but liquor ban still continues in the state.

Alcohol prohibition in Tamil Nadu

  • The total prohibition was introduced in Madras State when C. Rajagopalachari became Chief Minister in 1952. In 1971, the DMK government led by M. Karunanidhi suspended it on 30 August 1971 and allowed the sale of arrack and toddy.
  • In 1983, after previous serial introduction of prohibition and its revocation the state owned liquor distribution company TASMAC was established by the then Chief Minister M. G. Ramachandran. The TASMAC has a monopoly over wholesale and retail vending of alcoholic beverages. Since then, various prohibitions were installed in form of reduction of TASMAC shops, however, the alcohol selling is still legal.

Malnutrition in India its types, causes and effects | UPSC – IAS

Types of Malnutrition | UPSC - IAS

Malnutrition in India its types, causes and effects | UPSC – IAS

Malnutrition is a term that refers to any deficiency, excess or imbalance in somebody’s intake of energy and/or nutrients. It can either be due to inadequate intake or an excess intake of calories. The term malnutrition covers two broad groups of conditions are as follows:-

  • Undernutrition – This includes stunting (low height for age), wasting (low weight for height), underweight (low weight for age) and micronutrient deficiencies or insufficiencies (a lack of important vitamins and minerals)
  • Overnutrition – This includes overweight, obesity and diet-related non-communicable diseases (such as cardiovascular disease, hypertension, cancer, and type-2 diabetes.).

Types of Malnutrition | UPSC – IAS

  • Marasmus – It is a form of severe malnutrition. Nutrient deficiency is the main cause of marasmus. It occurs in children that don’t ingest enough protein, calories, carbohydrates, and other important nutrients. This is usually due to poverty and a scarcity of food.
  • Kwashiorkor – It is a form of severe protein malnutrition. In this type malnutrition produced by a severely inadequate amount of protein in the diet.

Fundamental Causes behind Malnutrition in India | UPSC – IAS

The causes and consequences of malnutrition are complex, and it will require the concerted efforts of all social institutions, including the social work profession, to combat malnutrition effectively.

  • Barriers to health services include – High cost of care. Inadequate or no insurance coverage. Lack of availability of services.
  • Poverty – It hinders the accessibility of adequate food. (Poverty is the single most common cause of food insecurity)
  • Social strains on Women – Early marriages of girls leads to teenage pregnancies resulting in low birth weight of the newborns, poor breastfeeding practices and poor complementary feeding practices.
  • Lack of availability of safe drinking water hinders proper digestion and assimilation of food and also cause water and food borne diseases.
  • Poor sanitation – It is linked to transmission of diseases such as cholera, diarrhoea, dysentery, hepatitis A, typhoid and polio and exacerbate stunting. It reduces human well-being, social and economic development. Poor sanitation and environmental conditions lead to spread of many diseases that sap children’s energy and stunts their growth.
  • illiteracy in women and large household size.
  • Lack of Awareness: about nutritional needs of infants and young children.

Malnutrition In India | UPSC – IAS

Despite India’s 50 percent increase in GDP since year 2013, more than one third of the world’s malnourished children live in India. Among these, half of the children under 3 years old are underweight.

  • An approximate 23.6% of the population of India live below a purchasing power of 92 INR a day. This poverty does not directly lead to malnutrition but it leaves a large piece of the population without sufficient amounts of food.

The World Bank (WB) estimates that India is one of the highest-ranking countries in the whole world for the number of children suffering from malnutrition. The prevalence of underweight children in India is among the highest in the world and is nearly double that of Sub Saharan Africa with dire consequences for mobility, mortality, productivity, and economic growth.

  • One of the major causes for malnutrition in India is economic inequality. On account of the low social status of the population, their diet often lacks in both quality and quantity. Mostly Women who suffer from malnutrition are less likely to have healthy babies.
  • Nutrition deficiencies inflict long-term damage to both individuals and society. Compared with their better-fed peers, nutrition-deficient individuals are more likely to have infectious diseases such as pneumonia and tuberculosis, which lead to a higher mortality rate.

Effects of Malnutrition in India | UPSC – IAS

Poverty increases the risk of, and risks from, malnutrition. Low income families are more likely to be affected by different forms of malnutrition. Moreover, malnutrition increases health care costs, reduces productivity & morale, and slows economic growth, which can perpetuate a cycle of poverty and ill-health.

  • Increased vulnerability to diseases: Undernutrition increases the risk of infectious diseases like diarrhoea, measles, malaria and pneumonia.
  • Developmental delays: Chronic malnutrition can impair a young child’s physical and mental development. Cognitive impairment resulting from malnutrition may result in diminished productivity in academic performance.
  • Low productivity later in life: As per estimates of World Bank, childhood stunting may result in a loss of height among adults by 1%, which may further lead to a reduction in individuals economic productivity by 1.4%
  • Poor maternity health: Undernutrition puts women at a greater risk of pregnancy-related complications and death (obstructed labour and hemorrhage).
  • Barrier to socio-economic development: Widespread child undernutrition greatly impedes a country’s socioeconomic development and potential to reduce poverty.

Why malnutrition is a problem ? | UPSC – IAS

Underlying causes of malnutrition – The lack of money for food; and insufficiency of food production. It is stressed that much agricultural land is employed for purposes other than the production of food. Other causes of malnutrition include changes in local food habits and in food technology.

  • Reduced household incomes: In recent years slowdown in economic growth, stagnant rural wages and high levels of unemployment have affected household incomes and limited their ability to invest in nutritional food.
  • Underfunding: For instance, in a response to a parliamentary question in December 2019, the Minister for Women and Child Development presented data which showed that only about 32.5% of the funds released for Poshan Abhiyaan from 2017-18 onwards had been utilised.
  • Poor implementation of schemes: Anganwadi centres were established under ICDS to provide basic healthcare education and services across the country. Many workers are unable to play an effective role in attending to the problem of malnutrition because of low wages and inadequate training.
  • lack of access to safe water, sanitation and hygiene, ignorance and lack of education, social and cultural factors like child marriage, caste barriers etc.

Solution to the problem of malnutrition (In brief) Increasing yields by organic manuring and mixed cropping; devoting more land to staple food production; changes in food habits and in food technology.

Steps taken by Government for nutritional well being | UPSC – IAS

  • POSHAN Abhiyaan or National Nutrition Mission: It is Government of India’s flagship programme to improve nutritional outcomes for children, pregnant women and lactating mothers.
    • Under it the Anemia Mukt Bharat (AMB) Strategy was launched in 2018 with efforts to improve Iron and Folic Acid (IFA) supplementation, behaviour change and anaemia-related care and treatment across six target groups including pregnant women, lactating mothers, and children.
  • Integrated Child Development Scheme (ICDS): It aims to improve the nutritional and health status of children in the age-group 0-6 years and reduce the incidence of mortality, morbidity, malnutrition and school dropout.
  • Public Distribution System: It provides coverage to upto 75% of rural population and upto 50% of urban population for receiving highly subsidized food grains under Targeted Public Distribution System.
  • Midday meal scheme: The scheme provides meals for all school children studying in Classes I-VIII of Government, Government-Aided Schools.

Eradicating Hunger poverty and Malnutrition together in India | UPSC – IAS

In today’s world, eradicating hunger, food insecurity and all forms of malnutrition calls not only for reduced rural poverty and improved resilience of the most vulnerable people, but also for efficient food systems which are able to deliver sufficient and nutritious food for everyone. However, to make this happen, strong political commitment at global, regional and especially national levels is necessary.

To Enhance the effectiveness of the POSHAN Abhiyaan in India:-

  • Implement POSHAN-plus strategy which apart from continued strengthening the four pillars (technology, convergence, behavioural change and capacity building) of the Abhiyaan also requires addressing the governance challenges of National Health Mission (NHM)/ ICDS delivery mechanism and renewed focus on
    • Complementary feeding (usually targeted at the age range of 6-24 months)
    • Investments in education of girls and women, reduce early marriage and early pregnancy, improving care during and after pregnancy etc.
  • Availability of regional food items and cultural preferences may also be integrated with this abhiyaan to make it inclusive.
  • Enhance the reach of the POSHAN Abhiyaan: Since the Anganwadi centres (AWCs) are at the heart of POSHAN Abhiyaan, it is imperative to enhance their reach. Therefore, mini Anganwadi centres should be set up so that children, pregnant and lactating women who may not be able to travel longer distances, have easier access to them.
  • Institutionalise Capacity Building: Regular trainings for Anganwadi; availability of basic amenities such as electricity, growth monitors, supplies are imperative for proper functioning of the AWCs and the effective provision of services.
  • Strengthen Coordination: All the programmes of the government having direct or indirect impact on the nutrition must be brought under the POSHAN Abhiyaan.
  • Nurture Community Approach: Despite strong efforts, community involvement in POSHAN Abhiyaan has been substandard. State specific efforts should be made (keeping in view the diversity and intersectionality of the society) for ensuring community participation.

Conclusion and A way forward  | UPSC – IAS

  • Developing an employment-centred growth strategy: which includes universal provision of basic services for education, health, food and social security.
  • Strengthening present initiatives: Direct interventions such as supplementary nutrition (of good quality including eggs, fruits, etc.), growth monitoring, and behaviour change communication through the ICDS and school meals must be strengthened and given more resources.
  • Need of Data initiative: A modern data initiative leveraging and combining aspects of the NFHS, the National Nutrition Monitoring Bureau and the National Sample Surveys that collected data on detailed household-level consumption and expenditure on various food items should be considered.
  • Improve dietary pattern by promoting production and increasing per capita availability of nutritionally rich food.
  • Targeted approach: The government agencies in India need to adopt a comprehensive and coordinated multisectoral approach which is formulated by taking into account the varied nature of local-level challenges.
  • Food fortification: A proposed policy would provide for adding essential vitamins and minerals (iron, folic acid, vitamin, iodine) to food items (rice, wheat flour, salt, edible oil, milk) sold in markets. The Centrally Sponsored Pilot Scheme on Fortification of Rice & its distribution through Public Distribution System is a step in the right direction.